Solubility of nitrogen in methane, ethane, and mixtures of methane and ethane at Titan-like conditions: A molecular dynamics study
Abstract
We have studied the temperature dependence of the solubility of nitrogen in methane, ethane, and mixtures of methane and ethane using vapor-liquid equilibrium simulations of binary and ternary mixtures of nitrogen, methane and ethane for a range of temperatures between K and K at a pressure of atm, thermodynamic conditions that may exist on the Saturn’s giant moon, Titan. We find that –(i) the solubility of nitrogen in both methane and ethane decreases with increasing temperature; (ii) the solubility of nitrogen in methane is much larger compared to that in ethane at low temperatures, (iii) solubility of nitrogen in a ternary mixture of methane, ethane, and nitrogen increases upon increasing mole-fraction of methane. Our results are in quantitative agreement with the recent experimental measurement of the solubility of nitrogen in methane, ethane, and a mixture of methane and ethane. Furthermore, we find a strong temperature-dependent surface adsorption of nitrogen at the nitrogen-hydrocarbon interface, previously unknown. We have also investigated surface tension of the gas-liquid interface and find that it decreases upon decreasing temperature. Moreover, we find that the interfacial layer of adsorbed nitrogen and ethane show a preferential orientational ordering at the interface.
I Introduction
Besides earth, Saturn’s giant moon Titan is the only other planetary body in our solar system that has stable and accessible liquid on its surface, an active hydrologic cycle similar to Earth, and a dense atmosphere with a pressure of about times that of Earth Lunine and Atreya (2008); Lorenz and Mitton (2010); Hayes et al. (2018). Early interest in a methane cycle on Titan Flasar (1983); Toon et al. (1988) was motivated by Voyager 1’s discovery of a thick, nitrogen-based atmosphere with a significant methane abundance. Ethane clouds in the Stratosphe were later identified by the Cassini at high northern latitudes Lunine et al. (1983); Brown et al. (2008). Cassini mission to Saturn has further revealed many features of this moon including the existence of large liquid hydrocarbon lakes and seas composed primarily of methane and ethane in different ratios Cordier et al. (2009). With the low surface-temperature of about K and the pressure about atm, both methane and ethane condense out of the atmosphere and exist in the stable liquid phases on the surface in dynamic equilibrium with its atmosphere Lorenz and Mitton (2010).
Cassini’s Radio Detection and Ranging (RADAR) observations further suggested transient bright features on the second largest hydrocarbon sea, Ligeia Mare, known as ”Magic Islands” Hofgartner et al. (2014, 2016). Hofgartner et. al. have argued that these features could not be image artifacts or permanent geophysical structures but are consistent with ephemeral phenomena such as suspended solids, bubbles, waves and tides on TitanHofgartner et al. (2016). Using a numerical model Cordier et al. (2017) and existing solubility data of nitrogen in methane and ethane Llave et al. (1985, 1987), Cordier et. al. have hypothesized that these transient bright features may correspond to dissolution of nitrogen, giving rise to large nitrogen bubbles detected as bright objects by Cassini’s RADAR. Motivated by this, laboratory measurements of solubility of nitrogen in liquid methane, ethane, and mixtures of methane and ethane, the primary components of seas and lakes on Titan, have been carried out Malaska et al. (2017); Chevrier and Farnsworth (2018). They find that the nitrogen’s solubility in methane is much larger as compared to ethane. Furthermore, the solubility of nitrogen in both methane and ethane decreases upon decreasing temperature. Based on these results, various scenarios regarding the exsolution of nitrogen from the lakes has been proposed including exsolution of nitrogen with increasing temperature and exsolution of nitrogen when a methane-rich region meets an ethane-rich region. While thermodynamic models have been developed and experiments have been performed, a microscopic picture of the dissolution of nitrogen is still lacking. Standard methods for calculating solubility in the limit of infinite dilution is Widom insertion method Widom (1966). Since the solubility of nitrogen is very high in both methane and ethane, we have performed molecular dynamics vapor-liquid equilibrium (VLE) simulations Buldyrev et al. (2007); Minkara et al. (2018); Panagiotopoulos (2002, 1987); Potoff and Siepmann (2001); Morrow and Harrison (2019) of binary mixtures of methane and nitrogen, ethane and nitrogen as well as ternary mixtures of methane, ethane, and nitrogen to investigate the solubility of nitrogen in methane, ethane, and mixtures of methane and ethane at Titan-like conditions. The paper is organized as follows: In the method section, we describe our simulation approaches for all the thermodynamic conditions studied here. In the Results section, we present the results for both the binary and ternary systems. Finally, we conclude our studies with summary and discussion.
II Method

We have carried out vapor-liquid equilibrium (VLE) simulations of (i) binary mixtures of nitrogen and methane, (ii) nitrogen and ethane for a range of temperatures between K and K, and (iii) ternary mixtures of nitrogen, methane, and ethane containing different fractions of methane and ethane at temperature K. All the simulations were performed in Gromacs4.6.5 Berendsen et al. (1995); Lindahl et al. (2001); Van Der Spoel et al. (2005). The trappe-UA force field Keasler et al. (2012); Wick et al. (2005, 2000); Martin and Siepmann (1999) was used to model methane, and ethane was modeled using an improved parameterization of ethane, trappe-UA2 Shah et al. (2017). Trappe-small parameterization was used to model nitrogen. Lorent-Bertloth Frenkel and Smit (2001) rule was used to model the cross interactions of nitrogen with methane and ethane. The short-range van der Wall interactions were treated with a cut-off of nm and particle-mesh-Ewald(PME) Frenkel and Smit (2001) was used for the long range interactions. Since the system is not homogeneous, dispersion corrections to the energy and pressure were not applied. First, the liquid phase simulations of methane or ethane was performed at pressure corresponding temperatures and at pressure, atm. Separately a gas-phase simulation was performed with nitrogen at the same pressure and temperature and subsequently the simulation boxes of two nitrogen and methane was put together to form a simulation box consisting of nitrogen-ethane system as shown in Figure 1. The dimension of the final simulation box was nm. In such a box the interface is stable and forms along the smallest surface area in the -plane, perpendicular to the long-axis. The number of molecules of methane and ethane was fixed to and for all the binary mixture simulations (nitrogen-methane, nitrogen-ethane) and the number for nitrogen molecules varied for different temperatures depending on the solubility and the gas phase density. If the same number of molecules of nitrogen are used for the temperatures where the solubility is small, the box size would be enormously large and the computational load of the Ewald summation would be very high. The equations of motion are integrated with a time step of fs and velocity rescaling is used to attain constant temperature and anisotropic Berendsen barostat for constant pressure, atm in the -direction. After the equilibration for ns, we ran the simulations for additional ns for each state point and the equilibrium averages are calculated from these trajectories.
III Results
Solubility of nitrogen in methane and ethane
To compute the solubility, we measure the mole-fraction of nitrogen in the liquid phase of methane/ethane in the nitrogen-methane and nitrogen-ethane binary mixtures at equilibrium. To avoid the interface, we define the liquid phase (or the gas phase) as the region where the -derivative of the density of methane/ethane and nitrogen is zero (ses Fig. 1). We count the number of molecules of nitrogen, , in the liquid phase of methane/ethane and similarly count the number of molecules of methane/ethane, or , in the liquid-phase for the corresponding binary mixture simulations. The solubility as measured by the mole-fraction, , of nitrogen in the liquid phase is defined as
| (1) | ||||
| (2) |
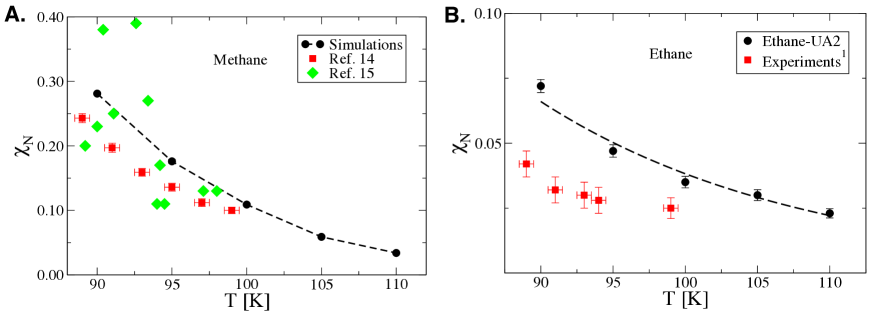
In Fig. 2(A), we show the solubility of nitrogen in methane for temperatures , and K respectively. Consistent with the experimental results, we find that the solubility decreases upon increasing temperature. To compare the simulation results with experiments, we also show the data from two different experiments Malaska et al. (2017); Farnsworth et al. (2017); Chevrier and Farnsworth (2018). The solubility values calculated in our simulations are very close to experimental values with small deviations at lower temperatures. The experimentally measured value of solubility at K is Malaska et al. (2017) as compared to the value in our simulations. In Fig. 2(B), we show the Mole-fraction, , of the nitrogen in ethane as a function of temperature. For a comparison, we also plot the data from Ref. Malaska et al. (2017). Nitrogen in ethane exhibits a decrease of solubility with temperature and are in quantitative agreement with experimental values. The solubility values of nitrogen for the nitrogen-methane and nitrogen-ethane systems are also listed in Table I.
| (K) | |||||||
| M | 1.00 | 0.00 | 0.278 | 0.002 | 90 | ||
| E | 1.00 | 0.00 | 0.176 | 0.003 | 95 | ||
| T | 1.00 | 0.00 | 0.109 | 0.002 | 100 | ||
| H | 1.00 | 0.00 | 0.059 | 0.002 | 105 | ||
| A | 1.00 | 0.00 | 0.034 | 0.001 | 110 | ||
| N | |||||||
| E | |||||||
| E | 0.00 | 1.00 | 0.072 | 0.003 | 90 | ||
| T | 0.00 | 1.00 | 0.047 | 0.002 | 95 | ||
| H | 0.00 | 1.00 | 0.035 | 0.002 | 100 | ||
| A | 0.00 | 1.00 | 0.035 | 0.002 | 105 | ||
| N | 0.00 | 1.00 | 0.031 | 0.002 | 110 | ||
| E | |||||||
| M | 0.067 | 0.002 | 0.855 | 0.002 | 0.077 | 0.002 | 90 |
| I | 0.139 | 0.002 | 0.777 | 0.002 | 0.083 | 0.003 | 90 |
| X | 0.290 | 0.002 | 0.594 | 0.002 | 0.115 | 0.002 | 90 |
| T | 0.371 | 0.002 | 0.490 | 0.002 | 0.138 | 0.002 | 90 |
| U | 0.448 | 0.002 | 0.391 | 0.002 | 0.160 | 0.002 | 90 |
| R | 0.528 | 0.002 | 0.282 | 0.002 | 0.189 | 0.002 | 90 |
| E | 0.595 | 0.002 | 0.182 | 0.002 | 0.222 | 0.002 | 90 |
| 0.659 | 0.002 | 0.086 | 0.002 | 0.254 | 0.002 | 90 |
Surface Tension
To understand the temperature dependence of the solubility, we next studied the temperature dependence of the surface tension, which is readily available from the molecular dynamics simulations. The surface tension, , is defined as
| (3) |
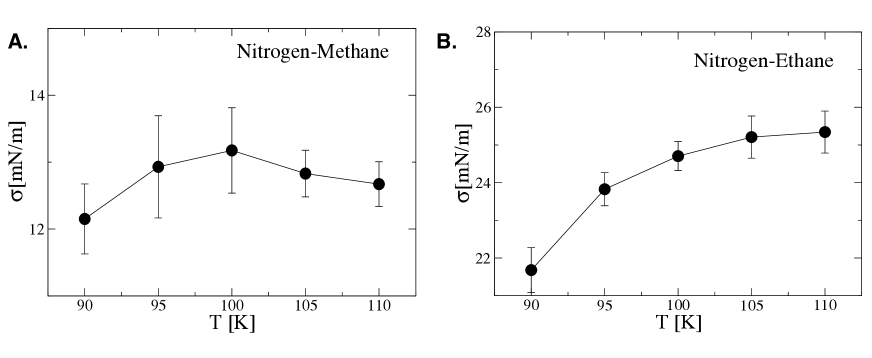
where is the box-length in the -direction and , , are the diagonal components of the pressure tensor in the , , and -directions, respectively. A factor of accounts for the presence of two interfaces in the simulation box. Figures 3 (A) and (B) show the temperature dependence of the surface tension, , for the nitrogen-methane and the nitrogen-ethane binary mixtures, respectively. We find that the surface tension of nitrogen-methane interface is about smaller than the surface tension of the nitrogen-ethane interface for all the temperatures investigated here. Furthermore, we find that decreases with decreasing temperature for the nitrogen-ethane system. For the nitrogen-methane system, surface tension shows a non-monotonic dependence on temperature owing to larger partial pressure of methane at K. The partial pressure of ethane is negligible for all the temperatures studied here. Indeed, we don’t see a single molecule of ethane in the vapor phase over the time scale of our simulations. Our results for surface tension values are in quantitative agreement with the experimental data Baidakov et al. (2011, 2012); Baidakov and Khotienkova (2016); Blagoi (1960) for both nitrogen-methane and nitrogen-ethane systems.
Solubility of nitrogen in a mixture of methane and ethane
We next studied the solubility of nitrogen in a ternary mixture of methane, ethane, and nitrogen containing different fractions of methane/ethane at K and atm. In Fig. 4(A), we show the solubility of nitrogen for the nitrogen-methane-ethane system as a function of different mole-fraction of methane in the liquid-phase. Since the partial pressure of methane at this temperature and pressure is non-zero, the mole-fraction of methane in the liquid-phase is not the same as the fraction of methane in the simulation box. The methane mole-fraction, , in the liquid phase is defined as
| (4) |
where, , , and are the numbers of molecules of methane, ethane, and nitrogen in the liquid-phase, respectively. Similarly the solubility as measured by the mole-fraction, , of nitrogen in the liquid-phase is defined as
| (5) |
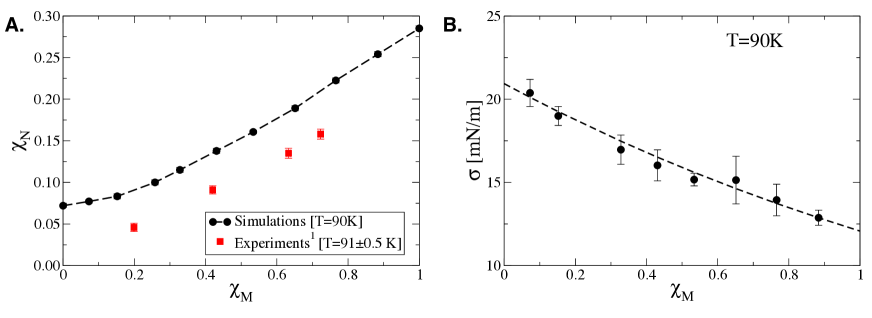
To compare our simulation results with experiments, we also show the solubility data from Ref. Malaska et al. (2017). We find that solubility of nitrogen increases with increasing mole-fraction of methane in the liquid-phase, similar to the experimental observations Malaska et al. (2017). Simulation results are in good agreement with the experimental data with slight overestimation of the solubility for all the mole-fractions of methane. In Fig. 4(B), we show the behavior of surface tension as a function of mole-fraction of methane in the liquid-phase. We find that the surface tension decreases with increasing mole-fraction of methane. The solubility values of nitrogen for the nitrogen-methane-ethane system are summarized in Table I.
Adsorption of nitrogen at the interface
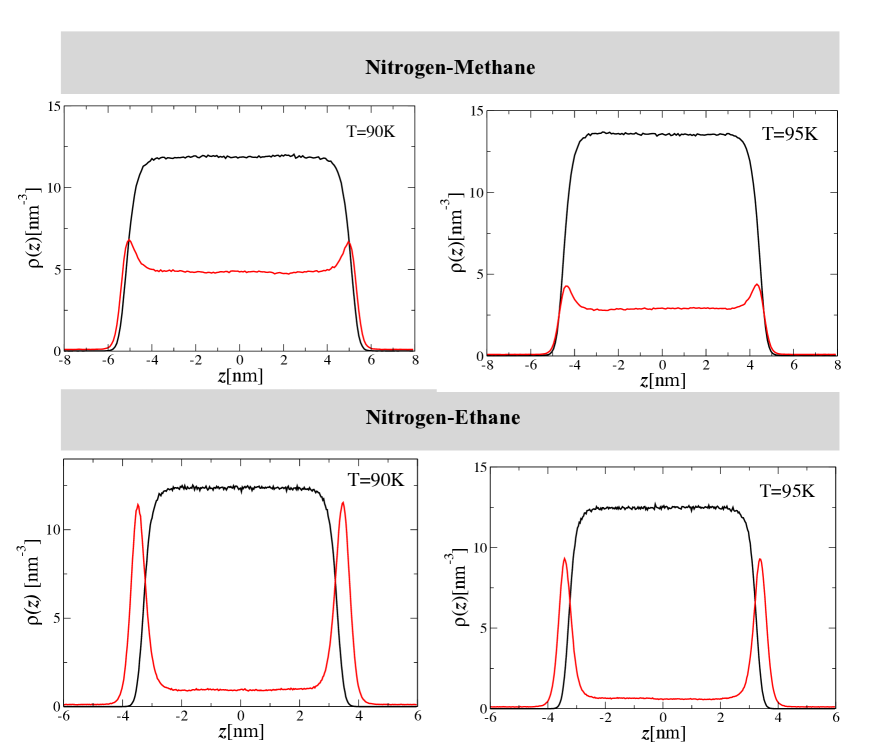
In this section, we investigate the adsorption of nitrogen at the nitrogen-methane and the nitrogen-ethane interface. In Fig. 5, we show the density profile of nitrogen and methane/ethane as a function of temperature for both nitrogen-methane and nitrogen-ethane systems at two different temperatures K and K . We find that adsorption of nitrogen at the interface between vapor and liquid phase is very high and increases upon decreasing temperature. Furthermore, the degree of adsorption of nitrogen at the nitrogen-ethane interface is much higher as compared to the nitrogen-methane interface whereas the number density of nitrogen reaches approximately the number density of liquid ethane. Many other studies of liquid-gas interfaces have also found a strong adsorption of gases at the gas-liquid interface Masterton et al. (1963); Minkara et al. (2018).
The partition coefficient, , of two phases is defined as the ratio of the number density of the phases. Here we can define a -dependent partition coefficient,
| (6) |
where is the density profile along the -direction and is the density of the nitrogen in the vapor phase. Consequently, one can define excess free energy, , over the free energy of the vapor-phase as
| (7) |
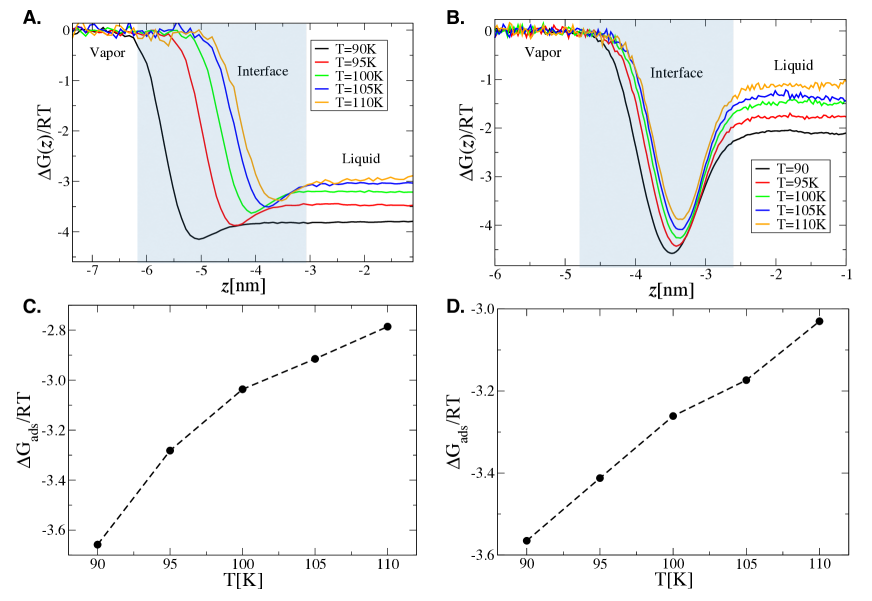
where is the universal gas constant and is the temperature. In Figs. 6(A)(B), we show for different temperature for nitrogen-methane and nitrogen-ethane systems We find that decreases upon entering the adsorbate region and increases slightly and levels off in the liquid region, suggesting the free change in adsorbate region is larger compared to that in the liquid-region and hence adsorption at the interface. Moreover, we find that the value of decreases upon decreasing temperature and hence stronger adsorption at lower temperatures. To find the free energy associated with the exchange with the adsorbate region, , one must define the effective density, , of the adsorbate region. We define the adsorbate region as the region between the vapor and liquid phases in which the derivative of nitrogen-density is non-zero. This definition of characterizing interface, gas, and liquid regions are adopted from Ref. Buldyrev et al. (2007) . is defined as
| (8) |
In Figs. 6(C)(D), we show as a function of temperature for nitrogen-methane and nitrogen-ethane systems, respectively. We find that values for both nitrogen-methane and nitrogen-ethane are similar and decrease upon decreasing temperature, and consequently increasing propensity of adsorption of nitrogen at the interface. Note that the value of is smaller than the free energy difference between the gas and the liquid phase. We have summarized the values of at different temperatures for both systems in Table II.
| T (K) | ||
|---|---|---|
| Nitrogen-Methane | Nitrogen-Ethane | |
| 90 | -3.59 | -3.56 |
| 95 | -3.21 | –3.41 |
| 100 | -3.00 | -3.26 |
| 105 | -2.90 | -3.17 |
| 110 | -2.77 | -3.02 |
Orientational ordering of the ethane and nitrogen at the interface
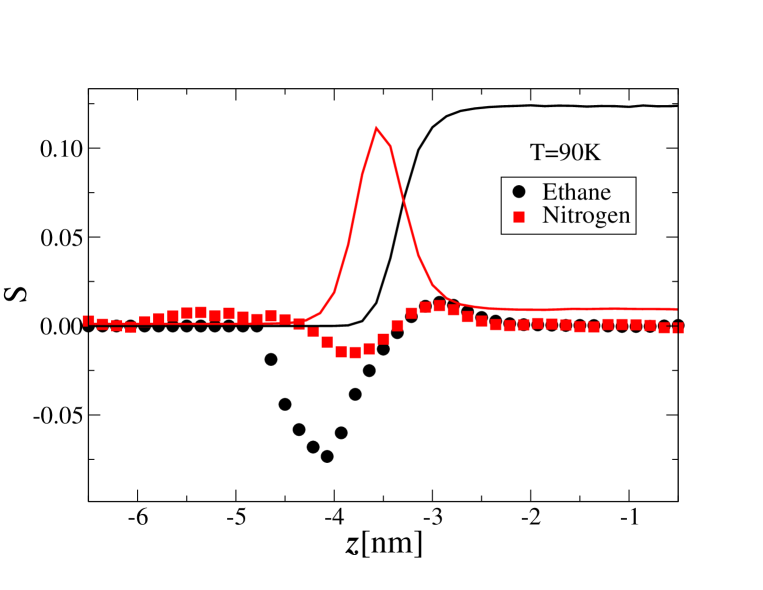
We next investigate if the nitrogens and ethanes lying in adsorbate region exhibit any preferential orientational ordering. Recent studied of hexane-water system suggest that hexane tend to exhibit a preferred orientation in the adsorbate region Minkara et al. (2018). To measure the degree of orientational ordering of of nitrogen and ethane at the interface, we use an orientational order parameter, S, as Minkara et al. (2018)
| (9) |
where is the angle formed by the nitrogen-nitrogen bond (nitrogen molecule) or carbon-carbon bond (ethane molecule) with the normal to the interface. This order parameter is closely related to the NMR order parameter Woessner (1962); LeMaster (1999); Brueschweiler and Wright (1994). If the molecules are oriented parallel to the interface then the value of reaches its maximum value , and if they are oriented perpendicular to the interface, the value of reaches its minimum value . The value of is zero if they are oriented randomly or are oriented at the magic angle, . In Fig. 7, we show the value of as a function of for nitrogen-ethane system at K. We find that for nitrogen is zero both in the liquid and the vapor-phase suggesting random orientation of nitrogen in these phases. However, nitrogens are weakly aligned along the normal to the interface close to the gas-phase whereas has weak negative minimum and weakly aligned along interface in the region close to the liquid-phase. The value of for the ethane shows a similar behavior but with larger preference of alignment normal to the surface in the region close to the gas-phase. The value of for ethane in the liquid-phase is zero suggesting a random orientation of the molecules.
Summary and Discussion
We have studied the temperature dependence of the solubility of nitrogen in methane, ethane, and mixtures of methane and ethane by performing extensive vapor-liquid equilibrium simulations of binary and ternary mixtures of nitrogen, methane and ethane for a range of temperatures between K and K at a pressure of atm, thermodynamic conditions that may exist on the Saturn’s giant moon, Titan. We find that the solubility of nitrogen in both methane and ethane decreases with increasing temperature. Moreover, solubility of nitrogen in methane is much larger compared to that in ethane at lower temperatures. Furthermore, we also investigated the solubility of nitrogen in a ternary mixture of methane, ethane, and nitrogen and we find that the solubility increases upon increasing mole-fraction of methane in the liquid phase. Our results are in quantitative agreement with the recent experimental measurements of the solubility of nitrogen in methane, ethane, and a mixture of methane and ethane. We have also calculated the surface tension for both binary and ternary systems and find the surface tensions measured in our simulations are in agreement with the existing data on the surface tensions of nitrogen-methane and as well nitrogen-ethane systems. We find a strong temperature-dependent surface adsorption of nitrogen at the nitrogen-hydrocarbon interface, previously unknown. The interfacial layer of adsorbed nitrogen and and the interfacial ethane show a preferential orientational ordering at the interface. Such adsorption of nitrogen might affect other processes like dissolution of atmospheric compounds in Titan lakes.
Author Contributions
PK designed, performed the research, and analyzed the data. PK and VFC wrote and revised the manuscript.
Acknowledgment
Authors would like to thank University of Arkansas High Performance Computing Center for providing computational time. V. F. Chevrier acknowledges funding from NASA Cassini Data Analysis Program grant no. NNX15AL48G.
References
- Lunine and Atreya [2008] Jonathan I Lunine and Sushil K Atreya. The methane cycle on titan. nature geoscience, 1(3):159 2008.
- Lorenz and Mitton [2010] Ralph Lorenz and Jacqueline Titan unveiled: Saturn’s mysterious moon explored. Princeton University Press, 2010.
- Hayes et al. [2018] Alexander G. Hayes, Ralph D. Lorenz, and Jonathan I. Lunine. A post-cassini view of titan’s methane-based hydrologic cycle. Nature Geoscience, 11(5):306–313, 2018. doi: 10.1038/s41561-018-0103-y. URL https://doi.org/10.1038/s41561-018-0103-y.
- Flasar [1983] FM Flasar. Oceans on titan? Science, 221(4605):55–57 1983.
- Toon et al. [1988] Owen B Toon, Christopher P McKay, Régis Courtin, and Thomas P Ackerman. Methane rain on titan. Icarus, 75(2):255–284 1988.
- Lunine et al. [1983] Jonathan I Lunine, David J Stevenson, and Yuk L Yung. Ethane ocean on titan. Science, 222(4629):1229–1230 0036–8075, 1983.
- Brown et al. [2008] Robert H Brown, LA Soderblom, JM Soderblom, RN Clark, R Jaumann, JW Barnes, Christophe Sotin, B Buratti, KH Baines, and PD Nicholson. The identification of liquid ethane in titan’s ontario lacus. Nature, 454(7204):607
- Cordier et al. [2009] Daniel Cordier, Olivier Mousis, Jonathan I. Lunine, Panayotis Lavvas, and Véronique Vuitton. AN ESTIMATE OF THE CHEMICAL COMPOSITION OF TITAN’s LAKES. The Astrophysical Journal, 707(2):L128–L131, dec 2009. doi: 10.1088/0004-637x/707/2/l128. URL https://doi.org/10.1088%2F0004-637x%2F707%2F2%2Fl128.
- Hofgartner et al. [2014] J. D. Hofgartner, A. G. Hayes, J. I. Lunine, H. Zebker, B. W. Stiles, C. Sotin, J. W. Barnes, E. P. Turtle, K. H. Baines, R. H. Brown, B. J. Buratti, R. N. Clark, P. Encrenaz, R. D. Kirk, A. Le Gall, R. M. Lopes, R. D. Lorenz, M. J. Malaska, K. L. Mitchell, P. D. Nicholson, P. Paillou, J. Radebaugh, S. D. Wall, and C. Wood. Transient features in a titan sea. Nature Geoscience, 7:493 EP –, 06 2014. URL https://doi.org/10.1038/ngeo2190.
- Hofgartner et al. [2016] Jason D. Hofgartner, Alexander G. Hayes, Jonathan I. Lunine, Howard Zebker, Ralph D. Lorenz, Michael J. Malaska, Marco Mastrogiuseppe, Claudia Notarnicola, and Jason M. Soderblom. Titan’s “magic islands”: Transient features in a hydrocarbon sea. Icarus, 271:338 – 349, 2016. ISSN 0019-1035. doi: https://doi.org/10.1016/j.icarus.2016.02.022. URL http://www.sciencedirect.com/science/article/pii/S0019103516000890.
- Cordier et al. [2017] Daniel Cordier, Fernando García-Sánchez, Daimler N. Justo-García, and Gérard Liger-Belair. Bubble streams in titan’s seas as a product of liquid n2 + ch4 + c2h6 cryogenic mixture. Nature Astronomy, 1:0102 EP –, 04 2017. URL https://doi.org/10.1038/s41550-017-0102.
- Llave et al. [1985] Feliciano M Llave, Kraemer D Luks, and James P Kohn. Three-phase liquid-liquid-vapor equilibria in the binary systems nitrogen+ ethane and nitrogen+ propane. Journal of Chemical and Engineering Data, 30(4):435–438
- Llave et al. [1987] Feliciano M Llave, Kraemer D Luks, and James P Kohn. Three-phase liquid-liquid-vapor equilibria in the nitrogen-methane-ethane and nitrogen-methane-propane systems. Journal of Chemical and Engineering Data, 32(1):14–17
- Malaska et al. [2017] Michael J. Malaska, Robert Hodyss, Jonathan I. Lunine, Alex G. Hayes, Jason D. Hofgartner, Gigja Hollyday, and Ralph D. Lorenz. Laboratory measurements of nitrogen dissolution in titan lake fluids. Icarus, 289:94 – 105, 2017. ISSN 0019-1035. doi: https://doi.org/10.1016/j.icarus.2017.01.033. URL http://www.sciencedirect.com/science/article/pii/S001910351630375X.
- Chevrier and Farnsworth [2018] Vincent F Chevrier and K Farnsworth. Experimental study of nitrogen dissolution in methane-ethane mixtures under titan surface conditions. In Lunar and Planetary Science Conference, 2018.
- Widom [1966] B Widom. Random sequential addition of hard spheres to a volume. The Journal of Chemical Physics, 44(10):3888–3894, 1966.
- Buldyrev et al. [2007] Sergey V Buldyrev, Pradeep Kumar, Pablo G Debenedetti, Peter J Rossky, and H Eugene Stanley. Water-like solvation thermodynamics in a spherically symmetric solvent model with two characteristic lengths. Proceedings of the National Academy of Sciences, 104(51):20177–20182, 2007.
- Minkara et al. [2018] Mona S. Minkara, Tyler Josephson, Connor L. Venteicher, Jingyi L. Chen, Daniel J. Stein, Cor J. Peters, and J. Ilja Siepmann. Monte carlo simulations probing the liquid/vapour interface of water/hexane mixtures: adsorption thermodynamics, hydrophobic effect, and structural analysis. Molecular Physics, 116(21-22):3283–3291, 11 2018. doi: 10.1080/00268976.2018.1471233. URL https://doi.org/10.1080/00268976.2018.1471233.
- Panagiotopoulos [2002] Athanassios Z Panagiotopoulos. Direct determination of phase coexistence properties of fluids by monte carlo simulation in a new ensemble. Molecular Physics, 100(1):237–246, 2002.
- Panagiotopoulos [1987] Athanassios Z Panagiotopoulos. Direct determination of phase coexistence properties of fluids by monte carlo simulation in a new ensemble. Molecular Physics, 61(4):813–826, 1987.
- Potoff and Siepmann [2001] Jeffrey J Potoff and J Ilja Siepmann. Vapor–liquid equilibria of mixtures containing alkanes, carbon dioxide, and nitrogen. AIChE journal, 47(7):1676–1682, 2001.
- Morrow and Harrison [2019] Brian H Morrow and Judith A Harrison. Vapor–liquid equilibrium simulations of hydrocarbons using molecular dynamics with long-range lennard-jones interactions. Energy & fuels, 33(2):848–858, 2019.
- Berendsen et al. [1995] H.J.C. Berendsen, D. van der Spoel, and R. van Drunen. Gromacs: A message-passing parallel molecular dynamics implementation. Computer Physics Communications, 91(1):43 – 56, 1995. ISSN 0010-4655. doi: https://doi.org/10.1016/0010-4655(95)00042-E. URL http://www.sciencedirect.com/science/article/pii/001046559500042E.
- Lindahl et al. [2001] Erik Lindahl, Berk Hess, and David van der Spoel. Gromacs 3.0: a package for molecular simulation and trajectory analysis. Molecular modeling annual, 7(8):306–317, 2001. doi: 10.1007/s008940100045. URL https://doi.org/10.1007/s008940100045.
- Van Der Spoel et al. [2005] David Van Der Spoel, Erik Lindahl, Berk Hess, Gerrit Groenhof, Alan E Mark, and Herman JC Berendsen. Gromacs: fast, flexible, and free. Journal of computational chemistry, 26(16):1701–1718
- Keasler et al. [2012] Samuel J Keasler, Sophia M Charan, Collin D Wick, Ioannis G Economou, and J Ilja Siepmann. Transferable potentials for phase equilibria–united atom description of five-and six-membered cyclic alkanes and ethers. The Journal of Physical Chemistry B, 116(36):11234–11246, 2012.
- Wick et al. [2005] Collin D Wick, John M Stubbs, Neeraj Rai, and J Ilja Siepmann. Transferable potentials for phase equilibria. 7. primary, secondary, and tertiary amines, nitroalkanes and nitrobenzene, nitriles, amides, pyridine, and pyrimidine. The Journal of Physical Chemistry B, 109(40):18974–18982, 2005.
- Wick et al. [2000] Collin D Wick, Marcus G Martin, and J Ilja Siepmann. Transferable potentials for phase equilibria. 4. united-atom description of linear and branched alkenes and alkylbenzenes. The Journal of Physical Chemistry B, 104(33):8008–8016, 2000.
- Martin and Siepmann [1999] Marcus G Martin and J Ilja Siepmann. Novel configurational-bias monte carlo method for branched molecules. transferable potentials for phase equilibria. 2. united-atom description of branched alkanes. The Journal of Physical Chemistry B, 103(21):4508–4517, 1999.
- Shah et al. [2017] Mansi S Shah, J Ilja Siepmann, and Michael Tsapatsis. Transferable potentials for phase equilibria. improved united-atom description of ethane and ethylene. AIChE Journal, 63(11):5098–5110, 2017.
- Frenkel and Smit [2001] Daan Frenkel and Berend Smit. Understanding molecular simulation: from algorithms to applications, volume 1. Elsevier, 2001.
- Farnsworth et al. [2017] Kendra Farnsworth, Zachary McMahon, Dustin Laxton, Sandeep Singh, Adrienn Luspay-Kuti, Jason M Soderblom, and Vincent Chevrier. An experimental investigation of liquid hydrocarbons on the surface of titan: Nitrogen dissolution and the presence of nitrogen bubbles. In AGU Fall Meeting Abstracts, 2017.
- Baidakov et al. [2011] VG Baidakov, MN Khotienkova, VN Andbaeva, and AM Kaverin. Capillary constant and surface tension of methane–nitrogen solutions: 1. experiment. Fluid Phase Equilibria, 301(1):67–72, 2011.
- Baidakov et al. [2012] Vladimir G Baidakov, Aleksey M Kaverin, Maria N Khotienkova, and Valentina N Andbaeva. Surface tension of an ethane–nitrogen solution. 1: Experiment and thermodynamic analysis of the results. Fluid Phase Equilibria, 328:13–20, 2012.
- Baidakov and Khotienkova [2016] VG Baidakov and MN Khotienkova. Surface tension of methane–nitrogen solutions: 2. description in the framework of the van der waals gradient theory. Fluid Phase Equilibria, 425:402–410, 2016.
- Blagoi [1960] Yu P Blagoi. Surface tensions of mixtures of n 2–ar, n 2–ch 4, and ar–ch 4. Ukr. Fiz. Zh, 5:109–114, 1960.
- Masterton et al. [1963] WL Masterton, J Bianchi, and EJ Slowinski Jr. Surface tension and adsorption in gas—liquid systems at moderate pressures1. The Journal of Physical Chemistry, 67(3):615–618, 1963.
- Woessner [1962] DE Woessner. Nuclear spin relaxation in ellipsoids undergoing rotational brownian motion. The Journal of Chemical Physics, 37(3):647–654, 1962.
- LeMaster [1999] David M LeMaster. Nmr relaxation order parameter analysis of the dynamics of protein side chains. Journal of the American Chemical Society, 121(8):1726–1742, 1999.
- Brueschweiler and Wright [1994] Rafael Brueschweiler and Peter E Wright. Nmr order parameters of biomolecules: a new analytical representation and application to the gaussian axial fluctuation model. Journal of the American Chemical Society, 116(18):8426–8427, 1994.