An Ensemble Approach toward Automated Variable Selection
for Network Anomaly Detection
Abstract
While variable selection is essential to optimize the learning complexity by prioritizing features, automating the selection process is preferred since it requires laborious efforts with intensive analysis otherwise. However, it is not an easy task to enable the automation due to several reasons. First, selection techniques often need a condition to terminate the reduction process, for example, by using a threshold or the number of features to stop, and searching an adequate stopping condition is highly challenging. Second, it is uncertain that the reduced variable set would work well; our preliminary experimental result shows that well-known selection techniques produce different sets of variables as a result of reduction (even with the same termination condition), and it is hard to estimate which of them would work the best in future testing. In this paper, we demonstrate the potential power of our approach to the automation of selection process that incorporates well-known selection methods identifying important variables. Our experimental results with two public network traffic data (UNSW-NB15 and IDS2017) show that our proposed method identifies a small number of core variables, with which it is possible to approximate the performance to the one with the entire variables.
1 Introduction
Rapid advance in the machine learning industry has led to the active adoption of the learning techniques for a diverse range of applications. The network security area is not an exception and machine learning is widely employed to analyze network traffic. For example, clustering has been utilized to understand temporal variation patterns, to detect network anomalies, and to infer the class of individual connections for the purpose of labeling. Various classification techniques such as Random Forest (RF), Support Vector Machine (SVM), and deep neural networks (DNNs) have also been employed mainly for detecting intrusive and/or anomalous events by analyzing network traffic [1, 2].
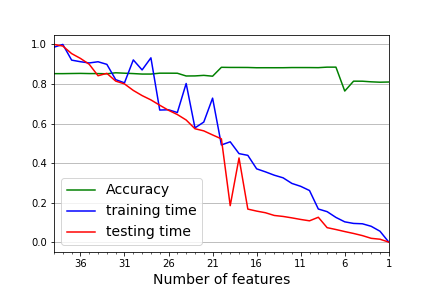
A large body of the previous studies simply utilized the entire variables111We interchangeably use variables and features throughout the paper. provisioned in the data files. However, it is not always true that relying on all the variables leads to the best performance (e.g. detection rate); that is, reducing a degree of redundancy may result in even better result. In addition, an invariant is that relying on a greater number of variables should impose an increasing complexity, thus requiring a greater amount of time and resources for analyzing. Fig. 1 shows an example of the detection accuracy and the (normalized) time taken for training and testing over the number of features with the Logistic Regression classifier against UNSW-NB15222We utilize the popular UNSW-NB15 dataset since it has been collected in 2015. The description of the dataset employed in this paper will be provided in Section 4. From the figure, training and testing times decrease almost linearly with a smaller number of features. Interestingly, accuracy goes down eventually with smaller number of features (), but it does not show the best performance with the entire 39 features (numeric only); rather, we can see better performance with 7–20 features.
Variable selection is a technique identifying relatively more important features by eliminating less essential variables. Alternatively, dimensionality reduction tools such as Principal Component Analysis (PCA) and t-Distributed Stochastic Neighbor Embedding (t-SNE) project the given variables into a lower dimensional space, but the main difference is that they do not preserve the definitions of the individual features while variable selection does. Variable selection has been an active research topic for improving learning performance over a decade [3, 4]. While variable selection is essential to optimize the learning complexity by identifying superior features, automating the selection process is desired since it requires laborious efforts with intensive analysis otherwise. However, it is not an easy task to enable the automation due to several reasons, as follows.
One of the challenges is that variable selection techniques often need to define a “good” termination condition to stop the elimination of features in its iterative process. Many feature selection methods rely on a threshold or the final number of features to reduce. For instance, Sequential Feature Selection (SFS) eliminates less important features one by one at each iteration until it meets the final number of features specified. A critical problem here is how to determine the final number of features or the value for the threshold to stop. Since the variable selection is performed in the training phase with some learning samples, which should be disjoint to the actual data used in the testing phase, the resources to help determine appropriate stopping conditions should be limited to the information that can be available in the training time.
Another important challenge would be how to discover an optimal subset of features that approximates to the performance obtained with the entire features. One of our initial observations is that individual selection techniques employed in our experiments result in different feature sets, even with the same termination condition. Another interesting observation is that the actual testing performance shows a degree of fluctuations over the iterative reduction process even with a single selection method, making it further difficult to estimate the termination point. Moreover, the performance in the training phase does not guarantee the performance in the testing time for individual selection methods; for example, a selection method shows an outstanding performance but could reveal a relatively poor performance compared to other methods in the testing time. In addition, there is no sole winner that outperforms other selection methods at all occasions, and it is impossible to predict such a winner in the training time even if there exists.
Our approach to the automation of selection process is to incorporate well-known selection methods to make a safer identification of important variables. In this paper, we present an ensemble method that employs multiple selection techniques to see the potential power of the incorporation of identified features by individual selection techniques, while we leave the determination of stopping condition as the next step towards the automation of selection process. As mentioned, individual selection techniques produce slightly different sets at each iteration. To combine the results by individual selection schemes, we establish three heuristic methods defined based on set theory: Union, Intersection, and Quorum that will be described in Section 3. With a heuristic function, a candidate feature set is identified at each iteration. We compare the heuristic methods by demonstrating the anomaly detection performance when using the candidate feature set in the testing phase, with two public network traffic datasets (UNSW-NB15 [5] and IDS2017 [6]). Our experimental results show that Intersection and Quorum work better than Union and produce competitive subsets of features yielding the approximate performance to the one with the entire features.
This paper is organized as follows. Section 2 provides a short summary of the well-known techniques for variable selection and the related studies. In section 3, we introduce our proposed method based on the ensemble approach, and the experimental results with the two public traffic datasets are demonstrated in Section 4. We finally conclude our presentation in Section 5 with a summary and future directions.
2 Background
This section offers the description of the feature selection classes and methods commonly applied in many application domains, and provides a summary of the closely related studies to our work.
2.1 Feature selection classes
Feature selection is often used for improving accuracy and reducing computation time. There are three categories for classifying feature selection methods: filter method, wrapper method, and embedded method.
The filter method selects features based on intrinsic properties of data[7]. Using this method, the number of features can be reduced based on distance, consistency, similarity, and statistical measures [8]. There are two types in this class of methods: the univariate method handles each feature independently, while the multivariate method examines whole groups of features together. The filter method is generally faster than the other classes of methods since it does not require a machine learning algorithm internally. However, it has a tendency to choose a higher number of features; thus, it is usually used for pre-processing [7].
The wrapper method utilizes a machine learning classifier to measure the performance contribution provided by each feature. Machine learning is also used to estimate each subset of features [8]. Although the wrapper method is computationally expensive, it generally finds out a subset of features better than the one by other methods. However, the selected features could be biased depending on the classifier used, and a different learning method can be used for validating to reduce the risk of any potential bias.
The embedded method also relies on a machine learning classifier. The embedded method uses a built-in classification algorithm for the feature search process; hence, the learning process and feature selection process are tightly coupled and not able to work individually. This method is similar to the wrapper method, but it is generally faster since it does not examine all the possible combinations of features. Common methods in this class include decision tree, LASSO, and LARS [9].
2.2 Feature selection methods
Under the three classes of feature selection methods, there exists several specific methods widely used, and we considered the following methods in this study.
Correlation-Based Feature Selection (CFS) is a filter method which gives features ranking based on the heuristic evaluation. CFS seeks highly correlated and un-correlated features to discard redundant data. Irrelevant features are disregarded since those features have low correlation. Features highly correlated to one or more remaining features are considered as redundant features, and those features are screened out in this selection scheme [7].
Sequential Backward Selection (SBS) is a wrapper method. SBS uses a sequential selection algorithm which is one of the greedy search algorithms, to reduce the number of features. SBS discards a feature one by one until it meets the number of features that a user provides as input. At first, a criterion function should be defined to tell which feature is discarded Then the criterion function calculates the performance of after and before the elimination of each feature, and the feature showing the least performance is discarded [10].
Recursive Feature Eliminations (RFE) is also a wrapper method which relies on a machine learning classifier to discover the features least important. RFE has been widely used for the cancer classification where the number of features is quite big (more than a thousand) and the training is done with less than 100 samples [11]. At each iteration, RFE drops one feature and re-rank remaining features, to remove redundant and weak data through the process.
The technique of Gini Feature Importance is one the embedded methods. This scheme relies on a measure known as “Importance value”, and a feature with a too small Importance value less than the specified threshold is removed from the feature set. The importance value is created when the internal random forest classifier is being constructed. In detail, when a classification tree is built up, the variable inducing the highest reduction of the Gini index will be selected at each node. Gini index is calculated through [12], where is a fraction of associating pairs assign to node and is a fraction of non-associating pairs.
Univariate feature selection belongs to the class of filter method, and reduces the dimensionality of features relatively quickly, which makes this scheme to be one of the traditional selection methods. This technique evaluates each feature based on statistical tests and remove the variables having weak relationship with the output feature. There are several options to utilize this method such as Pearson Correlation, mutual information and maximal information coefficient (MIC), and distance correlation. We use this scheme with the Chi-square test which calculates correlation or association of features based on the frequency distribution.
2.3 Related work
There are a body of studies investigated variable selection, and we introduce some of the previous studies closely related to our work.
The authors in [13] proposed a selection method based on CFS and SBS to find a reduced feature set. However, the focus of this work is the parallelization of the selection scheme to minimize the time to build up a training model. Hence, this work does not give an answer to when to stop to obtain a feature set that can actually be considered for training and testing, which is the research question we tackle to answer.
Khammassi et al. [14] introduced a wrapper approach which incorporates GA (Genetic Algorithm) feature search and LR (Logistic regression) for feature selection. This approach consists of three steps: pre-processing, feature selection, and classification [14]. The authors evaluated their proposed scheme with the UNSW-NB15 dataset, and reported the GA-LR method yields 81.4% of classification accuracy with 20 features. As will be presented, our techniques outperforms showing over 86% of accuracy only with 4 features selected.
In the work of [15], the authors provides an analysis of network traffic features for anomaly detection. The proposed selection method in this paper relies on feature weighting and ranking, such as WMR, SAM, and LASSO, to obtain a set of features with strong contribution. The selected features are then applied to a refinement process based on a brute force search analysis to decrease the number of features furthermore, by labeling relevant, medium relevant, and negligible.
Another recent work [16] proposed a detection system combining Maximal Information Coefficient (MIC) feature selection and feature-based MSPCA. MIC feature selection can remove uncorrelated features by detecting feature dependency between features and labels as a criteria and a feature selection algorithm called Mic-Based Feature Selection Algorithm. A potential weakness of this method is the possibility to receive effects of outlier values, which might cause to discard an important feature.
3 Proposed Method

In this work, we utilize a set of selection techniques to identify a set of features that could be more important than the others with respect to the classification performance in the testing phase. Fig. 2 shows our proposed model composed of two independent rounds with multiple selection tools. The first-round stage eliminates highly redundant features based on the pair-wise correlation factors. The second-round stage employs a set of reduction methods, each of which reduces the number of features based on an iterative process until it gets to a single feature. As shown in the figure, the first-round selection reduces the number of features from to where . In the second-round process, multiple selection methods (from 1 to in the figure) eliminate one feature at each iteration independently; hence, iterations are required to complete.
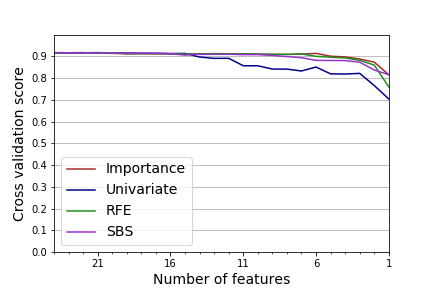
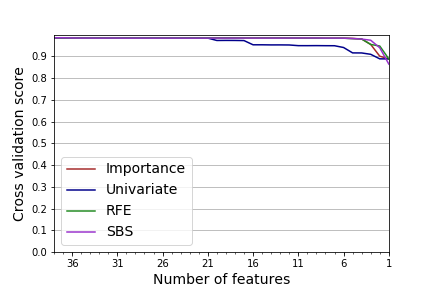
Fig. 3 shows an example with the training data file provided in the UNSW-NB15 dataset containing 39 numeric features. The first-round process reduces from to . By default, we employ four selection methods for the second-round process: RFE, SBS, Univariate, and Importance. The reason why we chose these four methods is that these are common feature selection methods and we would like to examine different classes of selection methods (i.e., filter, wrapper, and embedded) without a bias. The figure shows the cross-validation results for each of iterations for the selection methods. From the figure, we can see that the score is significantly dropped with the Univariate method at around 11 features, while the other methods show a sharp degradation at three features. Since the variation selection is completed in the training phase, we may want to stop somewhere between round 11 (conservatively) and 3 (optimistically).
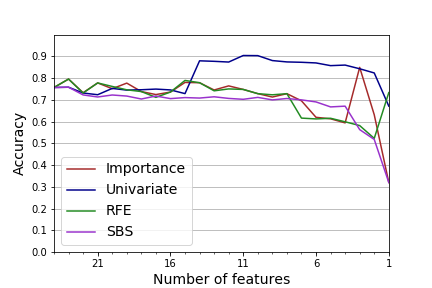
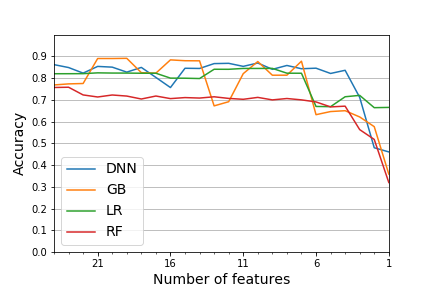
To see the quality of the selected features, we analyze the anomaly detection performance by using the testing data in UNSW-NB15. Fig. 4(a) shows the actual testing result for the selection methods. We used the same classifier (RF) employed in Fig. 3. Unlike the cross-validation result, the testing accuracy shows a degree of fluctuation over the number of features. Also surprisingly, Univariate shows a better result than the others, which is somewhat different from what we observed from the cross-validation result. Fig. 4(b) shows the testing result when using different classifiers of Logistic Regression (LR), Gradient Boosting (GB), Random Forest (RF) and Deep Neural Network (DNN), across the selected features by SBS. In Fig. 4(a), SBS did not show an impressive performance, but we can see that it may work well if we chose some other classifiers (e.g., DNN and GB), as shown in Fig. 4(b).
An important observation here is that simply relying on the cross-validation result would be risky to determine which would work better and which does poorly. In addition, a reduction method may work better with a certain classifier, and vice versa. From these observations, we claim that simply choosing a single reduction technique may be risky. Like SBS in Fig. 4(b), other selection tools produce their own sets of features at each iteration. Our proposed model incorporates the different selection methods to minimize the risk. One question here would then be how to incorporate the individual results by different selection functions. For this purpose, we define three heuristic methods based on set theory, as follows:
-
•
Union, which takes all the features that any of the selection methods suggests;
-
•
Intersection, which takes the features that everyone in the selection methods agrees upon;
-
•
Quorum, which selectively takes the features agreed by the majority of the selection methods.

Fig. 5 demonstrates the entire process of our feature selection method. There typically exist two types of features: a numerical feature contains a numeric value (e.g., the number of bytes sent), while a categorical feature is discrete and an example of categorical features is protocol := {TCP, UDP}. A categorical feature is generally not supported by feature selection methods, and we employ one-hot encoding to convert it to numeric features with a binary value, where is the size of the feature space. In the figure, the dataset consists of total features ( numeric features and categorical features). The numeric features are fed into the ensemble engine in Fig. 2. The one-hot encoded features are then (optionally) added up to the final candidate features resulted by a heuristic method.
4 Experiments
In this section, we report our experimental results conducted with the UNSW-NB15 and IDS2017 datasets. Note that the samples in the datasets are pre-processed including the normalization before being used. For the classifiers, we basically configured them with the default setting and here are some specifics: 100 trees for RF, 200 trees for GB, and a library for Large Linear Classification solver for LR. For DNN, we used 4 hidden layers which contains 50 hidden units with a rectified linear unit (ReLU) activation function and the dropout of 0.2 in each layer. The output layer contains 1 unit with Sigmoid activation function. We used an Adam optimizer, and the batch size is 100 with 15 epochs.
4.1 Evaluation metrics
We basically examine the classification performance by utilizing multiple classifiers, including LR, GB, RF, and DNN. For reporting performance, we utilize F1-score that is a harmonic mean of Precision and Recall, defined by the elements in the confusion matrix: TP (True Positive), FP (False Positive), FN (False Negative) and TN (True Negative). Since the metric of Accuracy may lead to a biased result if the population of the minority class is too small, F1-score is widely accepted to minimize the concern; for this reason, we use the measure of F1-score to measure the performance of classifiers. The metrics of Accuracy and F1-score are defined:
4.2 Experimental result for UNSW-NB15
We employ the raw UNSW-NB15 dataset collected in a simulated environment in January 22, 2015 and February 17, 2015. The dataset provides separate files for training and testing data. The training file contains roughly 82K data points and 55% of them are anomalies. The testing file includes 175K samples and 68% of the data points are anomalies. The anomalies are mainly by cyber-attacks, and nine classes of attacks were injected to collect. There are 42 features available excluding the serial number and label information, and 39 of them are numeric.
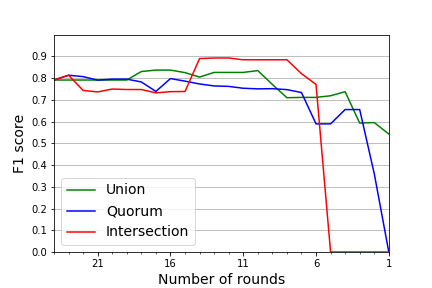
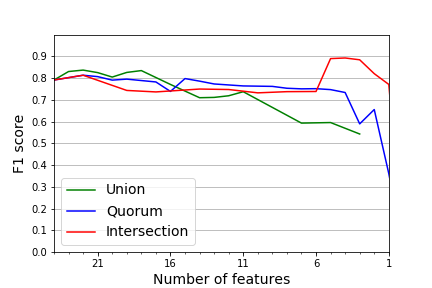
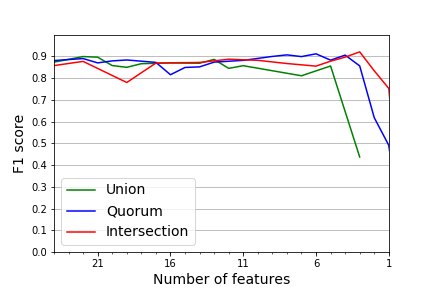
As a result of our ensemble method, we obtain the cross validation score as shown in Fig. 3. Recall that cross validation takes place only with the training file, while the measured F1-score in this section is for actual testing with an independent testing file. Fig. 6 shows how the proposed heuristic methods execute across the iterations (Fig. 6(a)) and the number of features (Fig. 6(b)), when using the RF classifier. At each round (iteration), our proposed methods combine the common features identified by the second-round reduction functions. Intuitively, Union produces a larger number of features while Intersection has the smallest number of features at a certain round. As shown in the figure, Intersection identifies good candidate sets approaching 90% in F1-score, at round 14–8. By referencing Fig. 6(b), we can see that the candidate size showing the best performance for Intersection is ranged from 5–3 features, which is a competitive result to the use of the full feature set (89.6% in F1-score). From the figure, Union seems to produce less competitive feature sets along the iterative process, showing lower than 70% in F1-score with 10 or smaller number of features. The method of Quorum shows the best performance for the feature set size from 15 to 6, but is worse than Intersection with less than six features.
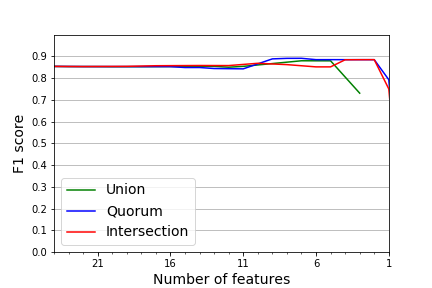
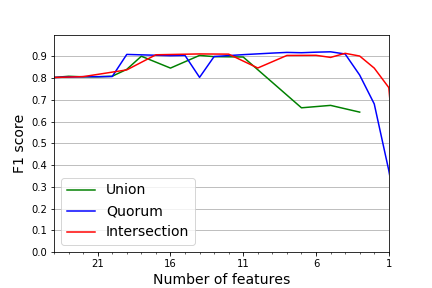
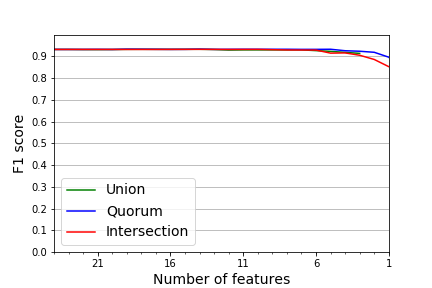
Considering different classifiers along the number of features, Fig. 7 shows the result of the heuristic methods. In 7(a), LR results in almost flat curves over the number of features, which implies that it is possible to significantly reduce the feature size for training and testing with a minor penalty in performance. The methods of Quorum and Intersection result in almost 90% in F1-score, which is higher than the performance with the entire numeric features (85.2%). Fig. 7(b) shows Quorum and Intersection are able to discover competitive feature sets, approaching to the performance with the entire features (90.9%) when using the GB classifier. The deep learning classifier (DNN) in Fig. 7(c) makes the similar conclusion, and Quorum and Intersection produce the approximated performance to the full feature set (90.0%) with only 3–4 features.
In the discussion of Fig. 5, we mentioned that the categorical features could be added to the incorporation process by heuristics. Fig. 8 shows the performance of the heuristic methods with the addition of three one-hot encoded features defined in UNSW-NB15. In the figure, much consistent results are shown with the heuristics, and choosing five or more features with any heuristic allows to approximate to the performance with the full feature set.
4.3 Experimental results for IDS2017
We next share our observations from the experiments with the IDS2017 dataset. This dataset was collected over the five days from July 3, 2017 to July 7, 2017. Similar to UNSW-NB15, it was collected in a simulated network environment with the victim network and attackers network. IDS2017 includes many kinds of attacks, including FTP, SSH, DoS/DDoS, Heartbleed, Infiltration, Botnet, and Web attacks. In this dataset, daily trace records include specific attacks selectively. For this reason, we randomly sampled 100K data points from the entire records, one sampling for training and the other for testing. The total number of features in this dataset is 84, and we excluded the first five features related to the source and destination information. All 79 features used in our experiments are numeric.
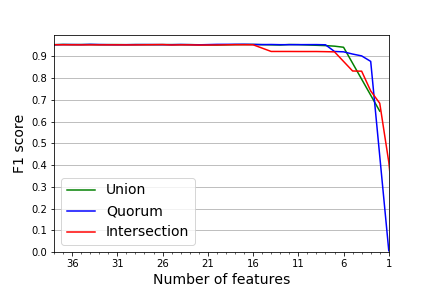
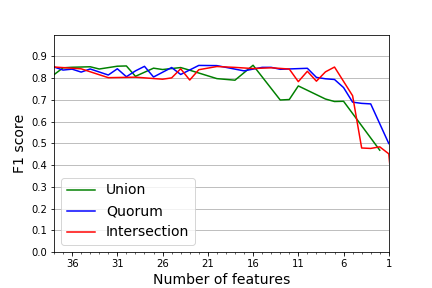
Fig. 9 shows the experimental result with the IDS2017 dataset. The cross validation result in Fig. 9(a) shows a quite high score over 90% even with a single feature. Fig. 9(b) and Fig. 9(c) show how the two classifiers of RF and DNN work across the number of features. From the result, we can see RF works better than DNN for this dataset. Overall, Quorum and Intersection result in higher quality features in the reduction. With RF, using five features is sufficient to approximate to the one with the entire features, while using 7 or more features would be desirable for DNN.
Although omitted due to the space reason, we conducted the same experiment with other pairs of training and testing files sampled with different seed numbers, and observed similar patterns to the result reported in Fig. 9.
5 Conclusion
Variable selection is beneficial by reducing the training and testing complexity, but it generally requires highly laborious efforts with intensive analysis to identify an optimal subset of features in advance. Automating the selection process is thus essential for the practical use of variable selection, but it is challenging with the existing methods since it is hard to determine the termination condition to stop searching. In addition, we observed that individual selection methods result in different feature sets as the output. In this paper, we presented an ensemble method that combines the independent results by individual selection methods through heuristic functions, in order to identify an optimal set of features. Our experimental results showed that the heuristic functions of Intersection and Quorum work consistently producing competitive subsets of features with the approximate performance to the one with the entire features for network anomaly detection. The next step of this research is to develop a method that helps determine when to stop in the iterative process in an automated fashion without human intervention.
Acknowledgment
This effort was supported in part by the U.S. Department of Energy (DOE), Office of Science, Office of Advanced Scientific Computing Research under contract number DE-AC02-05CH11231, and in part by Institute for Information & communications Technology Promotion (IITP) grant funded by the Korea government (MSIP) (No.2016-0-00078, Cloud-based Security Intelligence Technology Development for the Customized Security Service Provisioning). This research used resources of the National Energy Research Scientific Computing Center (NERSC), a DOE Office of Science User Facility.
References
- [1] Donghwoon Kwon, Hyunjoo Kim, Jinoh Kim, Sang C Suh, Ikkyun Kim, and Kuinam J Kim. A survey of deep learning-based network anomaly detection. Cluster Computing, pages 1–13, 2017.
- [2] Anna L Buczak and Erhan Guven. A survey of data mining and machine learning methods for cyber security intrusion detection. IEEE Communications Surveys & Tutorials, 18(2):1153–1176, 2015.
- [3] Jundong Li, Kewei Cheng, Suhang Wang, Fred Morstatter, Robert P Trevino, Jiliang Tang, and Huan Liu. Feature selection: A data perspective. ACM Computing Surveys (CSUR), 50(6):94, 2018.
- [4] Salem Alelyani, Jiliang Tang, and Huan Liu. Feature selection for clustering: A review. In Data Clustering, pages 29–60. Chapman and Hall/CRC, 2018.
- [5] Nour Moustafa and Jill Slay. Unsw-nb15: a comprehensive data set for network intrusion detection systems (unsw-nb15 network data set). In 2015 military communications and information systems conference (MilCIS), pages 1–6. IEEE, 2015.
- [6] Iman Sharafaldin, Arash Habibi Lashkari, and Ali A Ghorbani. Toward generating a new intrusion detection dataset and intrusion traffic characterization. In ICISSP, pages 108–116, 2018.
- [7] Noelia S´anchez-Maro˜no Amparo Alonso-Betanzos Mar´ıa Tombilla-Sanrom´an. Filter methods for feature selection – a comparative study. Springer, 10, 2007.
- [8] K. Brkić N. Bogunović A. Jović. A review of feature selection methods with applications.
- [9] Subhajit Dey Sarkar Saptarsi Goswami Aman Agarwal Javed Aktar. A novel feature selection technique for text classification using naive bayes. 10, April 2014.
- [10] Sebastian Raschuka. Python Machine Learning. Packet Publishing Ltd, 2015.
- [11] Xue wen Chen Jong Cheol Jeong. Enhanced recursive feature elimination. 7, January 2008.
- [12] Onznur Tastan Yanjun Qi Jaime G. Carbonell Judith Klein-Seetharaman. Prediction of interactions between hiv-1 and human protectins by information integration. pmc, 2009.
- [13] Jonathan Wang Wucherl Yoo Alex Sim Peter Nugent Kesheng Wu. Parallel variable selection for effective performance prediction. 10, May 2017.
- [14] Chaouki Khammassi Saoussen Krichen. A ga-lr wrapper approach for feature selection in network intrusion detection. 70, June 2017.
- [15] Félix Iglesias Tanja Zseby. Analysis of network traffic features for anomaly detection. 25, October 2015.
- [16] Zhaomin Chen Chai Kiat Yeo Bu Sung Lee Francis Chiew Tong Lau. Combining mic feature selection and feature-based mspca for network traffic anomaly detection. 6, August 2016.