Relaxation Effects in Twisted Bilayer Graphene:
a Multi-Scale Approach
Abstract
We present a multi-scale density functional theory (DFT) informed molecular dynamics and tight-binding (TB) approach to capture the interdependent atomic and electronic structures of twisted bilayer graphene. We calibrate the flat band magic angle to be at by rescaling the interlayer tunneling for different atomic structure relaxation models as a way to resolve the indeterminacy of existing atomic and electronic structure models whose predicted magic angles vary widely between . The interatomic force fields are built using input from various stacking and interlayer distance dependent DFT total energies including the exact exchange and random phase approximation (EXX+RPA). We use a Fermi velocity of m/s for graphene that is enhanced by about over the local density approximation (LDA) values. Based on this atomic and electronic structure model we obtain high-resolution spectral functions comparable with experimental angle-resolved photoemission spectra (ARPES). Our analysis of the interdependence between the atomic and electronic structures indicates that the intralayer elastic parameters compatible with the DFT-LDA, which are stiffer by 30% than widely used reactive empirical bond order force fields, can combine with EXX+RPA interlayer potentials to yield the magic angle at without further rescaling of the interlayer tunneling.
pacs:
33.15.TaI Introduction
The discovery of correlated insulating phases and superconductivity Cao et al. (2018) in twisted bilayer graphene (tBG) has boosted the field of twistronics Bistritzer and MacDonald (2011); Santos et al. (2007) where strong electron-electron interactions Yankowitz et al. (2019); Kerelsky et al. (2019); Choi et al. (2019) play a dominant role in the physics at specific magic angles where the bands become nearly flat. Experimental magic angle values are reported within varying ranges due to their sensitivity to the cleanliness of the sample affecting the Fermi velocity and the strength of electron-electron interaction effects Kerelsky et al. (2019); Choi et al. (2019). Existing electronic structure models Laissardiére et al. (2012); Morell et al. (2010); Nam and Koshino (2017); Uchida et al. (2014) have been refined Angeli et al. (2018); Guinea and Walet (2019) to understand the peculiarities of the physics at play at these specific magic angles. Theoretically, the magic angles depend on the chosen model Hamiltonian. Of particular importance are the relaxation effects in van der Waals heterostructures Woods et al. ; Jung et al. (2015) that have already been reported using a variety of methods including (i) fully atomic lattice relaxation approaches van Wijk et al. (2015); Jain et al. (2016); Nam and Koshino (2017); Lucignano et al. (2019), (ii) non-linear finite element plate models Zhang and Tadmor (2018), (iii) a generalized-stacking fault energy (GSFE) analysis Dai et al. (2016), possibly combined with (iv) a configuration-space representation Carr et al. (2018), and finally, very commonly, with (v) computationally non-prohibitive continuum models Carr et al. (2019); Guinea and Walet (2019); Walet and Guinea (2019). The common denominator in these analyses is the observation of (i) a reduction in the size of the AA stacking region, an increase of the AB/BA regions and the appearance of sharper stacking domain walls with decreasing twist angle and (ii) the tendency to lock the rotational alignment between the layers at the AA stacked regions for small twist angles. These mechanical effects contribute to the formation of secondary isolation gaps of the flat bands from higher energy bands Nam and Koshino (2017); Carr et al. (2018); Koshino et al. (2018), enhance the value of the first magic angle and broadens the bands of the magic angles below Carr et al. (2019). Quantitative conclusions inferred from electronic band structure (EBS) and spectral function plots depend on the aproximations used.
Here, we propose an approach to capture the interdependent atomic and electronic structures of twisted bilayer graphene (tBG) by calibrating the predicted magic angle to the experimental value of and resolve the indeterminacy of the models in the literature for different atomic/electronic structure model combinations Laissardiére et al. (2012); Fang and Kaxiras (2016); Kolmogorov and Crespi (2005); Gargiulo and Yazyev (2017); van Wijk et al. (2014); Wen et al. (2018a); Sabatini et al. (2013) whose predicted magic angles vary widely between . For this purpose we attempt a progressive refinement in the accuracy of our models. For the relaxed atomic structure we use interatomic force fields based on dihedral registry-dependent interlayer potentials (DRIP) Wen et al. (2018b) using parameter sets that reproduce the stacking registry and interlayer distance dependent total energies obtained within density functional theory. Among the proposed parametrizations we have the systematically improved exact exchange and random phase approximation (EXX+RPA) Leconte et al. (2017) which predicts structural reconstructions that are slightly weaker for the out-of-plane corrugation amplitudes than in commonly reported force field calculations Carr et al. (2018); Nam and Koshino (2017); Carr et al. (2019); Gargiulo and Yazyev (2017); Wen et al. (2018b); Kolmogorov and Crespi (2005). Comparison of in-plane relaxations against LDA-parametrized force fields give results that are similar to EXX-RPA-parametrized results due to similar energy differences Leconte et al. (2017) thus yielding a similarly strong driving force for unfavorable AA to favorable AB stacking rearrangement.
The electronic structure model relies on rescaled interlayer hopping terms for each atomic relaxation scheme to calibrate the flat band magic angle to be at . The interlayer hopping terms are modeled through widely used isotropic two-center (TC) distance dependent functions. We then propose an improvement of this model by replacing the intralayer terms using a strain-dependent version of the F2G2 model Jung and MacDonald (2013), by rescaling of the TC paremeters through interlayer tunneling values fitting at the Dirac point for all possible stacking configurations obtained within LDA density functional theory (DFT) calculations Jung et al. (2014), and by a relaxation-scheme dependent rescaling of the coupling strength to match the magic angle at a set value, coined as the Scaled Hybrid Exponential (SHE) model. The specific magic angle value not only depends on the atomic structure but also on the intralayer Fermi velocity of graphene for which we use a value m/s that is enhanced by 15% with respect to the local density approximation estimate m/s. We find that the interlayer tunneling does not require rescaling when local density approximation (LDA) elastic properties are used in combination with exact exchange random phase approximation (EXX-RPA) interlayer potentials. We further compare the freestanding tBG against the hexagonal boron nitride (hBN) supported electronic structure to confirm that the EBS, and therefore the magic angles values, are relatively insensitive to the substrate when the hBN has a large twist with respect to the contacting graphene layer.
The manuscript is structured as follows. In Sect. II we present details of the atomic structure calculations through molecular dynamics simulations. In Sect. III we discuss the details of the electronic bandstructure calculations using our SHE TB model while in Sect. IV we provide results using this model. In Sect. V, we focus on the spectral function methods to illustrate possible signatures for three relevant tBG systems. In Section VI we summarize our main findings.
II Atomic structure calculations
We begin by introducing our approach to obtain the relaxed atomic structure of twisted van der Waals systems. The structural relaxations rely on LAMMPS molecular dynamics (MD) simulation package Thompson et al. (2022); Plimpton (1995) for which we use pairwise interlayer interaction force fields modeled to reproduce interlayer stacking dependent DFT total energies. In the following we outline the method to obtain the commensurate supercell for different twist angles, then we explain how to parametrize the pairwise potentials that reproduce different stacking dependent interlayer interaction energies including EXX+RPA, and finally discuss the important role the choice in intralayer potential plays in correctly reproducing the elastic properties that govern the strength of the lattice reconstruction effects.
II.1 Commensuration angles
Commensurate supercells of twisted bilayer graphene can be formed for a discrete set of twist angles . We use the procedure in Ref. Hermann (2012) to relate a given twist angle between two rotated layers on top of each other using four integers , , and through the relation
| (1) |
where the scaling factor is the ratio between the lattice constants and of the bottom and top layers respectively
| (2) |
and
| (3) |
The two lattice vectors of the commensurate supercell , can be related with the lattice vectors of the bottom reference layer , and the top twisted layer , through
| (4) |
where we use the transformation matrices
| (5) |
In tBG we have scaling factor because the lattice constants of both top and bottom layers are equal. For illustration purposes we comment on the subset of commensurate superlattices that are obtained by imposing and or alternatively and that automatically satisfies the equal lattice constant condition. Note that the use of identical indices and leaves the layers unrotated without introducing any change and corresponds to a trivial case, and switching signs and rotates the layers by 60∘.
| , | # Atoms | , | # Atoms | |||
|---|---|---|---|---|---|---|
| 0.100 | 331, 330 | 1310764 | 1.696 | 20, 19 | 4564 | |
| 0.200 | 166, 165 | 328684 | 2.005 | 17, 16 | 3268 | |
| 0.300 | 111, 110 | 146524 | 2.134 | 16, 15 | 2884 | |
| 0.400 | 83, 82 | 81676 | 2.281 | 15, 14 | 2524 | |
| 0.497 | 67, 66 | 53068 | 2.450 | 14, 13 | 2188 | |
| 0.596 | 56, 55 | 36964 | 2.646 | 13, 12 | 1876 | |
| 0.797 | 42, 41 | 20668 | 2.876 | 12, 11 | 1588 | |
| 0.987 | 34, 33 | 13468 | 3.150 | 11, 10 | 1324 | |
| 1.018 | 33, 32 | 12676 | 3.481 | 10, 9 | 1084 | |
| 1.050 | 32, 31 | 11908 | 3.890 | 9, 8 | 868 | |
| 1.085 | 31, 30 | 11164 | 4.408 | 8, 7 | 676 | |
| 1.121 | 30, 29 | 10444 | 5.086 | 7, 6 | 508 | |
| 1.539 | 22, 21 | 5548 | 6.009 | 6, 5 | 364 | |
| 1.614 | 21, 20 | 5044 | 7.341 | 5, 4 | 244 | |
| 1.696 | 20, 19 | 4564 | 9.430 | 4, 3 | 148 | |
| 1.788 | 19, 18 | 4108 | 13.174 | 3, 2 | 76 | |
| 1.890 | 18, 17 | 3676 | 21.787 | 2, 1 | 28 |
The areas of the commensurate supercell and the moire cell are related by an integer multiple through
| (6) |
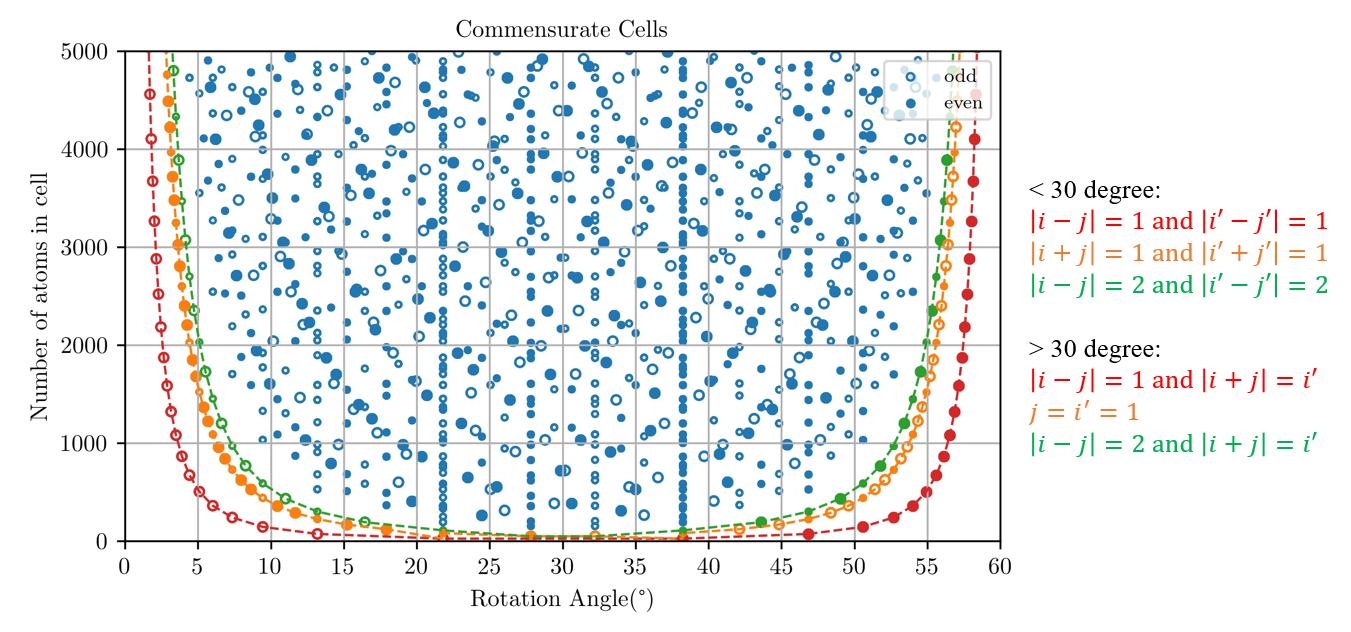
where takes a simple form when and . The smallest supercells corresponding to area multiples of between the supercell and the moire cell are represented as red, orange, and green in Fig. 1. These three area ratios can be obtained using the nontrivial condition when
| (7) | |||||
| (8) | |||||
| (9) |
Minimum area commensurate cells for imply that the commensurate supercell period is the same as the moire period, whose small angle approximation is given by . Because the supercell size grows as the layers are brought to closer alignment these minimum area supercells will normally be our preferred twist angle choices for our band structure calculations. Using the current scheme, we can obtain all the smallest commensurate supercells from Ref. Shallcross et al. (2010), as well as additional larger supercells with the same angles. The expanded set of points can be useful for instance when we want to find doubly commensurate real space moire supercells Leconte and Jung (2020). In Fig. 1 We have illustrated with filled and empty symbols the even and odd parity points Rode et al. (2017) whose bands are different for large twist angles Mele (2010). For the typical flat band angles near 1∘ this even/odd signature-differences are negligibly small in the limit where the continuum approximation becomes accurate because both even and odd structures become increasingly similar to each other, having similar distribution of AA, AB and BA stacking regions. As a rule of thumb we have even parities when or and and we obtain odd parities for the remaining cases. We note that the parity of the superlattice is reversed for twist angles that are equidistant around since (i) the sixfold symmetry of the triangular sublattice leads to mirror-symmetry around and since (ii) the -rotation defining the new zero-angle reference inverts the role of even and odd configurations where odd configurations possess coincident lattice positions only for the corner A-A′ sublattices while the even configurations also possesses an additional coincident site for the B-B′ sublattice combination.
| DRIP | |||||||||||
| EXX-RPA | CC | 8.568E03 | 1.781E03 | 3.277E08 | 4.616E02 | 0.465 | 1.259 | 4.049E02 | 3.305 | 1.552E02 | 1.026 |
| CB | 2.650E02 | 5.326E02 | 7.749E02 | 4.037E08 | 0.881 | 3.055 | 1.544E08 | 3.133 | 8.052E03 | 1.277 | |
| CN | 3.585E02 | 1.710E04 | 2.061E02 | 7.224E03 | 0.773 | 3.115 | 5.188E02 | 3.084 | 4.222E03 | 1.083 | |
| BB | 0.211 | 9.106E02 | 3.252E02 | 0.232 | 0.939 | 2.834 | 4.292E08 | 2.735 | 3.324E12 | 1.141 | |
| BN | 1.446E06 | 0.108 | 0.186 | 1.085E02 | 1.076 | 5.112 | 4.071E08 | 2.871 | 7.748E03 | 2.748 | |
| NN | 1.176E02 | 4.701E03 | 8.515E03 | 4.293E02 | 0.779 | 1.310 | 0.197 | 2.958 | 1.787E03 | 2.073 | |
| LDA | CC | 5.889E02 | 2.150E02 | 5.265E02 | 1.601E11 | 0.760 | 3.987 | 1.550E02 | 2.988 | 1.181E04 | 1.791 |
| CB | 3.811E02 | 3.606E02 | 0.105 | 2.903E-06 | 0.875 | 5.291 | 3.243E02 | 2.931 | 2.691E03 | 1.147 | |
| CN | 6.882E02 | 2.227E02 | 3.967E02 | 1.589E07 | 0.743 | 3.007 | 7.131E07 | 2.941 | 1.093E-02 | 1.268 | |
| BB | 0.274 | 0.142 | 3.252E02 | 8.587E07 | 0.696 | 3.121 | 9.474E07 | 2.677 | 3.662E10 | 1.120 | |
| BN | 8.727E08 | 0.245 | 0.302 | 7.015E02 | 1.225 | 5.929 | 5.785E08 | 2.834 | 6.142E03 | 2.950 | |
| NN | 2.002E02 | 1.658E02 | 1.182E02 | 2.889E03 | 0.774 | 1.323 | 0.159 | 2.535 | 1.111E03 | 1.522 | |
II.2 From ab initio calculations to pairwise potentials for molecular dynamics simulations
Our multi-scale approach feeds from DFT total energy calculations for various interlayer stacking and separation distances to obtain the pairwise potential needed in the molecular dynamics (MD) structural optimization that we discuss later in Sec. III. The reference input data are the total energies of graphene and hexagonal boron nitride homo and heterostructures based on the LDA and EXX-RPA calculations Leconte et al. (2017). We used the KLIFF tool kli to fit this data to the DRIP potential function Wen et al. (2018b) which improves upon the Kolmogorov-Crespi (KC) Kolmogorov and Crespi (2005); Naik et al. (2019, 2020) potential by including a dihedral-angle correction accounting for the local curvature due to local corrugations of the layers and allows for an improved description of both the total energies and forces especially for capturing the interlayer stacking dependent total energies. The MD interlayer binding energies are expressed as a sum of pairwise interaction potentials between sites and between layers
| (10) |
where the 1/2 prefactor accounts for the double counting. The DRIP pair-wise potential is given by
| (11) | |||||
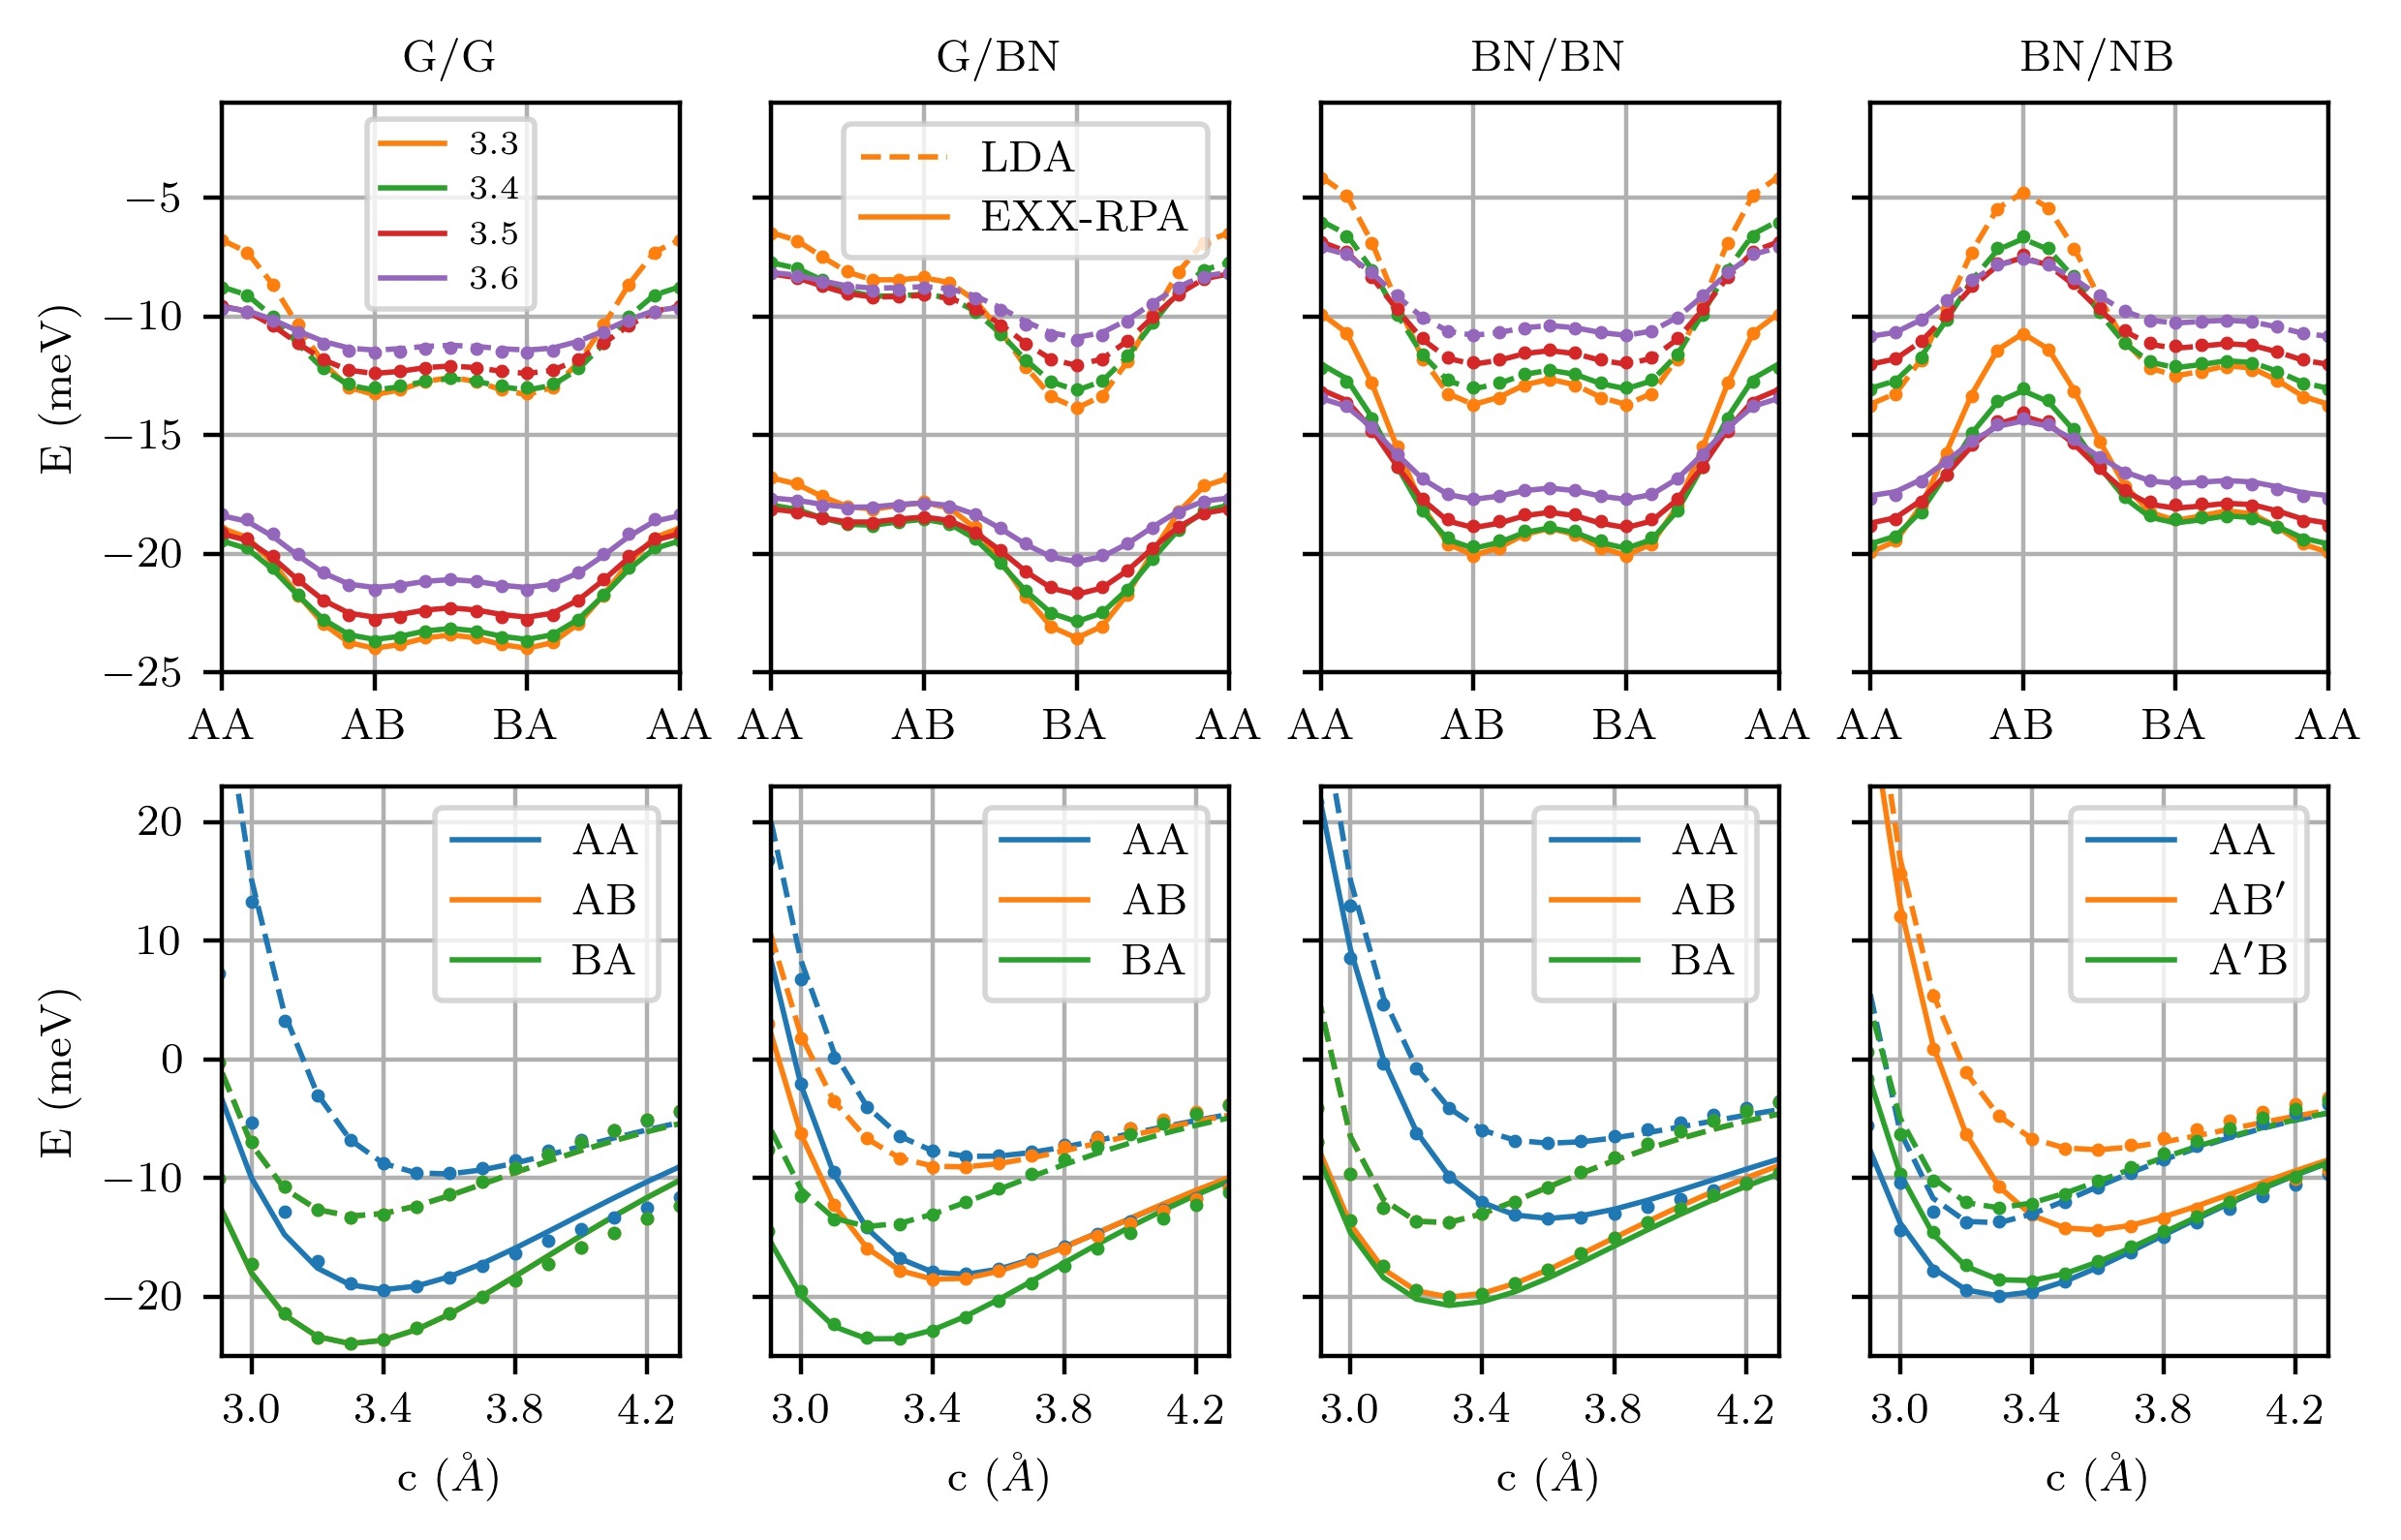
where is a cutoff function Duin et al. (2001) reminded in Eq. (32) of the Appendix where , the cutoff distance is , the is the transverse projected distance, and is a parameter related with the three dihedral angles around a given atom. The first term within parentheses that depends on the transverse distance captures the stacking-dependence between layers and is similar to the KC potential Kolmogorov and Crespi (2005). The additional dihedral angle function accounts for the local curvatures of the graphene ripples. The second term is a common attractive London dispersion contribution. The interatomic position dependent variables , , , the optimization parameters , , , and those listed in Table 2, and the functions used in Eq. (11) are defined both in Ref. Wen et al. (2018b) and can also be found in the Appendix B. For completeness we have also obtained the respective interactions between (C)arbon, (B)oron, and (N)itrogen to describe the G/BN and BN/BN interlayer interaction potentials Leconte et al. (2017). All our drip potential parameters will be made available as CBN_RPA.drip and CBN_LDA.drip files in the LAMMPS potential directory and these can be used with the input file from the drip example folder in LAMMPS. We illustrate in Fig. 2 the RPA and LDA parametrization for different layering combinations of graphene and hBN. The solid lines correspond to the EXX-RPA data and the dashed lines give the LDA-inferred data. The corresponding parameters are included in Table 2. Comparison of our parameters for hBN with other existing force fields such as the hBN-ILP potential Maaravi et al. (2017); Leven et al. (2016) will be presented elsewhere.
II.3 Molecular Dynamics simulations for the atomic relaxations in twisted bilayer graphene
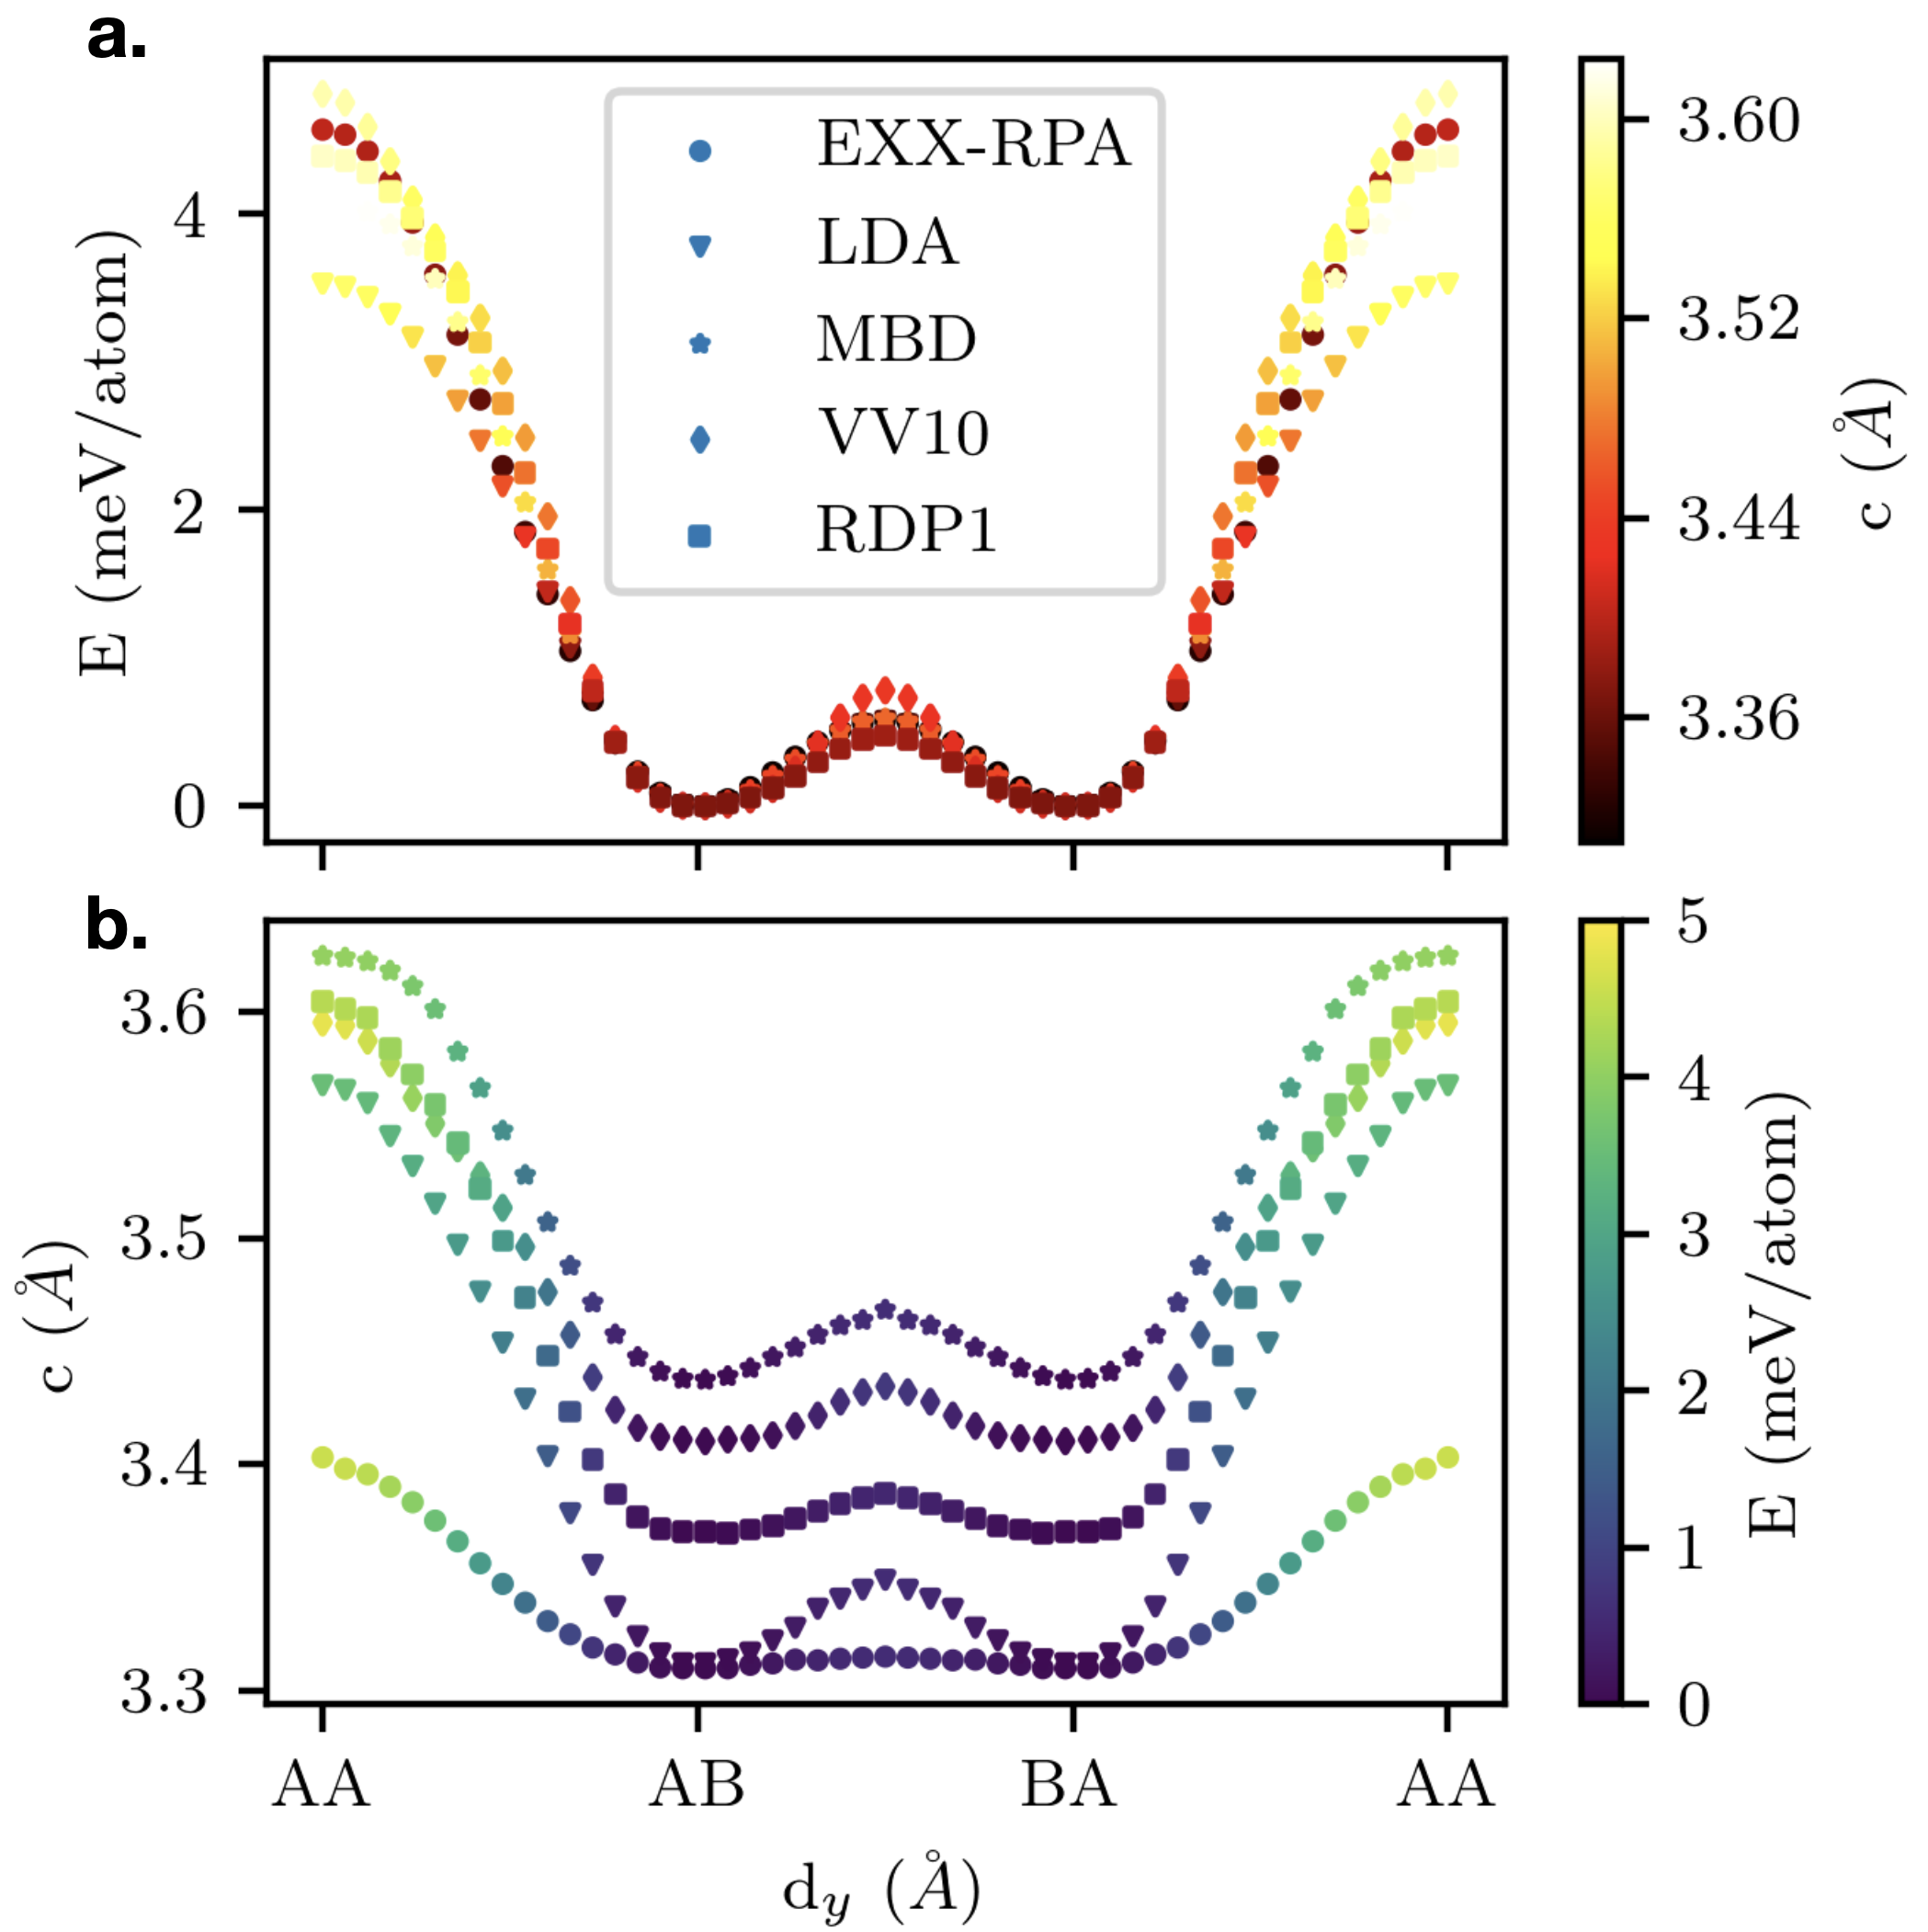
We perform molecular dynamics simulations using the LAMMPS software package Plimpton (1995) using different fitted pairwise potentials and compare existing implementations against our EXX-RPA and LDA parametrizations for the interlayer interaction energies. The impact of the MD force field choices in the atomic structure is summarized in Fig. 3 that shows the interlayer distance relaxed stacking dependent total energies together with the equilibrium interlayer distances as a function of stacking. Whereas the stacking dependent total energies remain similar between different interlayer potential choices we observe that the interlayer distance differences are reduced in the EXX-RPA approximation by 0.2 for AA stacking when compared to the LDA.
For the interlayer stacking dependent total energies both the KC-type Kolmogorov and Crespi (2005); Gargiulo and Yazyev (2017); van Wijk et al. (2014) 111In LAMMPS the full implementation without simplifications on the normals must be used to avoid spurious corrugations. We further used the local https://github.com/sgsaenger/LAMMPS/tree/rdip branch to avoid a (now corrected) bug existing in the KC full implementation existing at the time of writing and DRIP Wen et al. (2018a) potentials are considered to illustrate their impact on the structural relaxation and changes in the electronic band structure. The RDP1 parameters are taken from the original KC paper with parameters fitted to simulation and experimental data for graphite Kolmogorov and Crespi (2005), while VV10 uses the same functional form but with parameters fitted to match the VV10 vdW scheme Sabatini et al. (2013). The first work on the DRIP potential Wen et al. (2018b) was fitted to the many-body dispersion (MBD) scheme Tkatchenko et al. (2012), labelled here as MBD. As mentioned above, in our work we have fitted the DRIP potential using KLIFF kli to accurately reproduce EXX-RPA level long-range interactions in bilayer graphene Leconte et al. (2017), hereafter referred to as RPA. Our LDA data is simply referred to as LDA. Intra-layer C-C interactions are described by the REBO2 Brenner potential Brenner et al. (2002) and, when hBN is present in the system, intralayer B-N interactions are modeled by EXTEP Los et al. (2017), the extended version of the TERSOFF potential Tersoff (1988). We will discuss the impact of the graphene intralayer pairwise potential by comparing against the machine learning-informed GAP20 potential Rowe et al. (2020) as well as against the REBO-LB Lindsay and Broido (2010) obtained through reparametrization of REBO2. The atomic charges on hBN can be calculated using a Bader analysis based on DFT are 0.82275 and 0.82275 for N and B, respectively. We have neglected the electrostatic interactions between the ionized atoms in our calculations but these can be included as done for example in h-BN ILP potentials Maaravi et al. (2017); Leven et al. (2016). We will show that the choice of the intralayer MD potentials like TERSOFF, EXTEP and REBO2 has a sizeable impact in the MD relaxed geometries and consequently on the associated electronic band-structures.
II.4 Intralayer MD potentials and continuum elastic parameters
The relaxed atomic positions result from an interplay between the interlayer coupling potentials and the intralayer elastic parameters that resist the deformation of the atoms. Here we report the elastic constants of graphene and hexagonal boron nitride that result from the chose molecular dynamics interatomic potentials that were obtained using the formulas in Ref. Thomas et al. (2018) for the Young’s modulus
| (12) |
and the Poisson ratio
| (13) |
where are the elements of the second order elastic constant matrix typically defined as Thomas et al. (2018)
| (14) |
where is the energy obtained by summing the pairwise interactions of monolayer graphene (or hBN) as given in Eq. (10), is the equilibrium area of the unit cell of graphene and is the out of plane interlayer distance or equivalently the thickness. We denote by the dimensionless strain in direction that indicates the overall length change ratio. In practice, we have used the built-in LAMMPS routines to obtain the elastic coefficients by implementing the definitions in Eq. (12 13), and these coefficients were obtained by deriving the pressure tensor components calculated by LAMMPS with respect to the strain components Lam . We have confirmed the mechanical stability of all these potentials by verifying the following conditions jian Wu et al. (2007)
| (15) |
We summarize in Table 3 the continuum elastic parameters such as the 2D version of the Young Modulus (), the Poisson ratio and Lamé parameters associated to the C-C and B-N interatomic potentials and how they compare with DFT.
| Y2D (N/m) | (eV/Å2) | (eV/Å2) | |||
|---|---|---|---|---|---|
| C-C | DFT (MC) Zakharchenko et al. (2009) | 346 | 0.127 | 3.25 | 9.57 |
| DFT (GGA) Kudin et al. (2001) | 345 | 0.149 | 3.97 | 9.37 | |
| DFT (GGA) Wei et al. (2009) | 348 | 0.169 | 4.74 | 9.29 | |
| REBO2 Brenner et al. (2002) | 243 | 0.397 | 20.96 | 5.42 | |
| REBO-LB Lindsay and Broido (2010) | 364 | 0.098 | 2.51 | 10.34 | |
| GAP20 Rowe et al. (2020) | 317 | 0.193 | 5.22 | 8.31 | |
| B-N | DFT (LDA) Sachs et al. (2011) | 290 | 0.160 | 3.7 | 7.8 |
| DFT (GGA) Sachs et al. (2011) | 284 | 0.153 | 3.4 | 7.7 | |
| DFT (GGA) Peng et al. (2012) | 278 | 0.225 | 5.79 | 7.08 | |
| TERSOFF Tersoff (1988) | 250 | 0.31 | 9.81 | 5.96 | |
| EXTEP Los et al. (2017) | 269 | 0.179 | 3.98 | 7.12 |
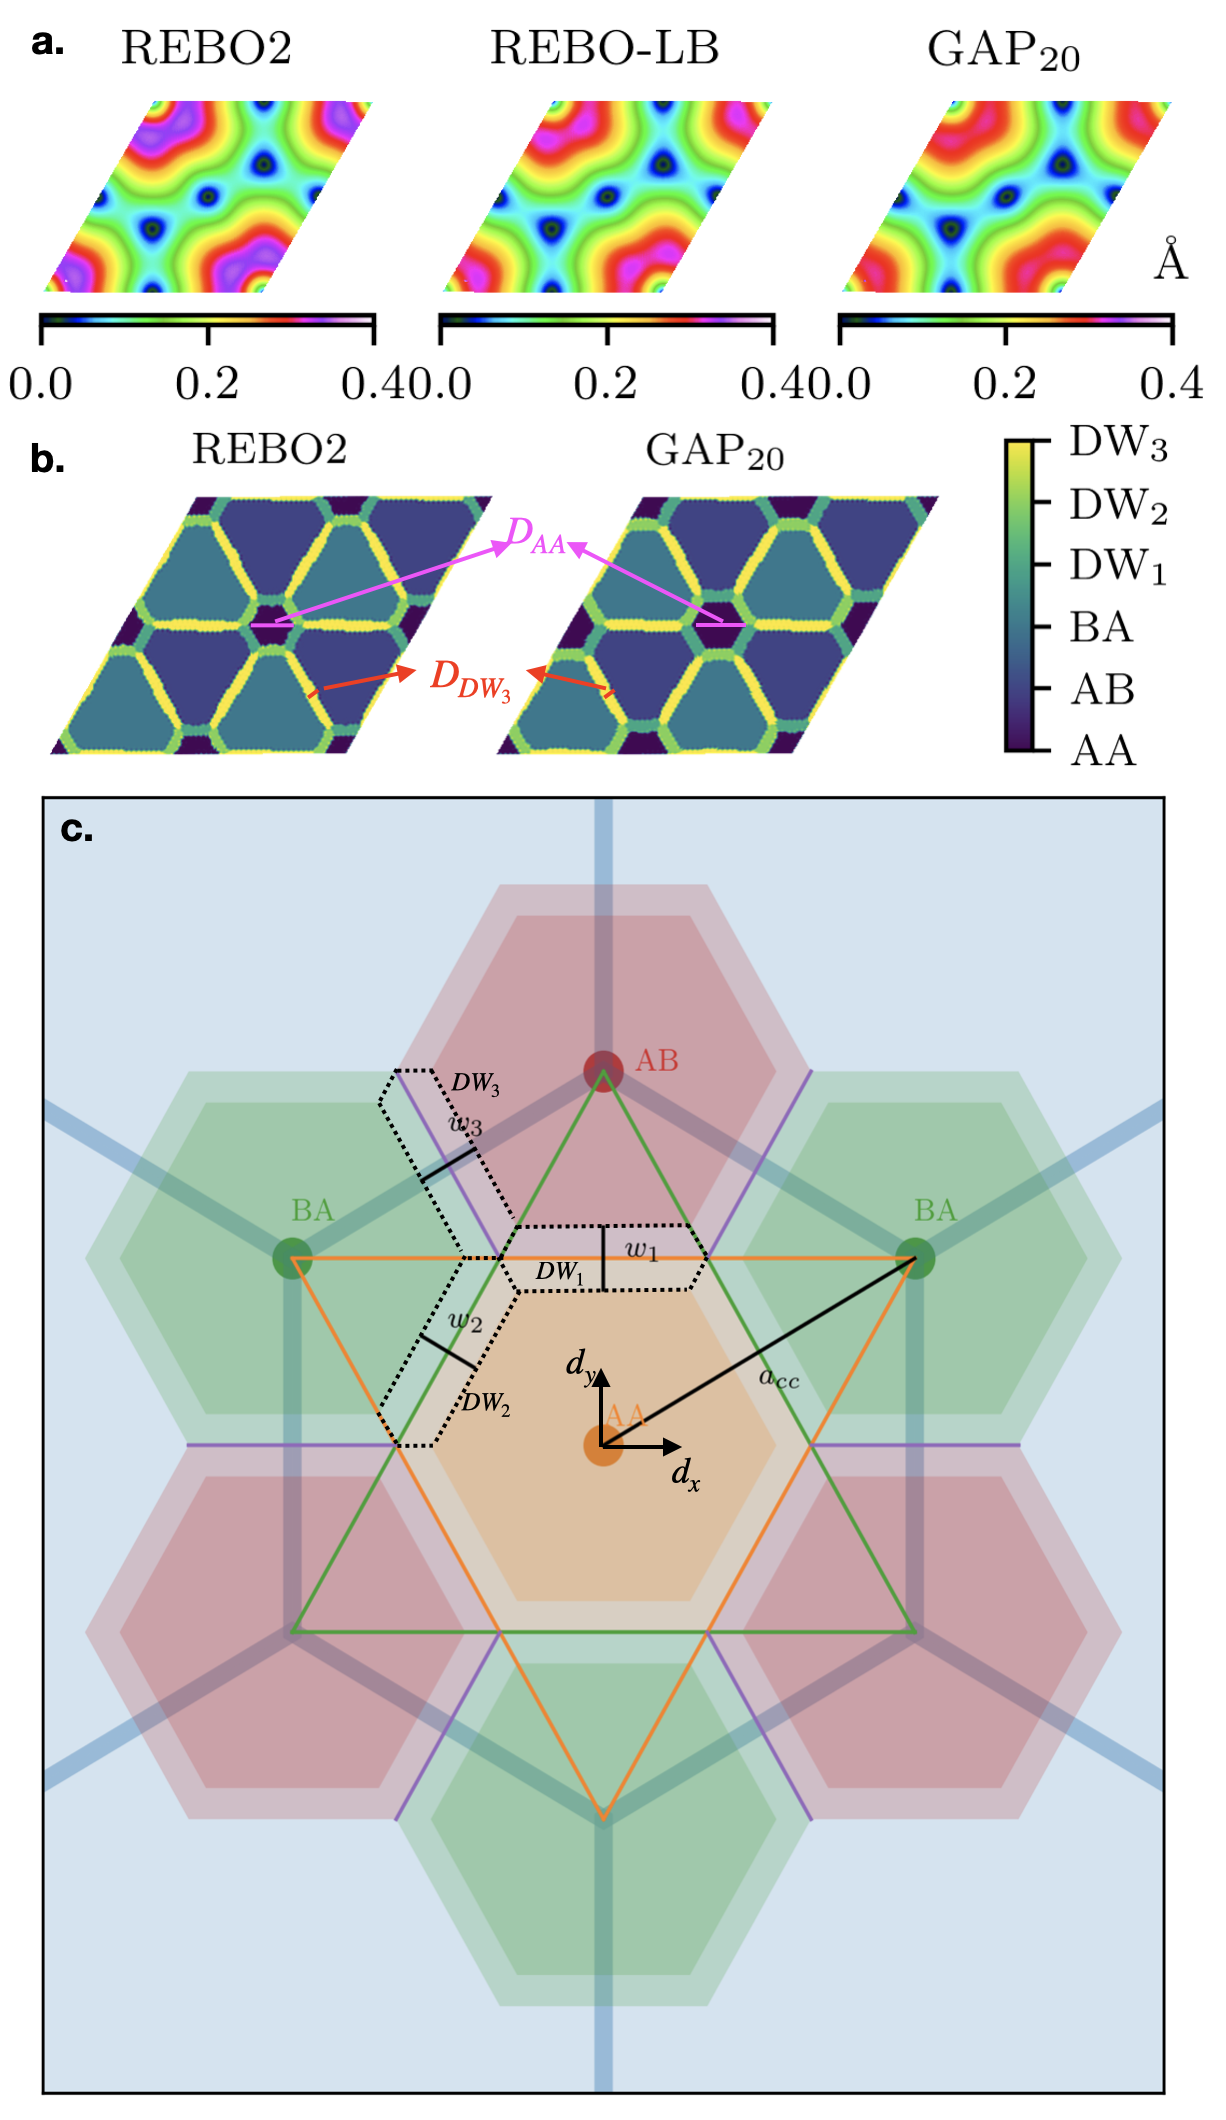
The choice of the interatomic potentials makes a significant impact in the final atomic positions. Even though the empirical REBO2 and hBN TERSOFF potentials are computationally efficient they tend to overestimate the strains. We illustrate this behavior in Fig. 4a. through the in-plane strain profiles in tBG for increasing Young’s moduli where we have compared the lattice reconstructions obtained using the GAP20 potential Rowe et al. (2020), and the REBO-LB potential Lindsay and Broido (2010). The advantage of GAP20 is that it yields a Young’s modulus (317 N/m) and a Poisson ratio (0.193) that approaches the DFT estimates slightly better than REBO2, while EXTEP matches the experimental G-BN lattice mismatch better than TERSOFF Tersoff (1988). REBO-LB is computationally less expensive than GAP20 and reproduces certain DFT elastic predictions Zakharchenko et al. (2009); Kudin et al. (2001); Wei et al. (2009) quite well Akinwande et al. (2017). However, this potential becomes unstable for quite small deformations that we could see for example in the resulting elastic coefficients and therefore we have avoided its use. The in-plane displacements are gradually decreased when switching the C-C interactions from the original REBO2, to the reparametrized REBO-LB and the GAP20 ML potential. We note that GAP20 reduces the maximum displacements from Å to Å by about 25%.
The relative area distribution of different local stacking configurations is also an indicator of the strain effects. We break down the moire superlattice area
can be divided into AA, AB, BA local stacking geometries and the areas of the squashed hexagons in the domain wall are multiplied by three to account for the three interfaces. For rigid systems without strains all three local stacking regions and domain wall areas are the same. This procedure is reminiscent to building the Wigner-Seitz cells but here we additionally introduce the domain walls in between the symmetric stacking configurations. We use the local stacking vector at each unit cell position that we define as the in-plane distance between closest same sublattice atoms in neighboring layers. We mark the symmetric AA, AB, BA stacking regions through hexagon tesselation where we choose equal domain wall widths of as we schematically illustrate in Fig. 4c. With this choice of domain wall width the ratio of relative area of the domain wall versus total supercell area is defined local stacking surface ratio is of 30.5%. This definition is used to obtain the evolution of domain wall widths between the AB and BA regions, defined here as and we obtain values of , , and nm for , , and , respectively, for both GAP20 and REBO, suggesting the choice in potential doesn’t matter too much for this specific observable. The trends are similar to the results reported in Ref. Kazmierczak et al. (2021) that uses different conventions to define the local stacking regions where the experiments predict a decreasing domain wall widths with increasing angle where our range of simulation also allows to locate the an initial increase between and twist angles. The diagonals of the hexagonal AA regions are given here by and they are equal to , and nm for GAP20 and , and nm for REBO2, for , and , respectively. The REBO2 potential gives smaller values, confirming its tendency to overestimate the actual lattice reconstruction with respect to the GAP20 potential.
III Tight-Binding electronic structure calculations
Our implementation of the tight-binding electronic structure model for twisted bilayer graphene separates the intralayer and interlayer contributions in an effort to improve its accuracy in a controlled manner. A commonly used two center (TC) model Nam and Koshino (2017); Laissardiére et al. (2012) is based on the interatomic distance vector between atoms and under the Slater-Koster Slater and Koster (1954) approximation, and which captures both intralayer and interlayer contributions simultaneously through
| (17) |
where
| (18) |
and
| (19) |
where is the magnitude of the interatomic distance and is the vertical axis projection along the -axis normal to the graphene plane. For simplicity, here we have defined a fixed normal vector along the -axis rather than allowing it to tilt with the local curvature following the surface corrugation. The parameter is the interlayer distance, is the rigid graphene’s interatomic carbon distance, eV the transfer integral between nearest-neighbor atoms, eV the transfer integral between two vertically aligned atoms that were fitted to generalized gradient approximation (GGA) data for fixed interlayer distances Laissardiére et al. (2012). The decay length of the transfer integral is chosen as such that the next-nearest intralayer coupling becomes 0.1 . The cutoff for this distance-dependent model is finally set to beyond which additional contributions do not affect the observables anymore Laissardiére et al. (2012). This form is widely used in the literature Koshino (2019); Andelković et al. (2020) and we will show that is good at reproducing the largest magic angle in tBG around , even though the corresponding nearest neighbor effective hopping term obtained by adding all intralayer intra-sublattice terms Jung and MacDonald (2013) gives an estimate of eV and thus its associated Fermi velocity of graphene is much smaller than experiments or even the LDA.
The improved hybrid tight-binding Hamiltonian that we propose treats intralayer and interlayer hopping terms separately as
| (20) |
Different tight-binding Hamiltonians can be proposed depending on how we define the intralayer and interlayer hopping terms. We consider three models. The first one is the scaled two center (STC) model that uses the same intralayer Hamiltonian as in Eq. (17) but uses a scaling factor for the interlayer hopping terms , where the parameter is fitted to calibrate the magic angle value for each choice of force field, or equivalently relaxed atomic structure. The value can also be modified to obtain the band structures for arbitrary effective twist angles as we will discuss later. The scaled hybrid (SH) model uses the so called F2G2 model Jung and MacDonald (2013) for the intralayer Hamiltonian to improve the accuracy when describing a single graphene layer and maintains the same interlayer coupling as the STC. Our main proposal for this work is the scaled hybrid exponential (SHE) model where the interlayer hopping terms are improved to match the interlayer tunneling data from ab initio calculations resulting in
| (21) |
where and . This SHE model will be used hereafter to present our results and we will generally omit its explicit labeling. In the following we discuss the improvements made for the intralayer and interlayer tight-binding Hamiltonian terms to better match the ab initio calculations.
III.1 Intra-layer ab initio tight-binding models
The intra-layer hopping terms can be improved by using ab initio calculation fitted tight-binding models as presented in Ref. Jung and MacDonald (2014) where we can systematically control the range of finite hopping terms. Here we use the so-called F2G2 model that includes up to two nearest neighbor inter- and intra-sublattice hopping terms in single layer graphene that enhances the accuracy of the Hamiltonian in the entire Brillouin zone while retaining relative simplicity. We adopt a Fermi velocity of that amounts to an enhancement of the nearest neighbor hopping term of eV instead of using the LDA value of eV in a nearest neighbor only model. In our F2G2 model this implies using an enhanced physical nearest neighbor inter-sublattice hopping term of eV together with other four additional nearest neighbor hopping terms. We note that this effective Fermi velocity is closer but somewhat smaller than the typical value of m/s, or equivalently eV, for graphene on SiO2 substrates whose electron mobilities are comparable to those of tBG. Additional corrections to the F2G2 intralayer hopping terms in the presence of bond distortions can be added through exponentially decaying terms Pereira et al. (2009) resulting in
| (22) |
where are the intralayer interatomic hopping terms of the rigid F2G2 model, and are the rigid lattice’s in-plane interatomic distances between and atoms.
III.2 Inter-layer scaled tight-binding model
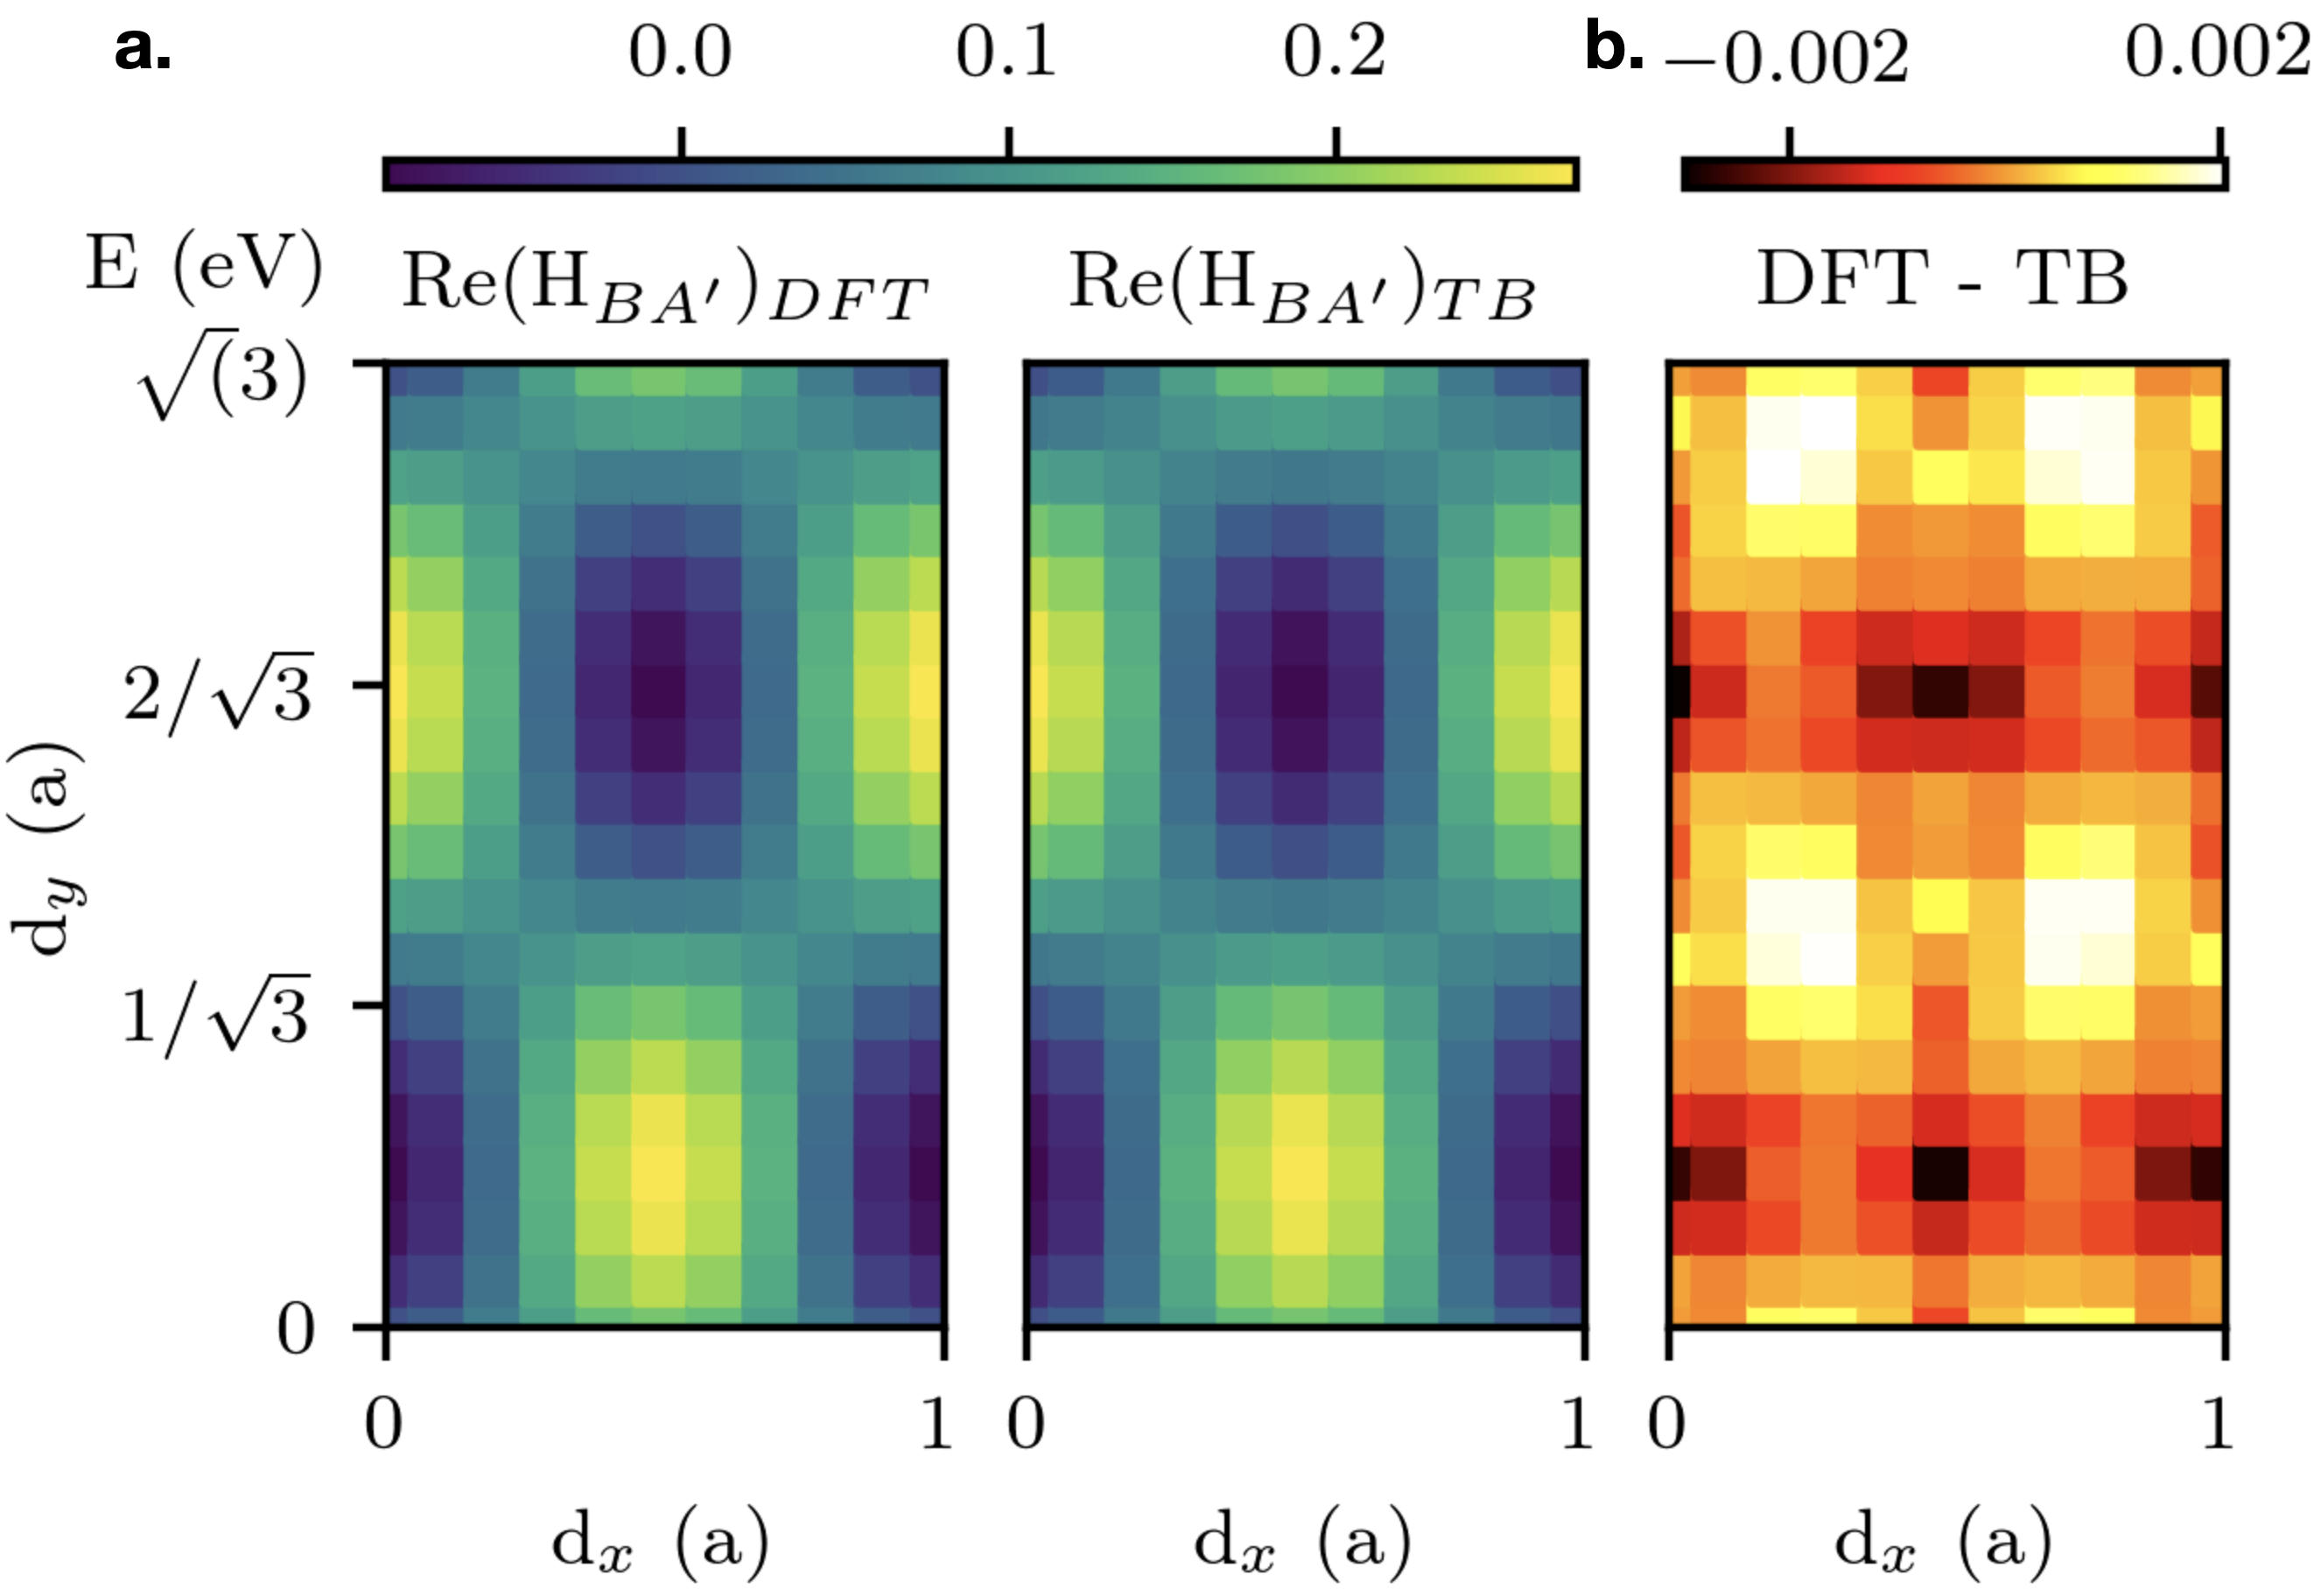
We propose a new interlayer tight-binding Hamiltonian model that allows to better reproduce the ab initio tunneling at the K-point Jung et al. (2014) for different interlayer distances and give a better account of surface corrugations or the influence of pressures. The DFT-LDA interlayer tunneling data at the -point was obtained through the Quantum Espresso code package using a 30301 Monckhorst pack k-grid and making minimal modifications to Wannier90 code to extract the tunneling Jung et al. (2014). The equivalent TB tunneling at the -point between interlayer sites of an aligned system with four atoms per unit cell is calculated using
| (23) |
where the and label the two different sublattices , and , of bottom and top layers. Once we fix a given site in the bottom layer sublattice we carry out a sum over all possible sites of sublattice in the top layer until the sum is converged. Because is a 2D vector, only the in-plane components of the 3D distance vector contributes in the scalar product. The vector is the sliding of the top layer unit cell dimer with respect to the bottom layer unit cell Jung et al. (2014). We will mainly use the SHE model in Eq. (21) that contains a local interlayer distance -dependent exponential function
| (24) |
where depends on the relaxation model used. The parameters in the exponential term were fitted with and for the rigid twisted bilayer assuming that . This exponential rescaling term alone allows to give an improved agreement data where the differences are of the order of 2% at most. See Fig. 5 for the agreement of maps. A similar agreement is found for tunneling although it is not shown. A benchmark comparison of DFT vs our tight-binding implementation for a twist angle of is shown in Fig. 6 for different interlayer distances where we can observe a close agreement between both models especially at low energies. The DFT-LDA bands were obtained through Quantum Espresso using a cutoff of 60 Ry (800 eV) with ultrasoft pseudopotentials on a 661 Monckhorst k-point grid. The inset of Fig. 6 shows how this exponential term enhances the interlayer tunneling with growing and allowing the TB calculations to give bands that agree more closely the LDA-DFT results.
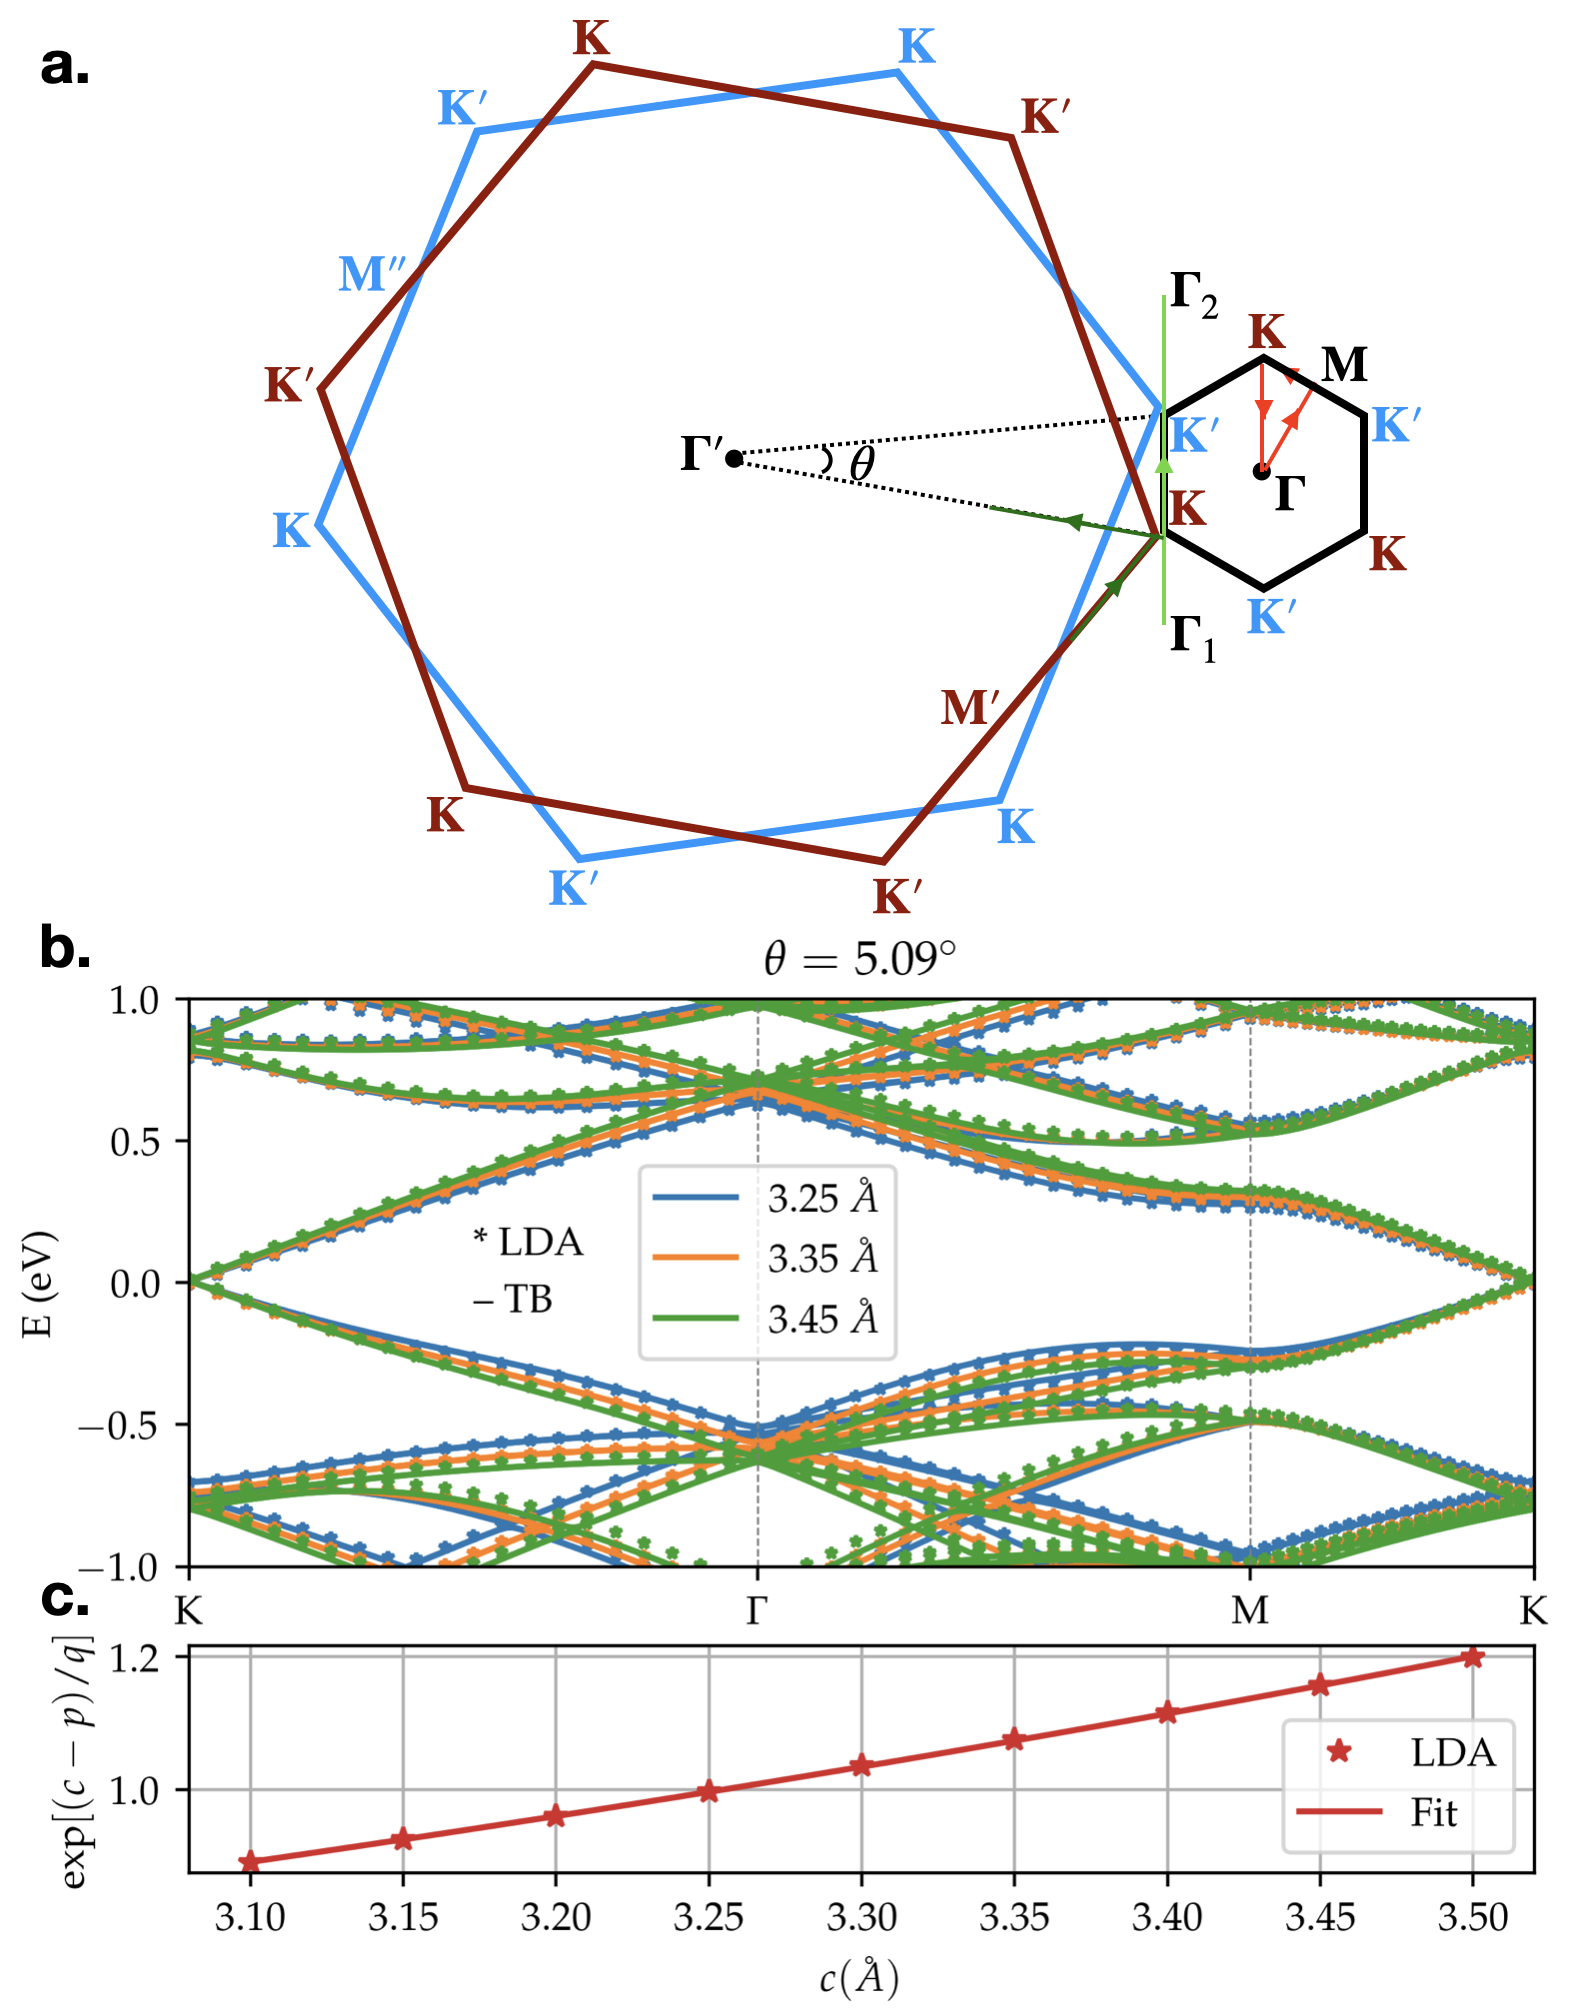
The prefactor in Eq. (24) is a relaxation model dependent parameter that can be varied to calibrate the magic angle to a value of our choice. For brevity of notation we will drop the explicit model label from here onwards. For convenience we further decompose this fitting constant into two parts as
| (25) |
where we have distinguished the dimensionless term and the is a relaxation model dependent parameter and accounts for the changes in the electronic structure due to relaxation strains. The parameter is the inverse of the dimensionless constant corresponding to the first magic angle of tBG defined in Ref. Bistritzer and MacDonald (2011). This parameter captures the interdependence between the intralayer Fermi velocity, the interlayer tunneling strength and the magic angle. The constant corresponding to the first magic angle results from our choice of , eV and eV of rigid bilayer graphene Chittari et al. (2018) and is slightly larger than the value of found numerically in Ref. Chittari et al. (2018) because here we are using different parameters for the Fermi velocity and interlayer tunneling. The updated scaling parameter that we obtain when we allow for , , parameters to change can be obtained by using the updated value
| (26) |
This type of corrections in the scaling parameter will be convenient for example when we need to calculate the moire band structures of a different effective twist angle
| (27) |
using the reference angle of the commensurate superlattice. Different reference twist angles can be used together with a rescaled parameter to describe an arbitrary that varies continuously. Once is fixed for a given rigid model we can change the strain profile dependent parameter to calibrate the magic angle of the system. The parameters listed in Table 4 for each type of relaxation strain corresponding to different force fields are chosen to bring the different magic angles to the same value as will be illustrated in Fig. 7 of Sect. IV. The expression for the interlayer tunneling in our SHE model for the EXX-RPA force fields is
| (28) |
where the coefficient for the RPA relaxed geometries reduces the overall interlayer tunneling strength with respect to the value of the rigid model to compensate for the enhancement of the magic angle due to lattice relaxation.
In Table 4 we list the model dependent scaling parameter needed to bring the magic angle to for different relaxation models and intralayer hopping model choices.
| STC | SH | SHE | |
|---|---|---|---|
| RPA | 0.752 | 0.951 | 0.895 |
| LDA | 0.804 | 1.018 | 0.945 |
| MBD | 1.069 | 1.353 | 1.144 |
| KC-VV10 | 0.970 | 1.247 | 1.091 |
| KC-RDP1 | 0.884 | 1.136 | 1.018 |
| Rigid | 0.856 | 1.083 | 1.008 |
IV Electronic structure of lattice relaxed twisted bilayer graphene
In this section we obtain the electronic band structure of the tBG models from real-space tight binding calculations when the atomic structure is relaxed. In particular, we show how the lattice relaxations can impact the magic angle value and the shape of the low energy nearly flat bands in twisted bilayer graphene. The density of states (DOS) as a function of twist angle shows two peaks associated each with maxima points stemming either from the valence or conduction bands. We also show that the a hexagonal boron nitride substrate with a large twist angle with respect to graphene makes a negligibly small impact of the order of a few meV in the band structure.
IV.1 Magic angles of lattice relaxed tBG systems
Originally the magic angles in tBG continuum models were defined based on the vanishing band dispersion slope at the -point which coincided with the development of almost perfectly flat low energy bands Bistritzer and MacDonald (2011). This definition becomes less rigorous in a tight binding model because the bands are not perfectly flat anymore at different regions of the moire Brillouin zone and the electron-hole asymmetry becomes more pronounced. For this reason we define the magic angles as those twist angles that give rise to the narrowest bandwidths of the low energy nearly flat bands defined as including both conduction and valence low energy bands. We will also analyze in the next Section the properties of the low energy bands from the viewpoint of maxima peaks in the density of states.
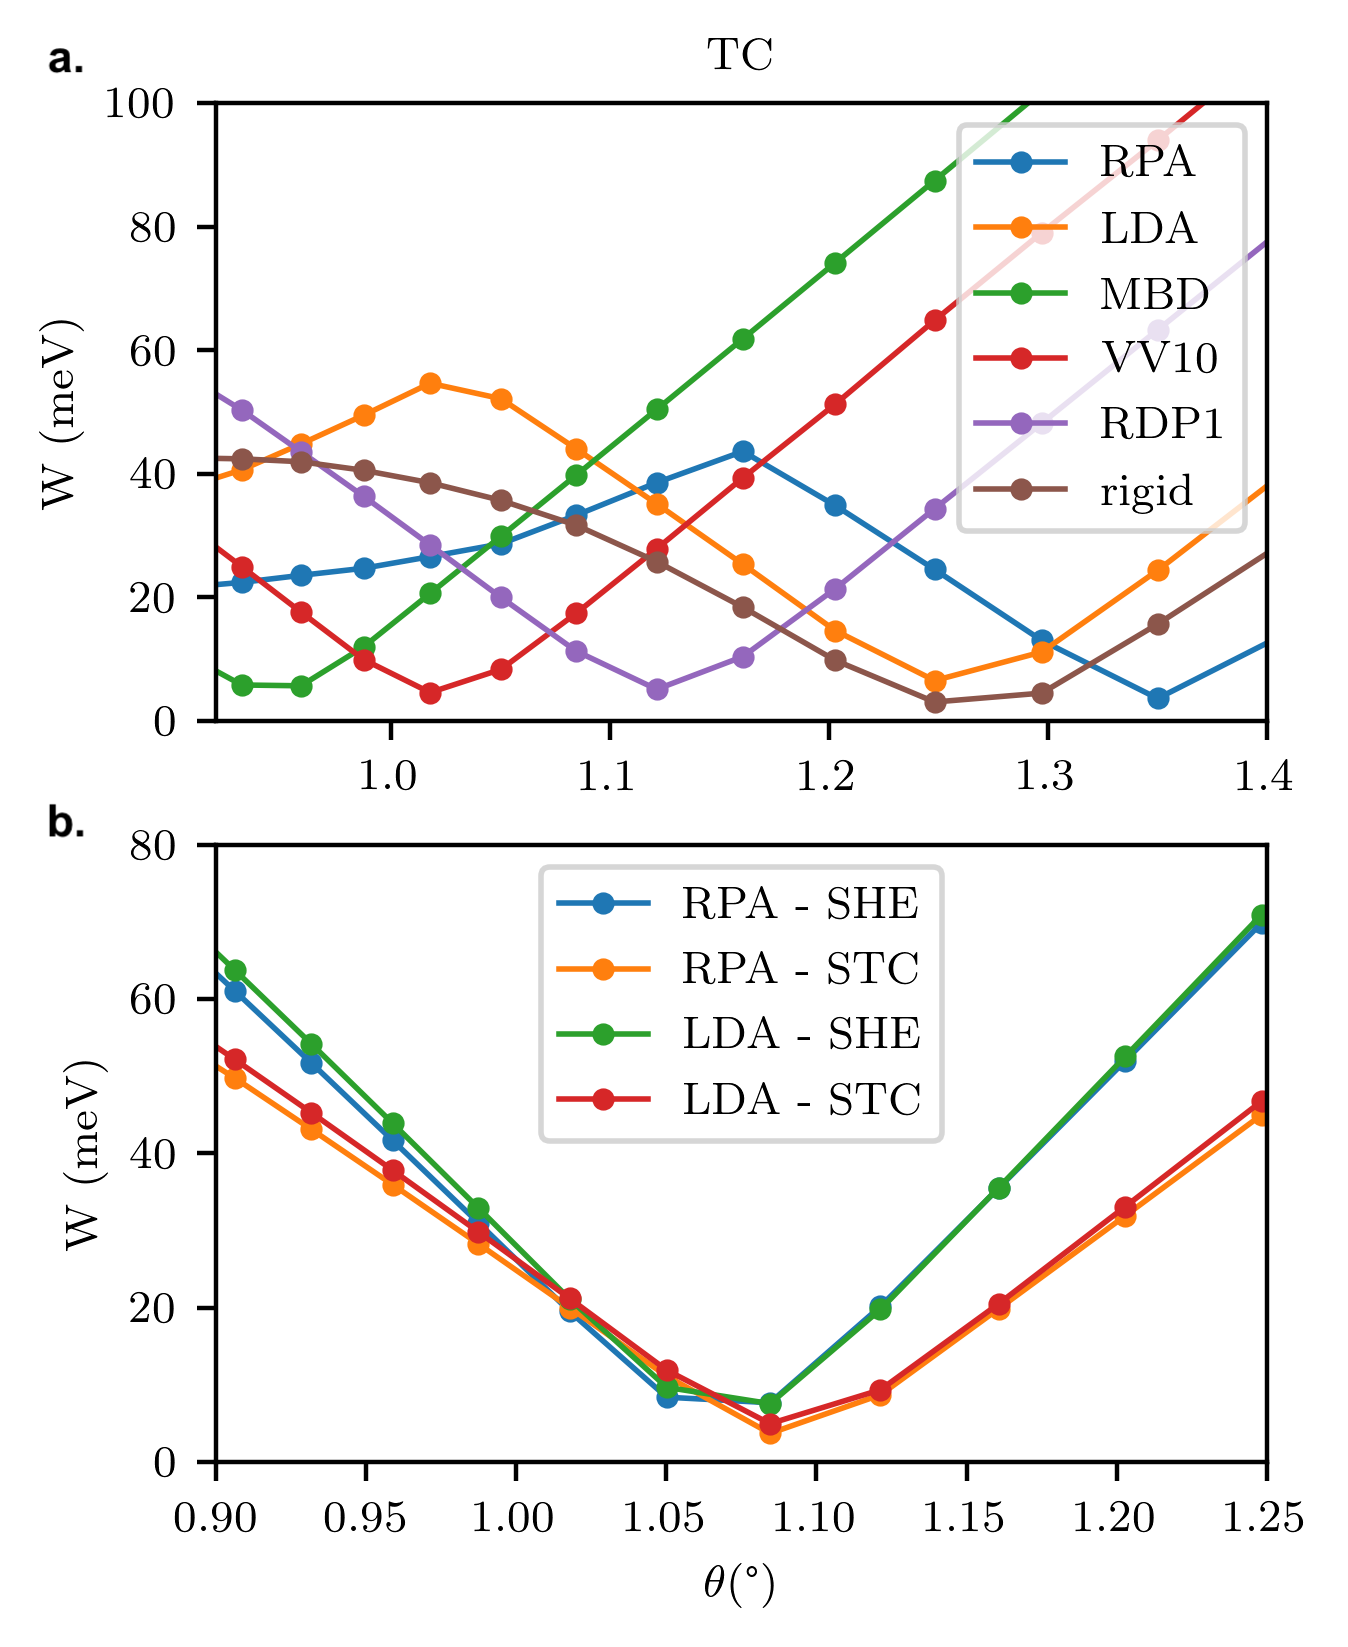
In Fig. 7 we show the evolution of the bandwidth as a function of twist angle for different lattice relaxed atomic structures. Within the same two center (TC) approximation given in Eq. (17) we notice how the minima positions of for different relaxation models vary in a wide range of values between 0.91.3∘ being the rigid model’s magic angle around 1∘. The rigid model’s does not change much within a twist angle range of as it gives rise to a double minima shape, see the appendix Fig. A.11. As a general observation, the magic angles are underestimated or overestimated depending on the interlayer and intralayer relaxation schemes while differences in the electronic structure due to intralayer strains as described in Eq. (22) can modify the magic angle typically by about . The pseudomagnetic fields generated by hopping term asymmetries between the nearest neighbors are also dependent on the associated cutoff of the hopping range, i.e. if one only the first nearest neighbor hopping terms are modified the behavior is very similar to the case where one does not include such renormalization at all.
The minima in as a function of becomes better defined when we account for the lattice relaxations. By using the scaled two center approximation (STC) in Eq. (21) with the calibration parameters in Table 4 we notice that all magic angles can be brought to the same 1.08∘ although they have different values depending on the relaxation model. The quantitative details in the resulting band structures for the magic angles are shown in Fig. 7.
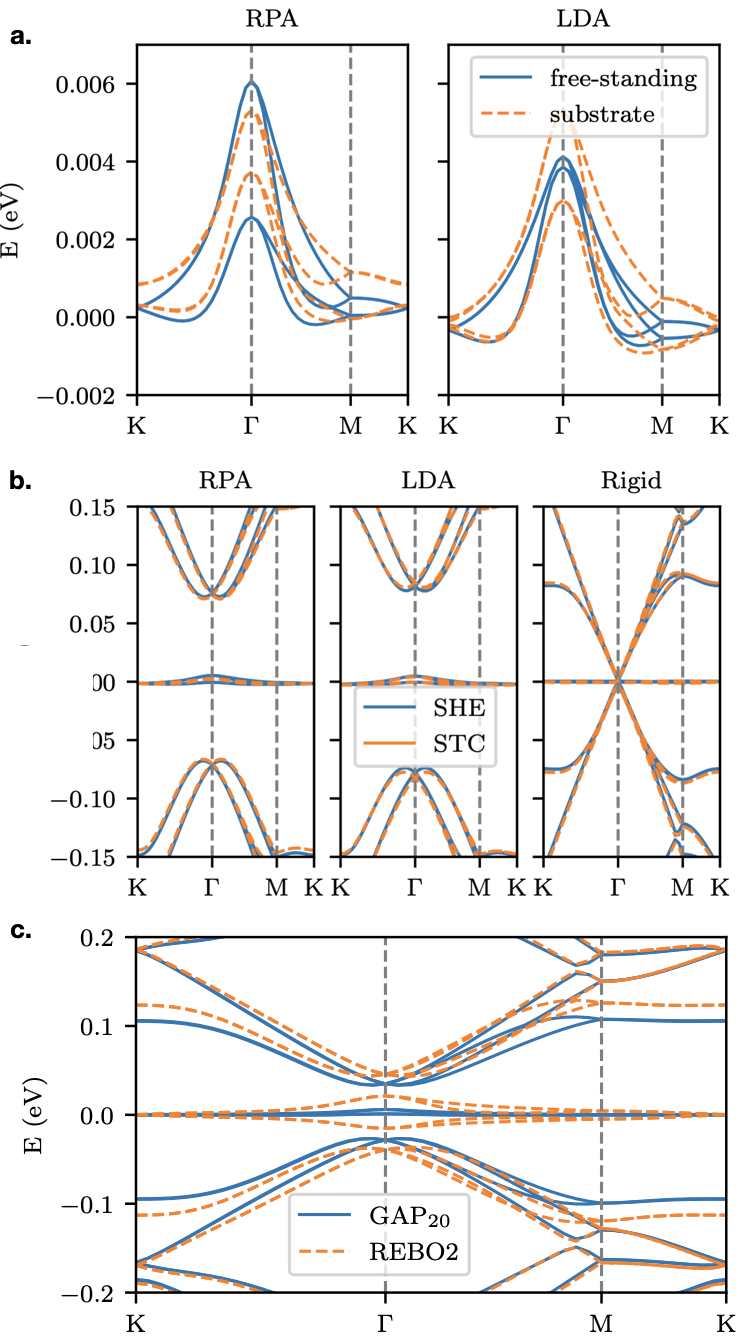
We further illustrate in Fig. 8 the quantitative impact that different relaxation schemes like the RPA and LDA makes in the band structures at the magic angle, as well as the changes introduced to the atomic structure by an hBN substrate that is rotated by a large twist angle of 13.37∘ to avoid the strong double moire effects expected when G and BN are nearly aligned Leconte and Jung (2020). We have used up to four hBN substrate layers keeping the bottom layer rigid and verified that in practice the result is similar to allowing one hBN layer contacting graphene to relax freely. Hence, we can conclude that small differences in the relaxation profile due to the substrate interaction are responsible for the small meV scale differences in the band structures. In Fig. 8a. we show that the substrate weakly changes the bandwidth and gaps on the order of meV at the -point in the RPA-relaxed system. Because its impact is at the limits of experimental resolution, we argue that the free-standing tBG is a good approximation to tBG deposited on a bulk hBN substrate at a large twist angle. We use this figure to confirm the trend that flat bands tend to be slightly bent at the -point Carr et al. (2019), confirming that already within the non-interacting electron picture we can observe a minimum of the valence band away from the point Zhu et al. (2021).
When we calculated the electronic band structure using the GAP20 potential during the relaxation step in Fig. 8c., we notice that our EXX-RPA interlayer and GAP20 intralayer force field combination with the TC model without magic angle calibration already leads to an extremely flat band at . Yet, because REBO2 is still much faster from a computational perspective, this empirical potential is a viable alternative when used in combination with the magic angle scaling factor introduced in Sect. III.2 when our focus is mainly on the electronic structure. For a quantitative analysis of the lattice reconstruction REBO2 falls short according to observations discussed in Sect. II.4.
IV.2 Multiple DOS peaks structures near the magic angle
In the following we discuss in more detail the band structures of tBG calculated near the magic angle and show how the DOS maxima for the valence and conduction bands happen at angles slightly separated from each other when they are calculated with enough energy resolution. The band structure is represented along high-symmetry points at selected angles where the supercell BZ is coincident with the moire BZ as discussed earlier. The band structures for twist angles that deviate from this value can be represented in the same moire Brillouin zone by using the updated scaling factor given in Eq. (27) where an angle difference is added with respect to a reference twist. For the electronic band structure calculations, we use exact diagonalization, while the density of states are obtained using Lanczos recursion as
| (29) |
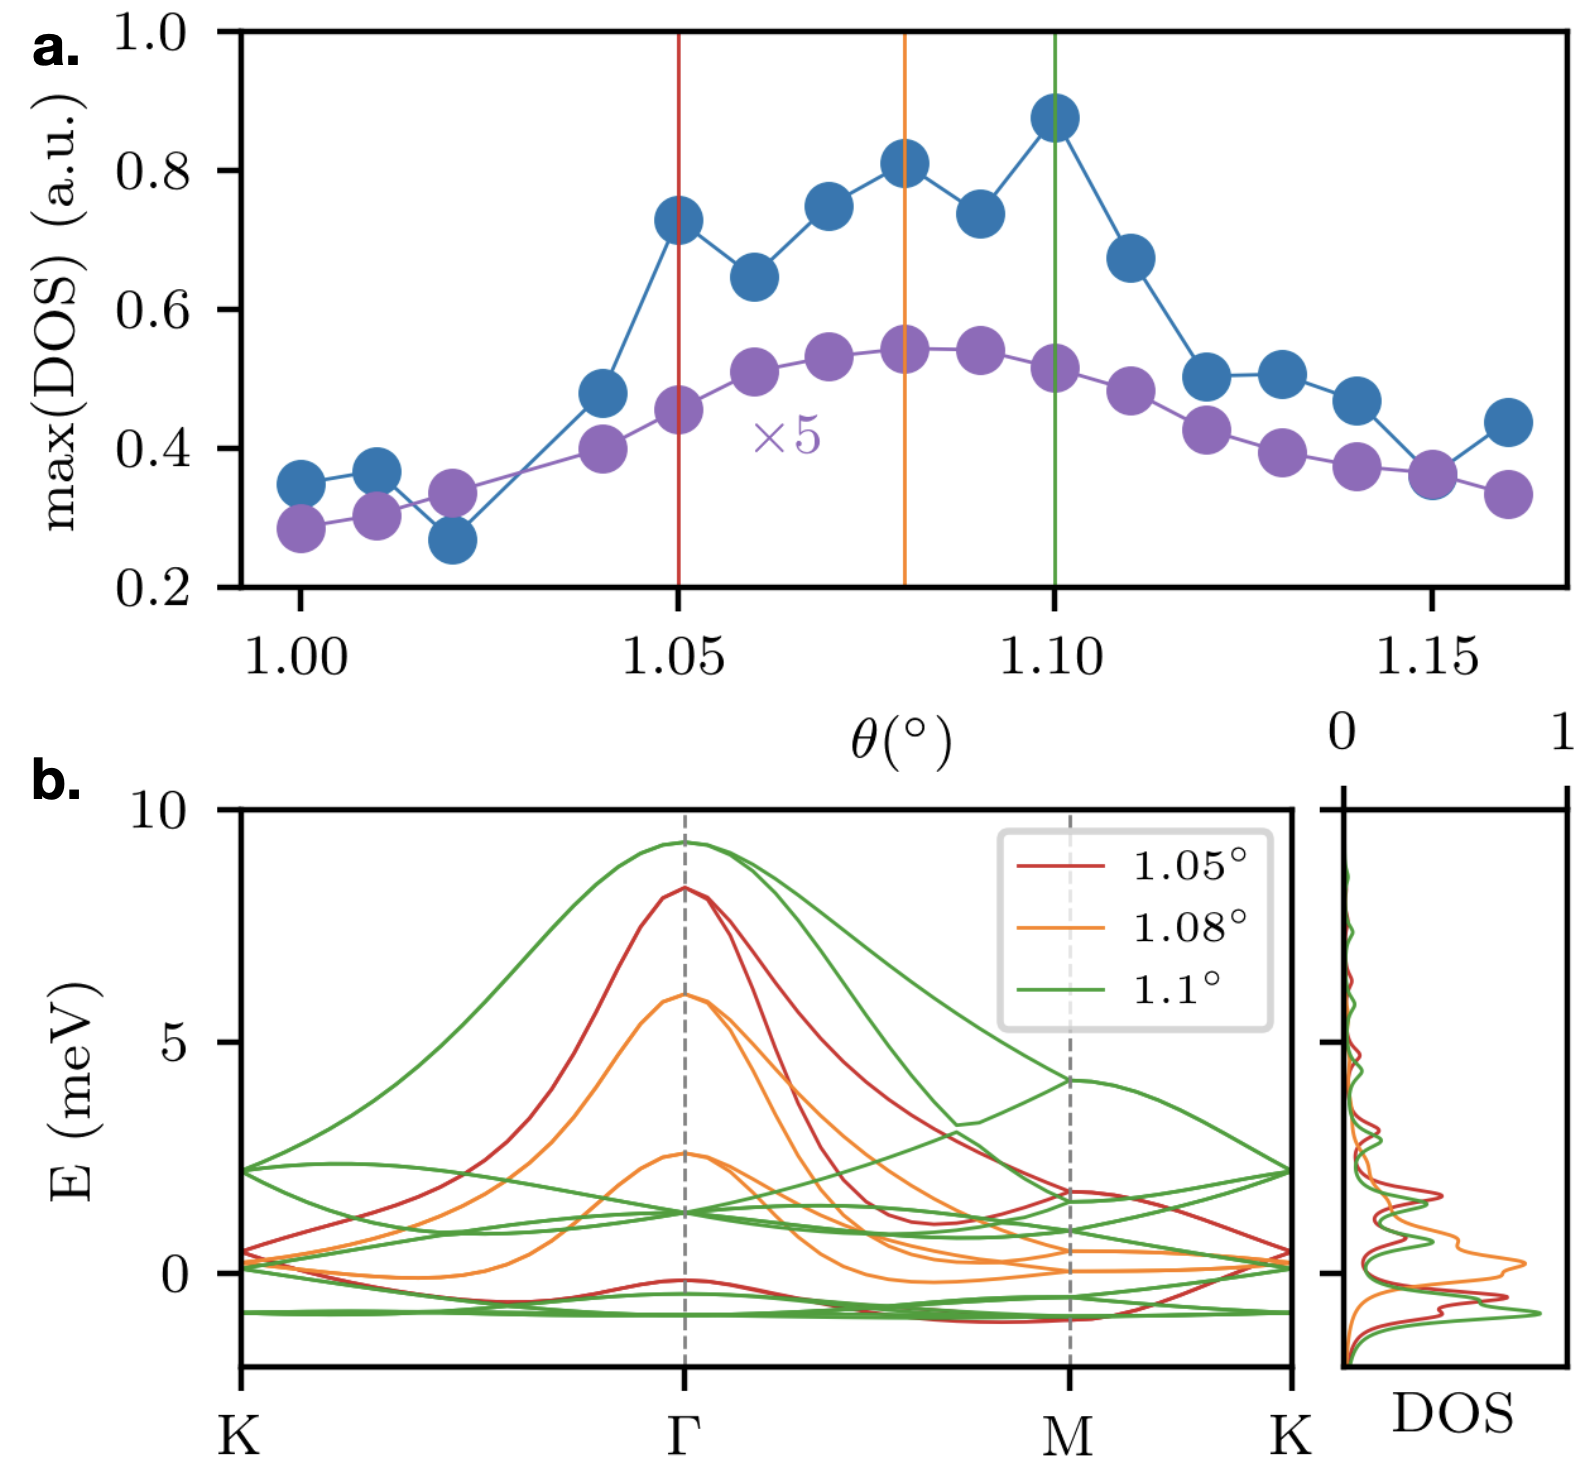
where RP refers to a random phase being used to approximate the trace of large matrices Fan et al. (2021), is the tridiagonal Hamiltonian approximating the full Hamiltonian that is useful for continued fraction methods. The parameter is the broadening that limits the energy resolution of the DOS. The resulting DOS of tBG as a function of twist angle shown in Fig. 9a. reveals a high DOS region within an interval between 1.05∘ and 1.11∘, in other words for a span of twist angles within around the minium magic angle.
A closer look at the band structures associated to the twist angles in this region shows that the DOS weights are transferred between the valence and conduction bands depending on small twist angle changes around the magic angle. In Fig. 9b. we show that the DOS weights distribute in both valence and conduction bands at the magic angle of 1.08∘ but they are mainly shifted to the valence bands when the twist angle is departed by for 1.05∘ and 1.10∘.
V Spectral function calculation
The band structure of a superlattice has multiple bands proportional to the atom number in the cell and it is often preferable to obtain the spectral function Ku et al. (2010); Nishi et al. (2017); Matsushita et al. (2018); Amorim (2018); Mucha-Kruczynski et al. (2015); Zhu et al. (2021); Amorim and Castro (2018) that allows a more intuitive interpretation of the quasiparticles as well as a direct comparison against experimental ARPES measurements. In our calculations we use the implementation approach in Ref. Ku et al. (2010) to obtain the spectral function of large supercell systems to account for the moire pattern effects. Enlarged period supercells are commonly used to account for impurities, vacancies, lattice distortions, or spontaneous long-range orders. The electronic structure of the zone-folded large supercells can be represented using spectral functions in the Brillouin zone of a smaller periodic unit cell through
| (30) |
where the eigenbands of the supercell are labeled with capital letters. The labels the Bloch function basis with the localized orbital in the reference small unit cell and can be used to distinguish the layer and sublattice. Without loss of generality we chose to represent the orbital content in our spectral functions. The reduces to a function at the eigenvalue of the superlattice system and
| (31) |
is a structure factor which is modulated by a position dependent phase term where is the position of the atom in the supercell. Each term is multiplied by the coefficients of the supercell eigenstate projected in the tight-binding basis , and the and are the number of k-points in the supercell and reference small cell Brillouin zone (BZ) respectively. The denotes the k-point folded into the supercell BZ, and here and are the orbital indices in the supercell and normal reference cell respectively. The weight coefficient allows to tune the relative contribution of certain atoms to the spectral function and allows to improve comparison with experiments since the contribution of the photoelectrons can depend on which layer is closest to the beam. We neglect photon polarization effects that can alter the momentum distribution anisotropy Hwang et al. (2011); Ismail-Beigi et al. (2001). From a computational perspective, the implementation follows closely the scheme of the exact diagonolization band structure calculation. In a first step, one defines the k-point grid in the reference graphene system to be used for the projection. We then use this grid to obtain the corresponding k-points in the moire BZ. We then calculate Eq. (31) where the parallelization is performed over the pairs. In our implementation, we can rather easily calculate the spectral function of systems containing tens of thousands of atoms within a couple of hours on a node containing 20 cores and 128GB in memory.
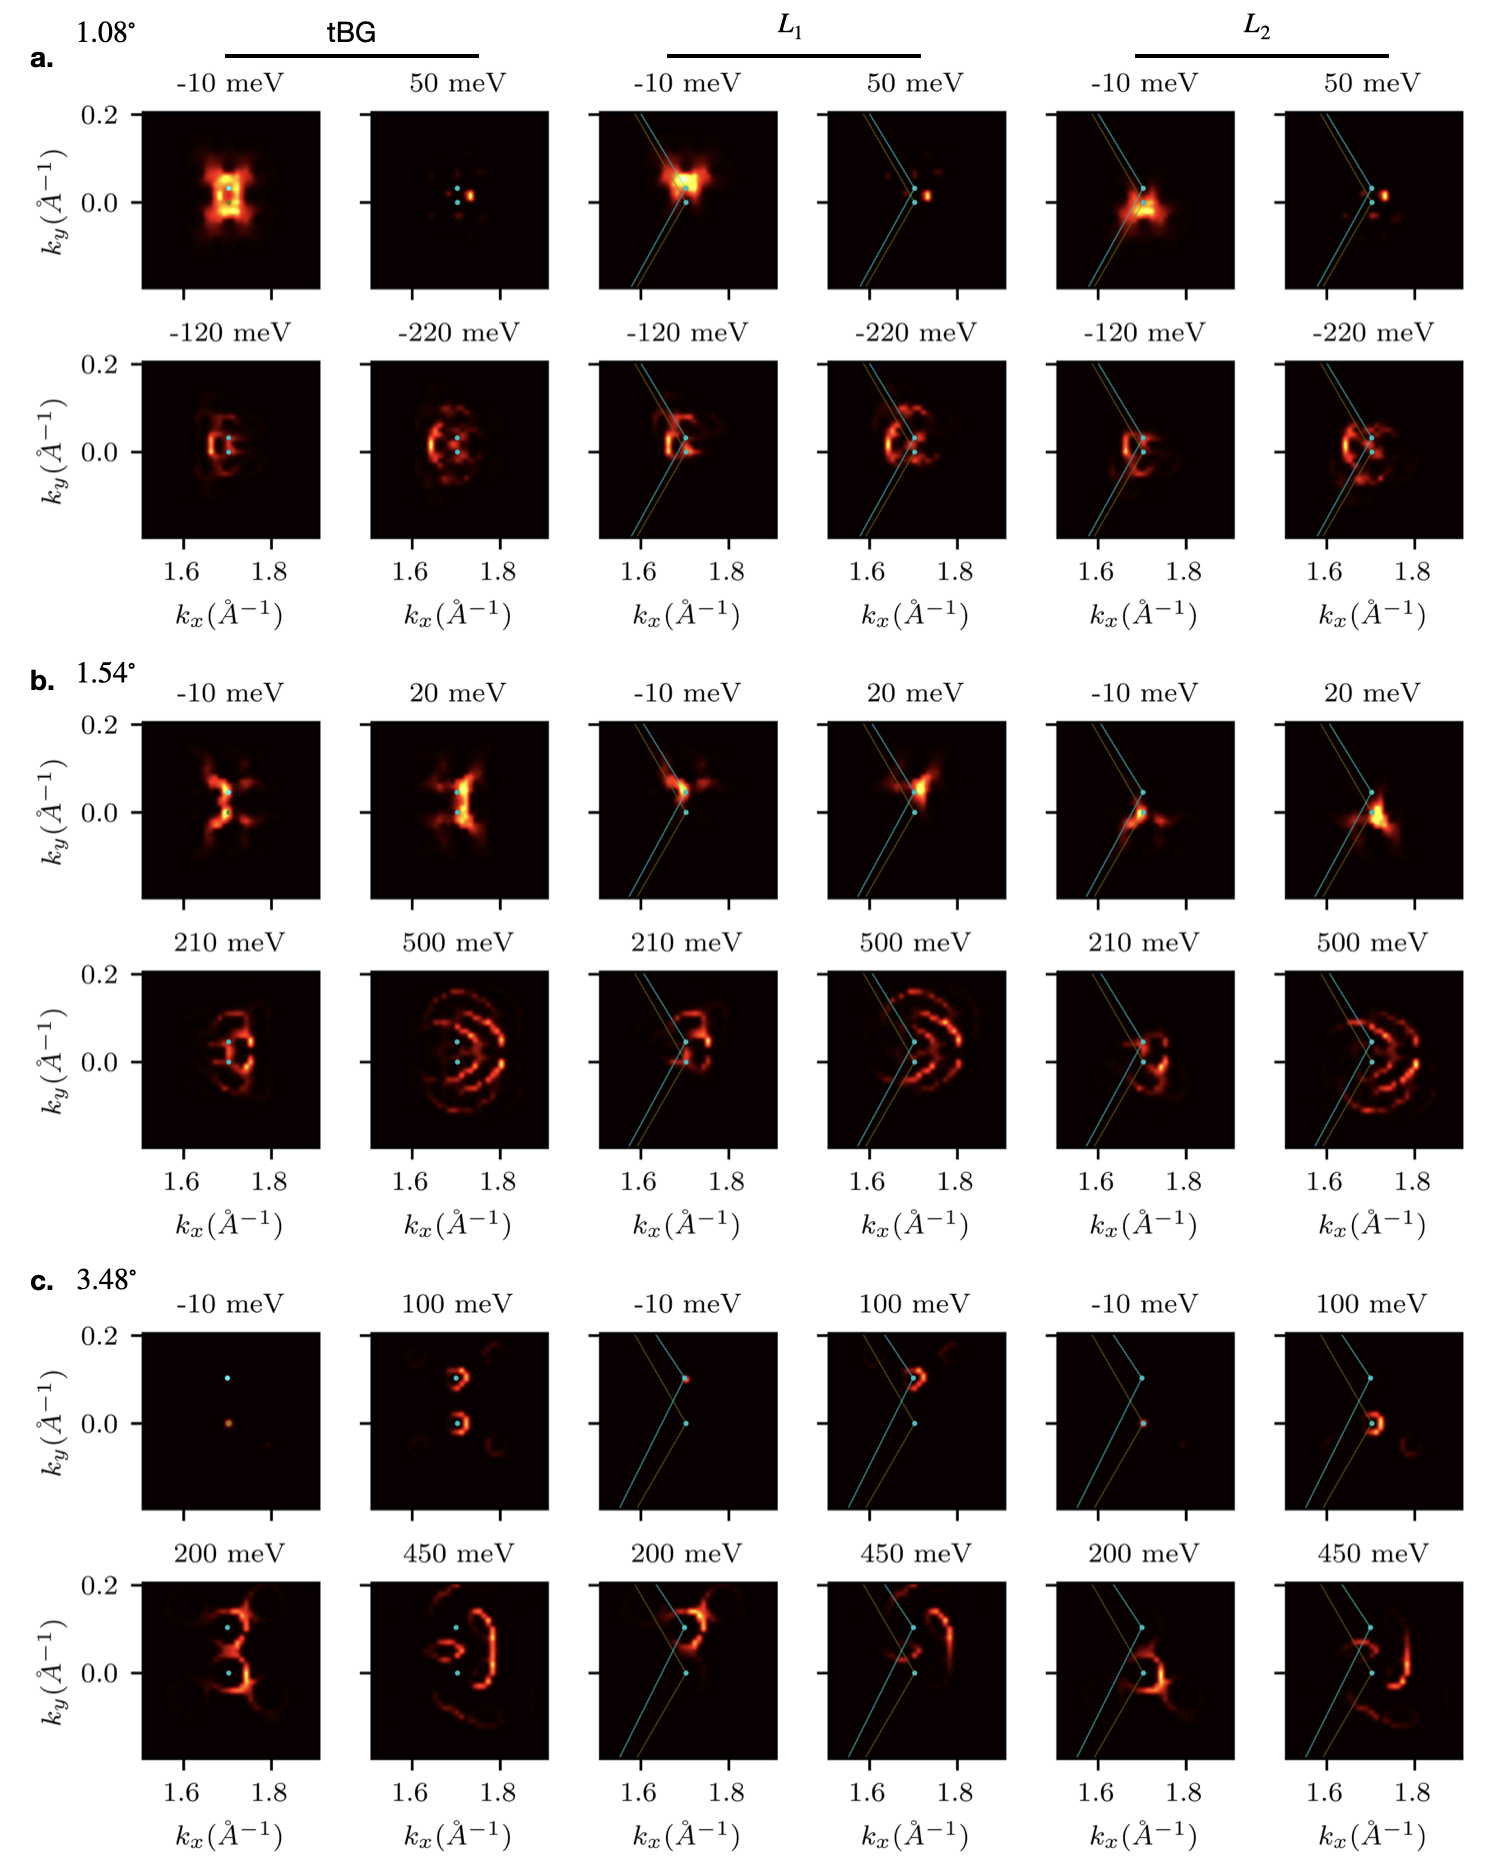
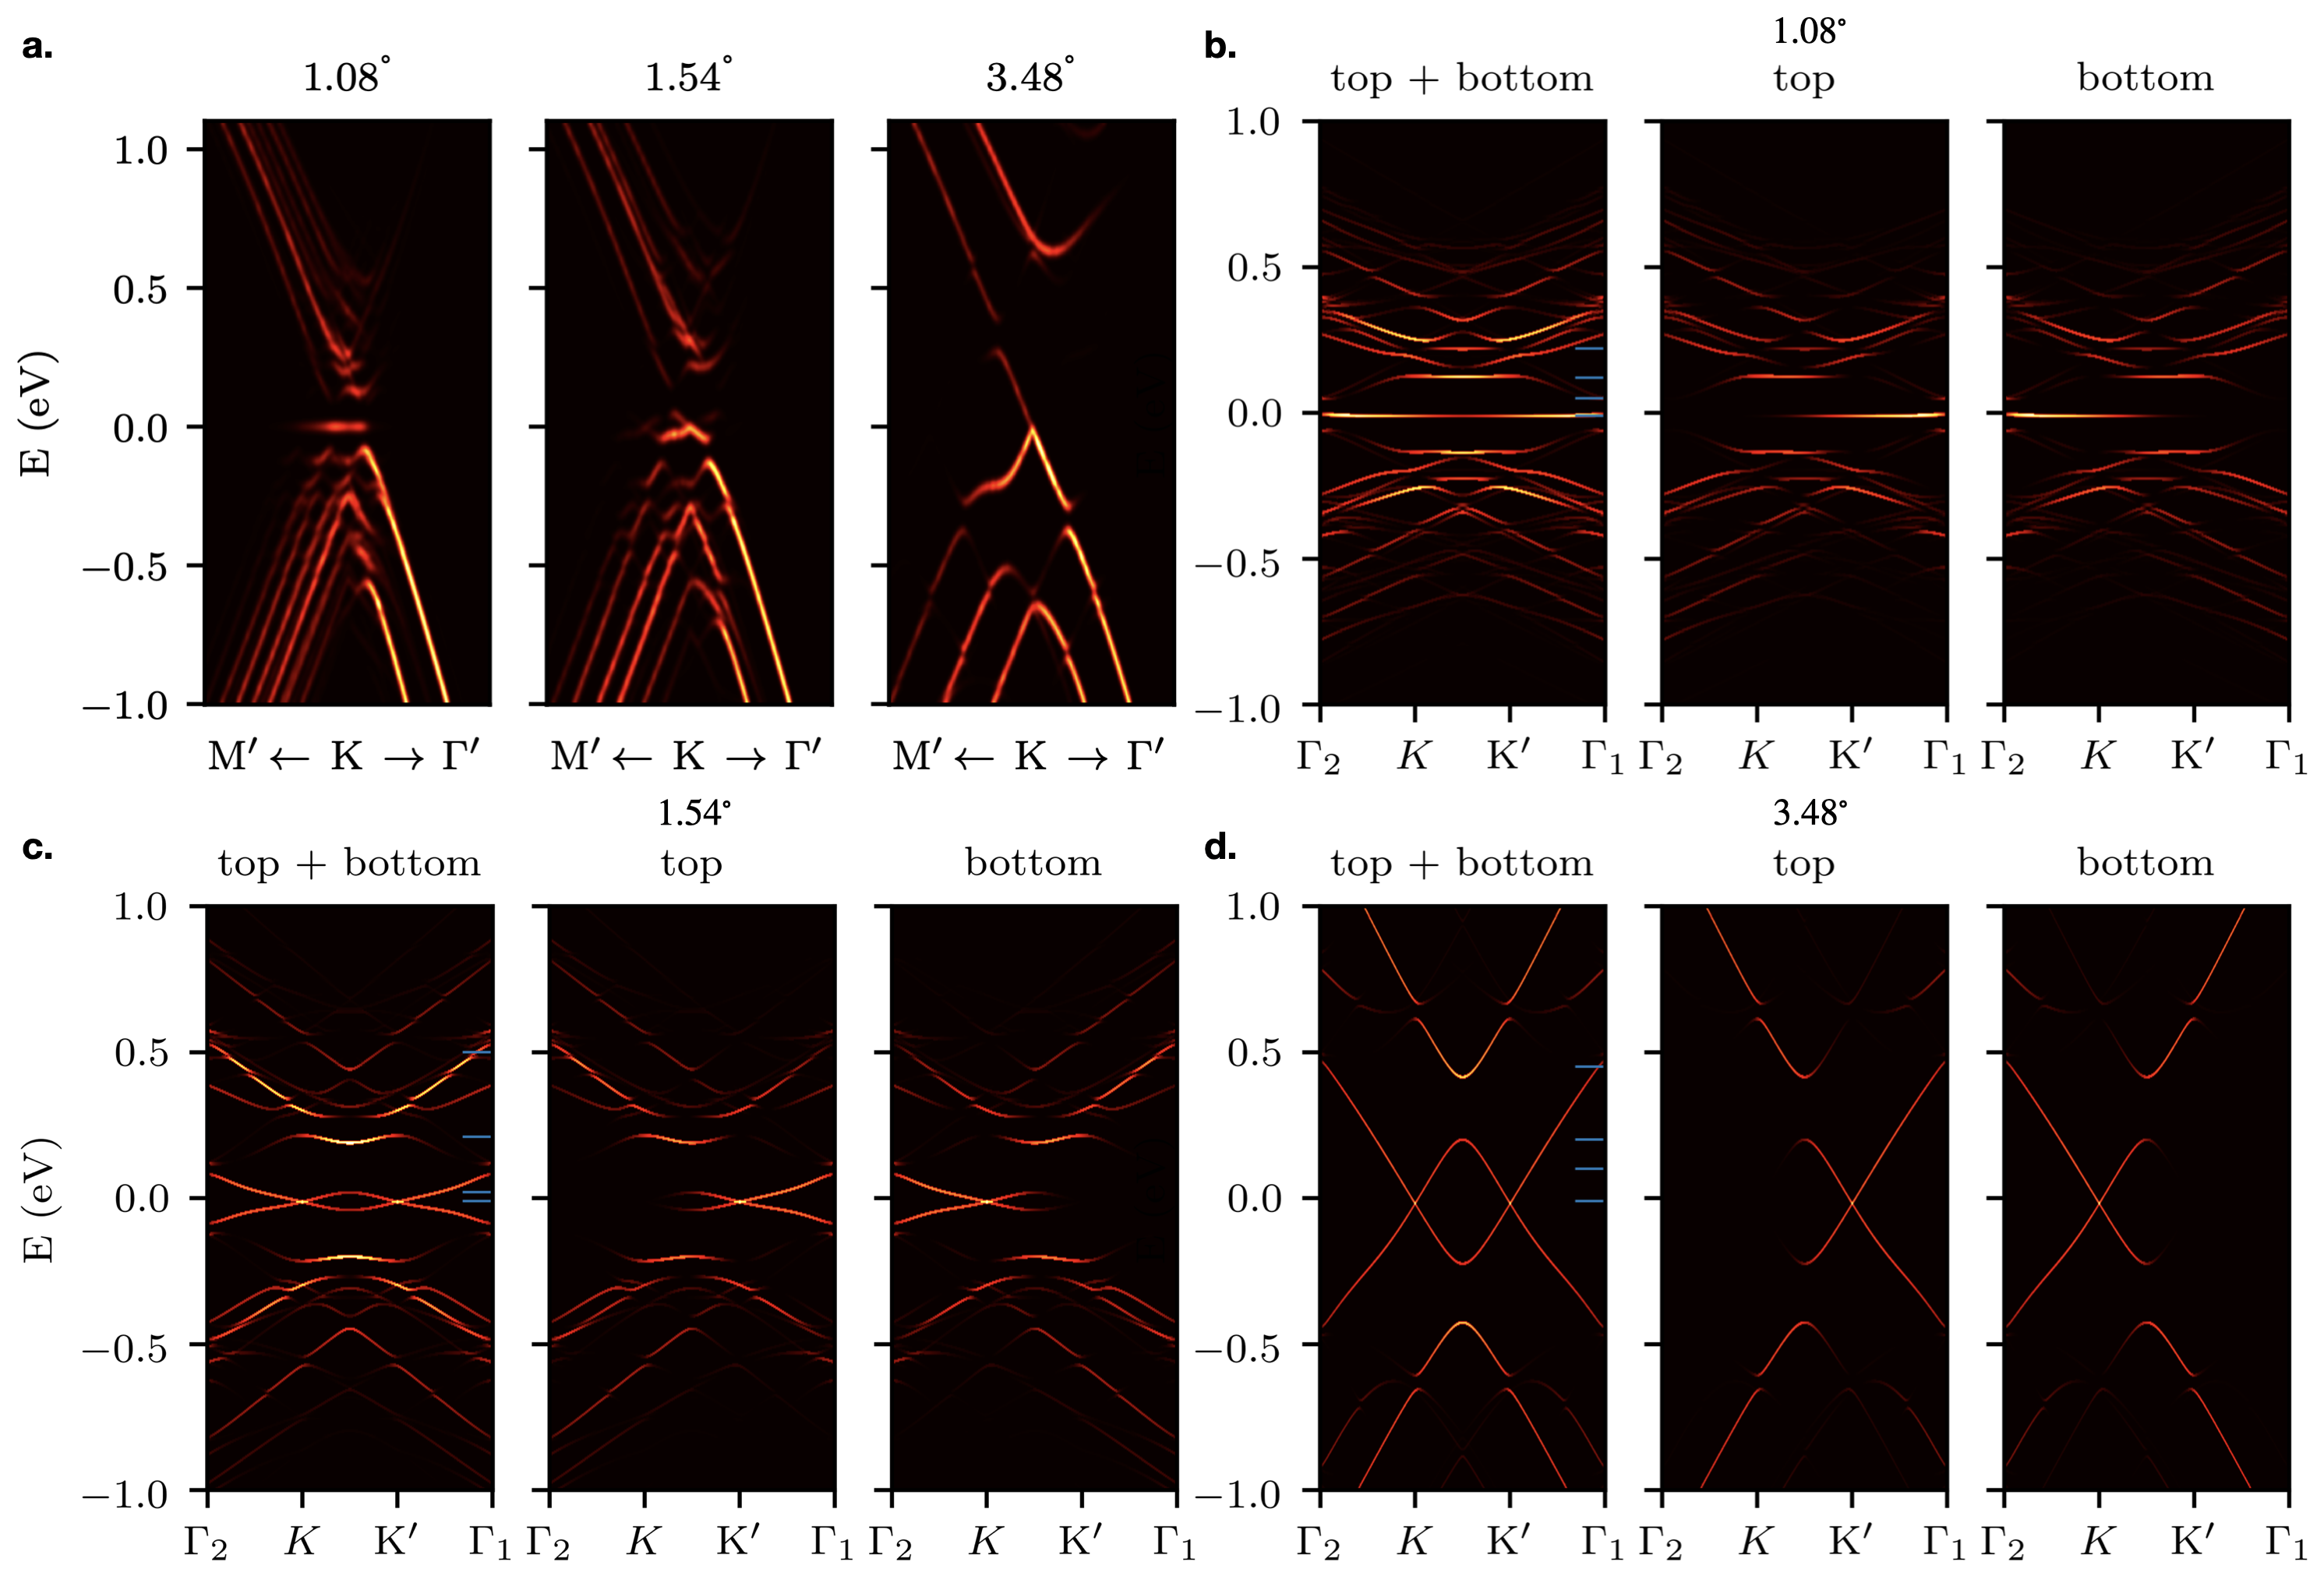
In Fig. 10a., we illustrate the resulting spectral functions in Eq. (31) by projecting in a bottom layer sublattice for a large (, right panel) an intermediate (, right panel) and the magic angle flat band (, left panel) using the SHE model. This type of representation illustrates how the cone from pristine graphene is perturbed by the presence of another graphene layer on top of it. Near the magic angle, we observe the appearance of flat band states that are isolated from the rest of the spectrum while for larger twist angles, the spectral functions become progressively similar to those of two decoupled graphene layers as suggested by the results in the literature. The features for twist angle calculation are qualitatively similar to the features reported for in Ref. Nishi et al. (2017). For the chosen path here centred around the K-point (points on the left and the right are at equivalent distance away from K), we notice a clear asymmetry. Such dark corridor anisotropies in graphene have been linked to the interference between two honeycomb sublattices Gierz et al. (2011); Ulstrup et al. (2015); Mucha-Kruczyński et al. (2016, 2008); Shirley et al. (1995); Puschnig and Lüftner (2015); Bostwick et al. (2007); Hwang et al. (2011). Additionally, the presence of interlayer coupling distorts the circular shape that would appear for decoupled graphene layers Zhu et al. (2021). Because strain relaxation are present in our simulations, the interlayer tunneling amplitude between orbitals on the same sublattice becomes smaller than the one between orbitals on different sublattices. This in turn has been shown to strongly affect the spectral signatures, even for states that are far away from the flat band Zhu et al. (2021).
In order to understand the contributions that come from the top and bottom layer, we provide for each of the three angles, a line cut through the and points in panels b., c. and d. as well as constant energy cuts corresponding to the short horizontal blue lines in Fig. E.2 in the appendix. The tBG signatures in the left panel is the combination of the bottom and top layer contributions which reside preferentially on the K and K′ cones, respectively. Depending on the experimental conditions, one can expect the top layer contributions to appear more clearly in the measurements Utama et al. .
VI Conclusion
We have investigated the interplay between atomic relaxation and electronic structure in twisted bilayer graphene (tBG) by combining different molecular dynamics (MD) force-fields and tight binding (TB) models. Because different tight-binding and force-field model combinations predict a wide range for simulated first magic angles, we provide a table with coupling strength renormalization pre-factors that match the magic angle at a chosen experimental value of 1.08∘ for a tight binding model with a Fermi velocity of m/s that is almost 30% larger than the commonly used two center tight-binding models in the literature.
For the atomic structure modeling part we have provided new parametrizations of a well-established registry-dependent molecular dynamics force fields using the highest level of DFT data available (EXX-RPA) and compared it with existing force fields and associated parameter-sets. We also provide an LDA-parametrized force field for reference purposes. We proposed a way to identify the different local stacking regions through hexagon tessellation of AA, AB, BA stacking regions separated by domain wall regions whose width we set to .
The EXX-RPA gives similar energy differences between high symmetry stacking configurations but predicts a smaller overall interlayer difference. This smaller distance leads to a stronger coupling through the distance-dependent tight-binding models, including our improved distance-dependent model parametrization which accurately reproduces LDA commensurate band structures at different interlayer distances. We notice that the LDA-inferred force fields in combination with our LDA-fitted tight-binding model also matches quite well the experimental flat bands at around . Computationally efficient reactive bond order (REBO) type of force fields tend to underestimate the elastic stiffness of graphene layers overestimating the moire strain profiles. Albeit being computationally more expensive than most existing readily available empirical potentials, the machine-learning potential turns out to provide a good compromise on accuracy and speed when compared to the ab initio molecular dynamics potentials, while the semi-empirical LCBOPII potential Los et al. (2005) that matches well the DFT elastic properties might be a good way to simulate very large marginally twisted tBG systems.
For the electronic structure part we have used an intralayer graphene model with up to five nearest neighbor hopping parameters for an improved description of the single layer Hamiltonian using an enhanced Fermi velocity of m/s. The interlayer tunneling was based on a two center approximation to match the ab initio DFT calculation data at the Dirac points. We then used a global prefactor to modify the interlayer tunneling in what we call the scaled two center (STC) approximation. Additionally, we refined the tunneling term with an exponential interlayer distance dependent rescaling term that we named as the scaled hybrid exponential (SHE) approximation aimed at capturing better the layer corrugation effects. This type of prefactor calibration is useful for compensating the mismatches of the atomic and electronic structure models. In fact, the interlayer tunneling of the electronic structure barely required the prefactor calibration when we used stiffer intralayer force fields in combination with exact exchange and random phase approximation (EXX-RPA) interlayer potentials to obtain a magic angle value close to experiments. Adjusting the scaling prefactor is also a useful procedure for obtaining the electronic structure of an effective tBG twist angle based on a geometry those actual simulation angle is different. It is convenient for example when we need to represent the superlattice bands in the moire Brillouin zone containing a smaller number of atoms. We have also shown that a hexagonal boron nitride (BN) substrate that makes a large twist angle with the contacting graphene layer introduces small lattice distortions in tBG that introduces changes on the order of a few meV in the band structure.
Depending on the specific choice of lattice relaxation and electronic structure models we observe quantitative differences in the electronic structure near the magic angle like the electron-hole asymmetry of the DOS peaks and the way the low energy bandwidths evolve. We noted that peaked density of states associated with the low energy nearly flat bands can be maintained within a twist angle range of 0.05∘ around the calibrated magic angle.
In summary, we have taken one step forward towards a systematical improvement in the description of the atomic and electronic structure of twisted bilayer graphene. We expect that a similar approach can be applied to other layered materials by simultaneously controlling the precision of the molecular dynamics force fields and tailoring the tight-binding electronic structure model to reproduce certain well established experimental results or reliable calculation data.
Acknowledgements.
We gratefully acknowledge discussions with M. Wen, M. Naik, I. Maity and M. Jain on the molecular dynamics based optimization procedures of the moire strain profiles, and M. I. B. Utama on the analysis of the spectral functions. We thank B. L. Chittari for sharing Born-von Karman relaxation data with us. N. L. was supported by the Korean National Research Foundation grant NRF-2020R1A2C3009142 and S. J. by grant NRF-2020R1A5A1016518. J. A. was supported by the Korean Ministry of Land, Infrastructure and Transport(MOLIT) from the Innovative Talent Education Program for Smart Cities. J. J. and A. S. were supported by the Samsung Science and Technology Foundation under project SSTF-BAA1802-06. We acknowledge computational support from KISTI through grant KSC-2021-CRE-0389, the resources of Urban Big data and AI Institute (UBAI) at the University of Seoul and the network support from KREONET.References
- Cao et al. (2018) Y. Cao, V. Fatemi, A. Demir, S. Fang, S. L. Tomarken, J. Y. Luo, J. D. Sanchez-Yamagishi, K. Watanabe, T. Taniguchi, E. Kaxiras, R. C. Ashoori, and P. Jarillo-Herrero, Nature 556, 80 (2018).
- Bistritzer and MacDonald (2011) R. Bistritzer and A. H. MacDonald, 108, 12233 12237 (2011).
- Santos et al. (2007) J. M. B. L. d. Santos, N. M. R. Peres, and A. H. C. Neto, Physical Review Letters 99, 256802 (2007).
- Yankowitz et al. (2019) M. Yankowitz, S. Chen, H. Polshyn, Y. Zhang, K. Watanabe, T. Taniguchi, D. Graf, A. F. Young, and C. R. Dean, Science 363, 1059 (2019).
- Kerelsky et al. (2019) A. Kerelsky, L. J. McGilly, D. M. Kennes, L. Xian, M. Yankowitz, S. Chen, K. Watanabe, T. Taniguchi, J. Hone, C. Dean, A. Rubio, and A. N. Pasupathy, Nature 572, 95 (2019).
- Choi et al. (2019) Y. Choi, J. Kemmer, Y. Peng, A. Thomson, H. Arora, R. Polski, Y. Zhang, H. Ren, J. Alicea, G. Refael, F. von Oppen, K. Watanabe, T. Taniguchi, and S. Nadj-Perge, Nature Physics 15, 1174 (2019).
- Laissardiére et al. (2012) G. T. d. Laissardiére, D. Mayou, and L. Magaud, Physical Review B 86, 125413 (2012).
- Morell et al. (2010) E. S. Morell, J. D. Correa, P. Vargas, M. Pacheco, and Z. Barticevic, Physical Review B 82, 121407 (2010).
- Nam and Koshino (2017) N. N. T. Nam and M. Koshino, Physical Review B 96, 075311 (2017).
- Uchida et al. (2014) K. Uchida, S. Furuya, J.-I. Iwata, and A. Oshiyama, Physical Review B 90, 155451 (2014).
- Angeli et al. (2018) M. Angeli, D. Mandelli, A. Valli, A. Amaricci, M. Capone, E. Tosatti, and M. Fabrizio, Physical Review B 98, 235137 (2018).
- Guinea and Walet (2019) F. Guinea and N. R. Walet, Physical Review B 99, 205134 (2019).
- (13) C. R. Woods, L. Britnell, A. Eckmann, R. S. Ma, J. C. Lu, H. M. Guo, X. Lin, G. L. Yu, Y. Cao, R. V. Gorbachev, A. V. Kretinin, J. Park, L. A. Ponomarenko, M. I. Katsnelson, Y. N. Gornostyrev, K. Watanabe, T. Taniguchi, C. Casiraghi, H.-J. Gao, A. K. Geim, and K. S. Novoselov, Nat. Phys. 10, 451 456.
- Jung et al. (2015) J. Jung, A. M. DaSilva, A. H. MacDonald, and S. Adam, Nature Communications 6, 1 (2015).
- van Wijk et al. (2015) M. M. van Wijk, A. Schuring, M. I. Katsnelson, and A. Fasolino, 2D Materials 2, 034010 (2015).
- Jain et al. (2016) S. K. Jain, J. Vladimir, and G. T. Barkema, 2D Materials 4, 015018 (2016).
- Lucignano et al. (2019) P. Lucignano, D. Alfe, V. Cataudella, D. Ninno, and G. Cantele, Physical Review B 99, 195419 (2019).
- Zhang and Tadmor (2018) K. Zhang and E. B. Tadmor, Journal of the Mechanics and Physics of Solids 112, 225 (2018).
- Dai et al. (2016) S. Dai, Y. Xiang, and D. J. Srolovitz, Nano Letters 16, 5923 (2016).
- Carr et al. (2018) S. Carr, D. Massatt, S. B. Torrisi, P. Cazeaux, M. Luskin, and E. Kaxiras, Physical Review B 98, 224102 (2018).
- Carr et al. (2019) S. Carr, S. Fang, Z. Zhu, and E. Kaxiras, Physical Review Research 1, 013001 (2019).
- Walet and Guinea (2019) N. R. Walet and F. Guinea, 2D Materials 7, 015023 (2019).
- Koshino et al. (2018) M. Koshino, N. F. Q. Yuan, T. Koretsune, M. Ochi, K. Kuroki, and L. Fu, Phys. Rev. X 8, 031087 (2018).
- Fang and Kaxiras (2016) S. Fang and E. Kaxiras, Physical Review B 93, 235153 (2016).
- Kolmogorov and Crespi (2005) A. N. Kolmogorov and V. H. Crespi, Physical Review B 71, 235415 (2005).
- Gargiulo and Yazyev (2017) F. Gargiulo and O. V. Yazyev, 2D Materials 5, 015019 (2017).
- van Wijk et al. (2014) M. van Wijk, A. Schuring, M. Katsnelson, and A. Fasolino, Physical Review Letters 113, 135504 (2014).
- Wen et al. (2018a) M. Wen, S. Carr, S. Fang, E. Kaxiras, and E. B. Tadmor, Phys. Rev. B 98, 235404 (2018a).
- Sabatini et al. (2013) R. Sabatini, T. Gorni, and S. de Gironcoli, Phys. Rev. B 87, 041108 (2013).
- Wen et al. (2018b) M. Wen, S. Carr, S. Fang, E. Kaxiras, and E. B. Tadmor, Physical Review B 98, 235404 (2018b).
- Leconte et al. (2017) N. Leconte, J. Jung, S. Lebègue, and T. Gould, Phys. Rev. B 96, 195431 (2017).
- Jung and MacDonald (2013) J. Jung and A. H. MacDonald, Physical Review B 87, 195450 (2013).
- Jung et al. (2014) J. Jung, A. Raoux, Z. Qiao, and A. H. MacDonald, Phys. Rev. B 89, 205414 (2014).
- Thompson et al. (2022) A. P. Thompson, H. M. Aktulga, R. Berger, D. S. Bolintineanu, W. M. Brown, P. S. Crozier, P. J. in ’t Veld, A. Kohlmeyer, S. G. Moore, T. D. Nguyen, R. Shan, M. J. Stevens, J. Tranchida, C. Trott, and S. J. Plimpton, Comp. Phys. Comm. 271, 108171 (2022).
- Plimpton (1995) S. Plimpton, Journal of Computational Physics 117, 1 (1995).
- Hermann (2012) K. Hermann, Journal of Physics: Condensed Matter 24, 314210 (2012).
- Shallcross et al. (2010) S. Shallcross, S. Sharma, E. Kandelaki, and O. A. Pankratov, Phys. Rev. B 81, 165105 (2010).
- Leconte and Jung (2020) N. Leconte and J. Jung, 2D Materials 7, 031005 (2020).
- Rode et al. (2017) J. C. Rode, D. Smirnov, C. Belke, H. Schmidt, and R. J. Haug, Annalen der Physik 529, 1700025 (2017), https://onlinelibrary.wiley.com/doi/pdf/10.1002/andp.201700025 .
- Mele (2010) E. J. Mele, Phys. Rev. B 81, 161405 (2010).
- (41) “KIM-based Learning-Integrated Fitting Framework (KLIFF),” https://kliff.readthedocs.io, accessed: 2019-07-15.
- Naik et al. (2019) M. H. Naik, I. Maity, P. K. Maiti, and M. Jain, The Journal of Physical Chemistry C 123, 9770 (2019).
- Naik et al. (2020) M. H. Naik, S. Kundu, I. Maity, and M. Jain, Phys. Rev. B 102, 075413 (2020).
- Duin et al. (2001) A. C. T. v. Duin, S. Dasgupta, F. Lorant, and W. A. Goddard, The Journal of Physical Chemistry A 105, 9396 (2001).
- Maaravi et al. (2017) T. Maaravi, I. Leven, I. Azuri, L. Kronik, and O. Hod, The Journal of Physical Chemistry C 121, 22826 (2017).
- Leven et al. (2016) I. Leven, T. Maaravi, I. Azuri, L. Kronik, and O. Hod, Journal of Chemical Theory and Computation 12, 2896 (2016).
- Note (1) In LAMMPS the full implementation without simplifications on the normals must be used to avoid spurious corrugations. We further used the local https://github.com/sgsaenger/LAMMPS/tree/rdip branch to avoid a (now corrected) bug existing in the KC full implementation existing at the time of writing.
- Tkatchenko et al. (2012) A. Tkatchenko, R. A. DiStasio, R. Car, and M. Scheffler, Phys. Rev. Lett. 108, 236402 (2012).
- Brenner et al. (2002) D. W. Brenner, O. A. Shenderova, J. A. Harrison, S. J. Stuart, B. Ni, and S. B. Sinnott, Journal of Physics: Condensed Matter 14, 783 (2002).
- Los et al. (2017) J. H. Los, J. M. H. Kroes, K. Albe, R. M. Gordillo, M. I. Katsnelson, and A. Fasolino, Phys. Rev. B 96, 184108 (2017).
- Tersoff (1988) J. Tersoff, Phys. Rev. B 37, 6991 (1988).
- Rowe et al. (2020) P. Rowe, V. L. Deringer, P. Gasparotto, G. Csányi, and A. Michaelides, The Journal of Chemical Physics 153, 034702 (2020).
- Lindsay and Broido (2010) L. Lindsay and D. A. Broido, Phys. Rev. B 81, 205441 (2010).
- Thomas et al. (2018) S. Thomas, K. Ajith, S. U. Lee, and M. C. Valsakumar, RSC Adv. 8, 27283 (2018).
- (55) “Calculate elastic constants,” https://docs.lammps.org/Howto_elastic.html, accessed: 2022-02-24.
- jian Wu et al. (2007) Z. jian Wu, E. jun Zhao, H. ping Xiang, X. feng Hao, X. juan Liu, and J. Meng, Physical Review B 76 (2007).
- Zakharchenko et al. (2009) K. V. Zakharchenko, M. I. Katsnelson, and A. Fasolino, Phys. Rev. Lett. 102, 046808 (2009).
- Kudin et al. (2001) K. N. Kudin, G. E. Scuseria, and B. I. Yakobson, Physical Review B 64 (2001).
- Wei et al. (2009) X. Wei, B. Fragneaud, C. A. Marianetti, and J. W. Kysar, Phys. Rev. B 80, 205407 (2009).
- Sachs et al. (2011) B. Sachs, T. O. Wehling, M. I. Katsnelson, and A. I. Lichtenstein, Physical Review B 84, 195414 (2011).
- Peng et al. (2012) Q. Peng, W. Ji, and S. De, Computational Materials Science 56, 11 (2012).
- Song et al. (2010) L. Song, L. Ci, H. Lu, P. B. Sorokin, C. Jin, J. Ni, A. G. Kvashnin, D. G. Kvashnin, J. Lou, B. I. Yakobson, and P. M. Ajayan, Nano Letters 10, 3209 (2010).
- Akinwande et al. (2017) D. Akinwande, C. J. Brennan, J. S. Bunch, P. Egberts, J. R. Felts, H. Gao, R. Huang, J.-S. Kim, T. Li, Y. Li, K. M. Liechti, N. Lu, H. S. Park, E. J. Reed, P. Wang, B. I. Yakobson, T. Zhang, Y.-W. Zhang, Y. Zhou, and Y. Zhu, Extreme Mechanics Letters 13, 42 (2017).
- Kazmierczak et al. (2021) N. P. Kazmierczak, M. V. Winkle, C. Ophus, K. C. Bustillo, S. Carr, H. G. Brown, J. Ciston, T. Taniguchi, K. Watanabe, and D. K. Bediako, Nature Materials 20, 956 (2021).
- Slater and Koster (1954) J. C. Slater and G. F. Koster, Phys. Rev. 94, 1498 (1954).
- Koshino (2019) M. Koshino, Physical Review B 99, 235406 (2019).
- Andelković et al. (2020) M. Andelković, S. P. Milovanović, L. Covaci, and F. M. Peeters, Nano Letters 20, 979 (2020).
- Jung and MacDonald (2014) J. Jung and A. H. MacDonald, Physical Review B 89, 035405 (2014).
- Pereira et al. (2009) V. Pereira, A. C. Neto, and N. Peres, Physical Review B 80, 045401 (2009).
- Chittari et al. (2018) B. L. Chittari, N. Leconte, S. Javvaji, and J. Jung, Electronic Structure 1, 015001 (2018).
- Zhu et al. (2021) J. Zhu, J. Shi, and A. H. MacDonald, Phys. Rev. B 103, 235146 (2021).
- Fan et al. (2021) Z. Fan, J. H. Garcia, A. W. Cummings, J. E. Barrios-Vargas, M. Panhans, A. Harju, F. Ortmann, and S. Roche, Physics Reports 903, 1 (2021), linear scaling quantum transport methodologies.
- Ku et al. (2010) W. Ku, T. Berlijn, and C.-C. Lee, Phys. Rev. Lett. 104, 216401 (2010).
- Nishi et al. (2017) H. Nishi, Y. ichiro Matsushita, and A. Oshiyama, Physical Review B 95, 085420 (2017).
- Matsushita et al. (2018) Y.-i. Matsushita, H. Nishi, J.-i. Iwata, T. Kosugi, and A. Oshiyama, Physical Review Materials 2, 010801 (2018).
- Amorim (2018) B. Amorim, Phys. Rev. B 97, 165414 (2018).
- Mucha-Kruczynski et al. (2015) M. Mucha-Kruczynski, J. R. Wallbank, and V. I. Fal’ko, (2015).
- Amorim and Castro (2018) B. Amorim and E. V. Castro, (2018).
- Hwang et al. (2011) C. Hwang, C.-H. Park, D. A. Siegel, A. V. Fedorov, S. G. Louie, and A. Lanzara, Phys. Rev. B 84, 125422 (2011).
- Ismail-Beigi et al. (2001) S. Ismail-Beigi, E. K. Chang, and S. G. Louie, Phys. Rev. Lett. 87, 087402 (2001).
- Gierz et al. (2011) I. Gierz, J. Henk, H. Höchst, C. R. Ast, and K. Kern, Phys. Rev. B 83, 121408 (2011).
- Ulstrup et al. (2015) S. Ulstrup, J. C. Johannsen, A. Crepaldi, F. Cilento, M. Zacchigna, C. Cacho, R. T. Chapman, E. Springate, F. Fromm, C. Raidel, T. Seyller, F. Parmigiani, M. Grioni, and P. Hofmann, Journal of Physics: Condensed Matter 27, 164206 (2015).
- Mucha-Kruczyński et al. (2016) M. Mucha-Kruczyński, J. R. Wallbank, and V. I. Fal’ko, Phys. Rev. B 93, 085409 (2016).
- Mucha-Kruczyński et al. (2008) M. Mucha-Kruczyński, O. Tsyplyatyev, A. Grishin, E. McCann, V. I. Fal’ko, A. Bostwick, and E. Rotenberg, Phys. Rev. B 77, 195403 (2008).
- Shirley et al. (1995) E. L. Shirley, L. J. Terminello, A. Santoni, and F. J. Himpsel, Phys. Rev. B 51, 13614 (1995).
- Puschnig and Lüftner (2015) P. Puschnig and D. Lüftner, Journal of Electron Spectroscopy and Related Phenomena 200, 193 (2015), special Anniversary Issue: Volume 200.
- Bostwick et al. (2007) A. Bostwick, T. Ohta, J. L. McChesney, K. V. Emtsev, T. Seyller, K. Horn, and E. Rotenberg, New Journal of Physics 9, 385 (2007).
- (88) M. I. B. Utama, R. J. Koch, K. Lee, N. Leconte, H. Li, S. Zhao, L. Jiang, J. Zhu, K. Watanabe, T. Taniguchi, P. D. Ashby, A. Weber-Bargioni, A. Zettl, C. Jozwiak, J. Jung, E. Rotenberg, A. Bostwick, and F. Wang, .
- Los et al. (2005) J. H. Los, L. M. Ghiringhelli, E. J. Meijer, and A. Fasolino, Phys. Rev. B 72, 214102 (2005).
Appendix A Rigid lattice tBG W-shaped bandwidths
As mentioned in the main text, the rigid geometry exhibits a W-shape, instead of a clear V-shape for the relaxed geometries, when studying the flat-band width with respect to the twist angle. This can be more easily illustrated by plotting this same width, but varying it with respect to the renormalization constant . Within a range of about , the width is similarly small. We can then use Eq. (27) to estimate that this range corresponds to a range of about , thus showing a relatively large uncertainty on the magic angle value calibration for this rigid system. This W-shape uncertainty in the band width disappears mostly for relaxed systems, however, in those cases the fine features in the DOS calculated with small broadening lead to a wider range of possible magic angles as discussed in Sect. IV.2.

Appendix B DRIP-potential parametrization for G-G, G-BN and BN-BN layered materials
The cutoff function preceding the DRIP pair-wise potential expression, mentioned in the main-text, is defined as
| (32) |
where the cut-off function from Eq. 32 with the scaled pair distance leading to smooth behavior at the Å cut-off value when used in from of the pair-wise potential in the main-text. We remind here also the expressions of the transverse distance function Kolmogorov and Crespi (2005) and the dihedral angle function Wen et al. (2018b) used in Eq. 11 for which the new fitting parameters are given in Table 2:
| (33) |
with
| (34) |
and
| (35) |
where the vector connecting atoms and is given by and the normals to the surface at atom are calculated at each molecular dynamics step (an early implementation of the KC potential simplified this normal parallel to but our preliminary tests showed this to lead some unphysical corrugation at zero temperature). The dihedral function in turn is given by
| (36) |
where the cut-off is set with Å as these 4-body dihedral angle interactions are computationally expensive to calculate. is given by
| (37) |
a product of the three cosines of the dihedral angles formed by atom (in one layer), its mth nearest-neighbor , atom (in the other layer), and its three nearest-neighbors , and .
Appendix C Electronic band structures
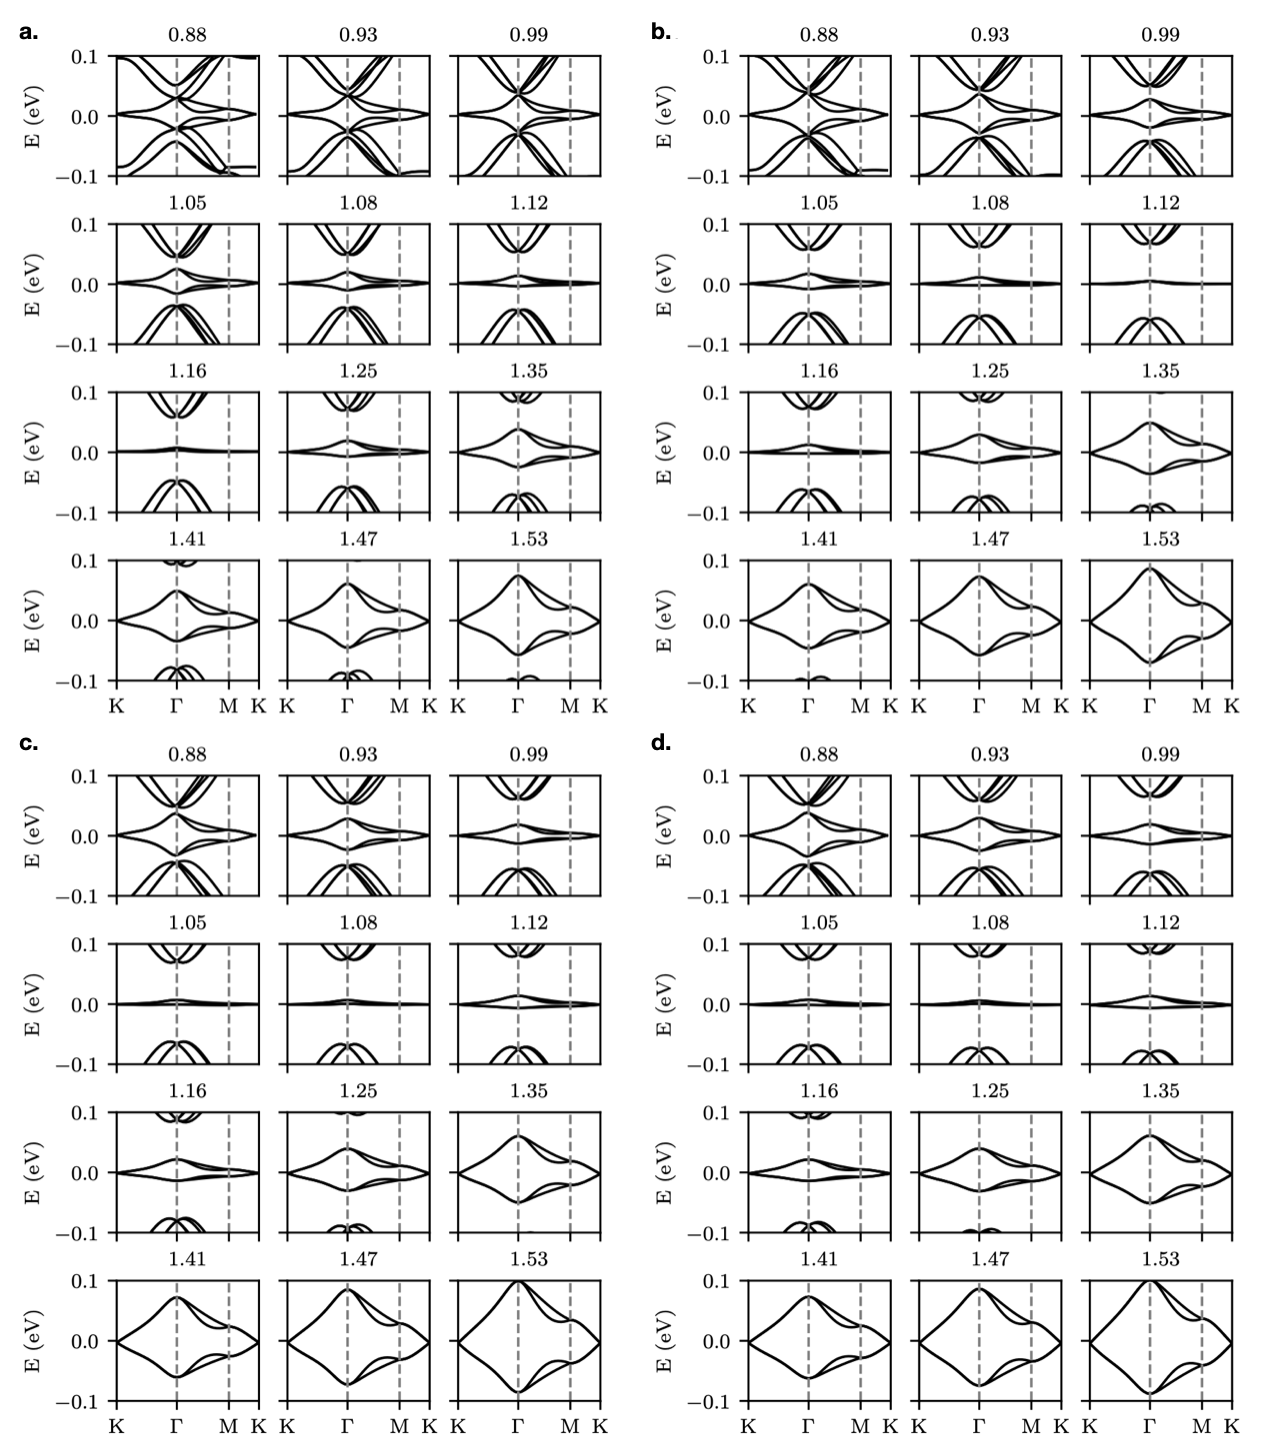
In Fig. C.1, we compare the band-structures using the Hybrid exponential (HE) TB model without prefactor scaling, i.e. the SHE model with in Eq. (21) with the band structures using our SHE model where with its values given in Table 4. Panels a. and b. show that the flattest band is different using the RPA or LDA relaxation schemes, for angles at and respectively. This shows that the LDA almost does not need to renormalize the prefactor to match the magic angle to the experimental value. When we calibrate in panels c. and d. to give the experimental magic angle we observe very similar band structures using either of the relaxation schemes. These figures also illustrate how the band-isolation disappears for smaller angles. Well-resolved higher order magic angles will thus be more difficult to define clearly, in agreement with the results reported in the literature Carr et al. (2018).
Appendix D Scaling prefactors in a simplified tight-binding model without strain corrections
Appendix E Spectral functions energy cuts
Here we provide additional ARPES simulations to facilitate comparison with experimental energy-cuts of the spectral functions reported in Sect. V. We chose select energy values for the cuts that are different for each angle as indicated by small blue lines in Fig. 10. The first two rows correspond to the magic angle system at , while the middle two rows and last two rows represent and , respectively. We separate the plots into three main columns, namely the sum of top+bottom layers, and separate the top and bottom layer contributions. Two small dots indicate the K (lower dot) and K′ (upper dot) high-symmetry points as well as the corresponding graphene BZ of the bottom (green) and top (blue) layers. As a general observation, we clearly see that for a same energy, the top+bottom maps are simply the combination of the top and bottom maps. One can fine-tune their respective weight using layer dependent parameters in Eq. (31) to capture the likely fact that experimental features from the top layer are more easily picked up than the features coming from the bottom layer. Here, we can see that most of the weight of the features coming from the bottom layer are centered around the point, and the features coming from the top layer are centered around the K′ point, as can be expected. For the largest twist angle considered, the K and K′ signatures are almost decoupled from each other. We further observe the typical dark corridor anisotropies mentioned in the main text Gierz et al. (2011); Ulstrup et al. (2015); Mucha-Kruczyński et al. (2016, 2008); Shirley et al. (1995); Puschnig and Lüftner (2015); Bostwick et al. (2007); Hwang et al. (2011). For higher energies, we also observe concentric features that have been observed in nano-ARPES experiments Utama et al. .
