Current address: ]Laboratory for Laser Energetics, University of Rochester, Rochester, New York 14627, USA
Pump depletion and hot electron generation in long density scale length plasma with shock ignition high intensity laser
Abstract
Two-dimension Particle-in-cell simulations for laser plasma interaction with laser intensity of , plasma density range of 0.01-0.28 and scale length of showed significant pump depletion of the laser energy due to stimulated Raman scattering (SRS) and stimulated Brillouin scattering (SBS) in the low density region (). The simulations identified hot electrons generated by SRS in the low density region with moderate energy and by two-plasmon-decay (TPD) near with higher energy. The overall hot electron temperature (46 keV) and conversion efficiency (3%) were consistent with the experiment measurements. The simulations also showed artificially reducing SBS would lead to stronger SRS and a softer hot electron spectrum.
pacs:
Valid PACS appear hereShock ignitionBetti et al. (2007); Perkins et al. (2009) (SI) is a laser-driven inertial confinement fusion (ICF) scheme which achieves ignition conditions by using a low intensity () laser pulse for fuel compression followed by a high intensity () pulse. This high intensity pulse drives a strong convergent shock in the dense shell to boost pressure and temperature to achieve ignition. It potentially has much higher energy gain and lower risk of hydro instabilitiesBetti et al. (2007) compared to the conventional center hot spot schemeLindl et al. (2004). The challenge of SI lies in coupling sufficient ignition pulse energy to the target under significant laser plasma instabilities (LPI)Kruer (2003), including stimulated Brillouin scattering (SBS)Liu et al. (1974); Forslund et al. (1975), stimulated Raman scattering (SRS)Rosenbluth (1972); Drake and Lee (1973), two-plasmon decay (TPD)Rosenbluth et al. (1973); Simon et al. (1983) and filamentationCraxton and McCrory (1984). The LPI can scatter the laser light to reduce the coupling efficiency (SBS and SRS), and generate suprathermal (hot) electrons (SRS and TPD) which can either preheat the fuel or enhance the coupling efficiency depending on their energy distributionLlor Aisa et al. (2017). Those hot electrons with energy below 100 keV can significantly boost the shock pressureNora et al. (2015). Recently Shang et al. showed for laser-hot electron conversion efficiency of , ignition can be achieved with 400 kJ compression and 100 kJ ignition pulse energy in what they call electron shock ignition Shang et al. (2017). Measuring and understanding LPI and hot electron generation in SI is criticalKlimo et al. (2011); Weber et al. (2012); Batani et al. (2014); Riconda et al. (2011); Yan et al. (2014); S.Zhang et al. (2018); Hao et al. (2016, 2017); Li et al. (2017).
Existing experiment and simulation results on hot electron generation are somewhat conflicting. The strong spherical shock experiments on OMEGA measured up to 4% with overlapped laser beams smoothed by spectral dispersion (SSD) and 9% without SSD Theobald et al. (2015) for the target density scale length at the quarter-critical surface Theobald et al. (2017), where is the plasma density along the incident laser direction . The instantaneous can be as high as 13-15% Theobald et al. (2015, 2017). PIC simulations with the experimental conditions and the laser incident from plasma density yielded Theobald et al. (2017), where is the critical density of the incident laser. This motivated ignition-scale electron shock ignition design in Shang et al. (2017) with the expectation that would increase in longer scale lengths and stronger SRS. The PIC simulations in Shang et al. (2017) with and laser incident from did show an . On the other hand, the so-called 40+20 experiments on OMEGA using 40 beams for compression and 20 tightly-focused non-overlapping beams as the ignition pulse measured an Theobald et al. (2012); Trela et al. (2018). PIC simulations for this experiment with and laser incident at showed as high as 19%, a clear discrepancy with the experiment. The PIC simulations did not include lower density region, which potentially can cause significant SRS and SBS backscttering. Indeed, 1D PIC Hao et al. (2016) and fluid Hao et al. (2017) simulations showed significant backscattering (of 40-90%, depending on intensity, of the incident laser energy) once the region was included. It is critical to understand the low-density region LPI’s since this region is long in ignition-scale targets.
Recently, a new SI experiment on OMEGA EP using planar targets to achieve long-scale lengths () measured with a hot electron temperature keV S.Zhang et al. (2018). The back scattered SRS light spectra and the 4 probe diagnostic measuring laser front movement indicated strong pump depletion in the region of Zhang et al. (2019). In this letter, we present 2-D, fully relativistic PIC simulations with physical conditions relevant to this experiment. To our knowledge, this was the first planar, multi-ps 2-D PIC simulations of LPI at SI intensity in millimeter long scale plasmas with . Our simulation results show strong pump depletion dominated by SBS, and and keV that were in excellent agreement with the experimental results. The observed hot electron properties were profoundly linked to SBS in the low density region, which can affect the location and saturation level of the most significant SRS modes through pump depletion. This new physics is unique to long scale-length plasmas and SI high intensity laser, for which the SBS seeds in the low density region can be amplified to the pump level and cause significant energy loss. Our results raise the concern of LPI-induced pump depletion in ignition-scale design for SI.
| Index | Density range() | Laser type |
|---|---|---|
| i (Long) | 0.010.28 | plane wave |
| ii (Short) | 0.140.28 | plane wave |
| iii (Speckle) | 0.140.28 | speckle |
Our 2D PIC simulations, with the OSIRIS codeFonseca et al. (2002), are listed in Table I. The initial physical conditions of the simulations were relevant to the OMEGA EP experiment S.Zhang et al. (2018) and obtained from hydro simulations with FLASH codeFryxell et al. (2000). As shown in Fig. 1(a), the plasma density for Simulation i (Long), the main focus of this Letter, ranged from to with for , and for . This density profile had been validated in the experiment. The initial plasma fluid velocity gradient was , where is the laser frequency. The incident plane-wave ultraviolet(UV) laser (wavelength = 0.351) was linearly polarized in the simulation plane with intensity . It was launched at the left boundary of the simulation domain with short rising time of (). The plasma consisted of electrons with temperature keV, Carbon and Hydrogen (CH) ions with temperature keV. The simulation was performed for 10 ps to demonstrate the time evolution and competition of different LPI modes. The simulation domain was () (in longitudinal, ) by ( (in transverse, ) with the grid sizes = = 0.2 (), where is the light speed. The initial numbers of particles per cell were 100 for electrons and 50 for each ion species. The boundary conditions were periodic in direction. In , the boundary conditions were thermal for particles and open for electromagnetic fields.
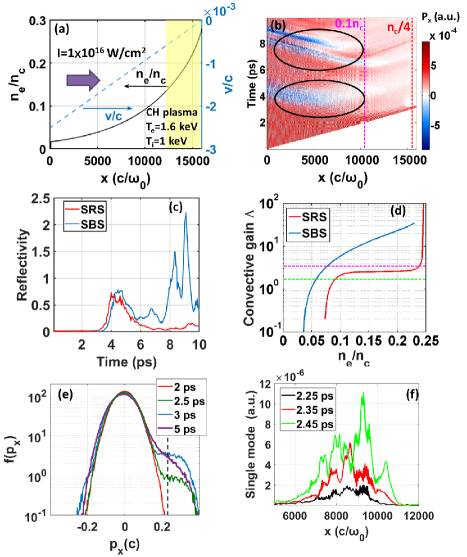
Significant pump depletion of the incident laser was observed from the -averaged Poynting vector -plot [Fig. 1(b)]. Strong negative bursts (blue color in the two black ellipses) correspond to significant back scattered light from SRS and SBS below 0.1. The components of the bursts can be distinguished by the longitudinal wave number of the reflected lights near the left boundary with . Here, the SRS reflected lights had , where is the incident laser wave number in vacuum. By comparison, the reflected lights from SBS had . The SRS and SBS reflectivities are plotted in Fig. 1(c). At , the instantaneous SRS reflectivity () was comparable to SBS in the first burst, but SBS ( on average) strongly suppressed SRS ( on average) after 6 ps.
The strong laser pump depletion was due to the large convective gains of SRS and especially, SBS. In an inhomogeneous plasma, the linear convective gainRosenbluth et al. (1973) describes how much SRS and SBS can grow from an initial -function seed. Here is approximated by , where is the temporal growth rates of SRS or SBS in a homogeneous plasma without any damping, , , and are the group velocities and total damping rates on the two daughter waves. We consider both Landau damping and collisional dampingKruer (2003). The Landau damping only applies to the plasma wave for SRS and ion acoustic wave for SBSVu et al. (1994), and the collisional damping affects both daughter waves for SRS and SBS. The gradient of the wave number mismatch is , where , and are the wave numbers of the pump and two daughter waves. Large () and () lead to large . Since the scattered light intensity ( is the seed intensity), one can reasonably estimate that strong pump depletion occurs when becomes comparable to the incident laser intensity . For the actual (based on the Thomson scattering model Hao et al. (2016); Berger et al. (1989)for SBS), the critical gain above which pump depletion by SBS becomes important was . (The SRS seed level was lower, .)
We plot for SRS and SBS in Fig. 1(d). The results show that SBS gain factor was above for while the gain factor for SRS stayed at . This suggests that SBS, not SRS, can cause significant pump depletion for . Both gains significantly decreased at lower densities due to strong Landau damping. We did observe flattening of the electron velocity distribution [Fig. 1(e)] which can cause decreasing of Landau damping. Neglecting all the damping effects, which was still much lower than . This was consistent with the observed suppression of SRS caused by SBS in the region near [Fig. 1(b)(c)].
However, previous theory predicted SRS may turn from convective to absolute at shock ignition intensities Li et al. (2017) by density modulations Nicholson and Kaufman (1974); Nicholson (1976); Williams et al. (1979); Picard and Johnston (1985), potentially growing SRS beyond the convective limit. According to Li et al. (2017) the density modulation threshold for this transition is low, for a characteristic modulation length of . This is well below the typical 2% in our simulations and also measured in experiments with similar parameters Moody et al. (1999). Here we present evidence that SRS may have turned absolute in our PIC simulations. At , the resonant mode of the SRS back scattered light had a frequency of . The wave numbers of this mode can be calculated at different densities, enabling the extraction of this mode amplitude in space. Fig. 1(f) show the space profiles of this mode at 2.25, 2.35 and 2.45 ps near (). The chosen time frames were right after the laser reached at 2ps but before strong pump depletion due to SBS reduces the laser intensity by half at 2.5 ps. The left peaks near displayed signatures of convective growth, growing in amplitude and moving to the left. In contrast, the right peak in the resonant region near kept growing at the same location, showing the signatures of absolute instability. Its growth eventually was interrupted by SBS-induced pump depletion that lowers the local pump intensity. This illustrates the importance of LPI coupling in this region.
Pump depletion due to SBS and SRS reduced the laser intensity near to , only . But this intensity was still well above the threshold for absolute TPD ()Simon et al. (1983). TPD signals are presented in Fig. 2. Near , significant plasma waves was observed [Fig. 2(a)], and the Fourier transform of these modes showed that they overlapped with the theoretical curve of TPD instability[Fig. 2(b)] above 0.2. Note that the strong signals near in Fig. 2(b) corresponded to the electric fields of both the incident laser and the SBS side scattered light.
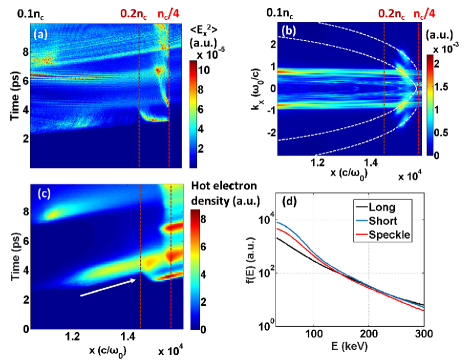
The space-time information of hot electrons (with energy above 50 keV) is presented in Fig. 2(c) and shows that most hot electrons were generated in and TPD may be the main cause. However, in , SRS-generated hot electrons were also observed at 4 ps and 8 ps. The SRS hot electrons may continue to be accelerated by TPD [Fig. 2(c)]. To our knowledge this was the first time both the SRS and TPD hot electrons were identified by their origins in one simulation. The time-averaged was with a temperature of [Fig.2 (d) (Long)].
The high SBS reflectivity was not due to elevated seed level in the simulation. In the simulation, the SBS seed was dominated by the electromagnetic noise, which was about times higher than electrostatic noise. The PIC SBS seed level was higher than the actual seed level . However, the critical gain depends insensitively on the seed level, and would decrease from 3.4 to 1.7. This did not expand significantly the density region of strong SBS pump depletion [Fig. 1(d)]. This was further supported by two 1D PIC simulations with the same physical parameters but different number of particles per cell PPC=200 and 20,000, which showed similar average SBS reflectivity [Fig. 3(a)]. We believe here physics depended more on strong pump depletion and not sensitive to the seed levelTang (1966).
The experiment found strong pump depletion but did not have direct SBS measurement S.Zhang et al. (2018). To study possible situations when SBS was not as high below and a higher laser intensity can reach , we performed two more 2D PIC Simulation (ii & iii) [Table I] with the same initial conditions except that the density profile starts from 0.14 instead of 0.01 [the yellow region of Fig. 1(a)]. Both simulation showed a lower than the experiment. Without the low density () plasma, the average SRS reflectivity for the plane wave case [ii, (Short)] rose to 20 and the SBS reflectivity decreased to 32 as shown in Fig. 3(b). Hot electrons were now mainly generated by SRS in [Fig. 3(c)], which contrasts to Fig. 2(c). TPD can still be observed near but they were no longer the main cause for hot electrons. Compared to Simulation (i), increased from to [Fig. 3(d)] and decreased from 46 keV to 35 keV [Fig. 2(d)], both trending away from the experiment values.
Comparing Simulation (i) and (ii) shows the importance of including the low density region. This also shows the competition in SBS and SRS. Reducing SBS not only reduced the overall reflectivity but also increased SRS, which in turn would soften the hot electron spectrum. From hot electron locations in the simulation domain [Fig. 2(c) and 3(c)], we can separate SRS and TPD hot electrons. We find SRS hot electrons had 25 keV, lower than keV of TPD hot electrons. Consequently, the accumulated hot electrons in Simulation (i) showed higher 46 keV compared to moderate 35 keV in Simulation (ii) [Fig. 2(d)]. This shows the critical effects of LPI in the low density region on the hot electron properties in the long scale-length plasma.
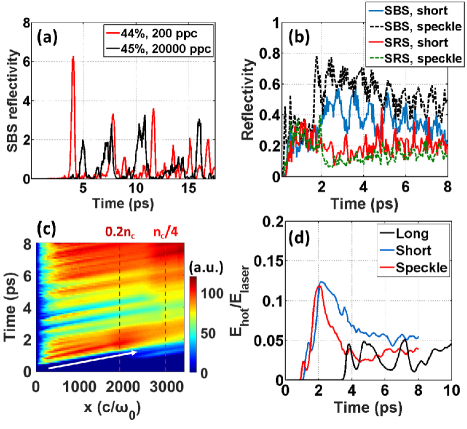
We performed Simulation (iii) [Table I] to qualitatively study how the effects of potential laser filaments/speckles on SBS and hot electron generation. We used a single Gaussian laser speckle focused at with a spot size of 3, and the transverse size of the simulation domain was doubled compared to Simulation (ii). The maximum laser intensity at the incident plane was , keeping the transversely averaged intensity at . All other initial conditions were the same with the Simulation (ii). The SRS and SBS reflectivities are plotted in Fig. 3(b). Compared to the plane wave case (ii), the SBS reflectivity increased from to 50 and SRS reflectivity decreased from to 15. The conversion efficiency reduced to [Fig. 3(d)] but keV did not change much [Fig. 2(d)].
In summary, the large-scale PIC simulations here show the importance of the low density region in shock ignition LPI hot electron generation. Only when it was included can the simulations reproduce the experiment measurements of the hot electron conversion efficiency and temperature. Excluding it would increase the conversion efficiency by reducing the overall pump depletion and lower the temperature by increasing the SRS hot electron fraction to levels inconsistent to the experiments. The strong pump depletion was supported by the experiments Zhang et al. (2019). Our research shows that high convective gains of LPI for SI high laser intensity in the long-scale low density region is a concern. However, it should be noted that both the simulations and experiments described in this paper used a single-beam as the main interaction pulse. Recent planar target experiments on OMEGA performed by this teamS.Zhang et al. (2018) using multiple and overlapped UV beams as the interaction pulses with , and have doubled laser-to-electron energy conversion efficiency compared to the single-beam experiment on OMEGA EP. This warrants further investigation. Future LPI experiments on OMEGA are planned to directly probe electron plasma and ion acoustic waves using optical Thomson scattering together with time-resolved full aperture backscattering diagnostics.
We acknowledge useful discussions with Dr. L. Hao. This work was supported by the DOE Office of Science under grant No.DE-SC0014666, DE-SC0012316 and NNSA NLUF grant No.DE-NA0003600, DE-NA0002730. This research used resources of the National Energy Research Scientific Computing Center (NERSC) and the Argonne Leadership Computing Facility, which are both the U.S. Department of Energy Office of Science User Facility, but operated respectively under Contract No.DE-AC02-05CH11231 and DE-AC02-06CH11357. The support of DOE does not constitute an endorsement by DOE of the views expressed in this paper.
References
- Betti et al. (2007) R. Betti, C. D. Zhou, K. S. Anderson, L. J. Perkins, W. Theobald, and A. A. Solodov, Physical Review Letters 98, 155001 (2007).
- Perkins et al. (2009) L. J. Perkins, R. Betti, K. N. Lafortune, and W. H. Williams, Physical Review Letters 103 (2009), 10.1103/PhysRevLett.103.045004.
- Lindl et al. (2004) J. D. Lindl, P. Amendt, R. L. Berger, S. G. Glendinning, S. H. Glenzer, S. W. Haan, R. L. Kauffman, O. L. Landen, and L. J. Suter, Physics of Plasmas 11, 339 (2004).
- Kruer (2003) W. L. Kruer, The Physics of Laser Plasma Interactions (Westview Press, Boulder, CO, 2003).
- Liu et al. (1974) C. S. Liu, M. N. Rosenbluth, and R. B. White, The Physics of Fluids 17, 1211 (1974).
- Forslund et al. (1975) D. W. Forslund, J. M. Kindel, and E. L. Lindman, Physics of Fluids AIP Conf. Proc. Phys. Fluids Oxidation Processes on Laser‐Irradiated Germanium Surfaces J. Appl. Phys 18, 1002 (1975).
- Rosenbluth (1972) M. N. Rosenbluth, Physical Review Letters 29, 565 (1972).
- Drake and Lee (1973) J. F. Drake and Y. C. Lee, Physical Review Letters 31, 1197 (1973).
- Rosenbluth et al. (1973) M. N. Rosenbluth, R. B. White, and C. S. Liu, Physical Review Letters 31, 1190 (1973).
- Simon et al. (1983) A. Simon, R. W. Short, E. A. Williams, and T. Dewandre, Physics of Fluids 26, 3107 (1983).
- Craxton and McCrory (1984) R. S. Craxton and R. L. McCrory, Journal of Applied Physics 56, 108 (1984).
- Llor Aisa et al. (2017) E. Llor Aisa, X. Ribeyre, G. Duchateau, T. Nguyen-Bui, V. T. Tikhonchuk, A. Colaïtis, R. Betti, A. Bose, and W. Theobald, Physics of Plasmas 24, 112711 (2017).
- Nora et al. (2015) R. Nora, W. Theobald, R. Betti, F. J. Marshall, D. T. Michel, W. Seka, B. Yaakobi, M. Lafon, C. Stoeckl, J. Delettrez, A. A. Solodov, A. Casner, C. Reverdin, X. Ribeyre, A. Vallet, J. Peebles, F. N. Beg, and M. S. Wei, Physical Review Letters 114 (2015), 10.1103/PhysRevLett.114.045001.
- Shang et al. (2017) W. Shang, R. Betti, S. Hu, K. Woo, L. Hao, C. Ren, A. Christopherson, A. Bose, and W. Theobald, Physical Review Letters 119, 195001 (2017).
- Klimo et al. (2011) O. Klimo, V. T. Tikhonchuk, X. Ribeyre, G. Schurtz, C. Riconda, S. Weber, and J. Limpouch, Physics of Plasmas 18, 082709 (2011).
- Weber et al. (2012) S. Weber, C. Riconda, O. Klimo, A. Héron, and V. T. Tikhonchuk, Physical Review E - Statistical, Nonlinear, and Soft Matter Physics 85, 016403 (2012).
- Batani et al. (2014) D. Batani, S. Baton, a. Casner, S. Depierreux, M. Hohenberger, O. Klimo, M. Koenig, C. Labaune, X. Ribeyre, C. Rousseaux, G. Schurtz, W. Theobald, and V. Tikhonchuk, Nuclear Fusion 54, 054009 (2014).
- Riconda et al. (2011) C. Riconda, S. Weber, V. T. Tikhonchuk, and a. Héron, Physics of Plasmas 18, 092701 (2011).
- Yan et al. (2014) R. Yan, J. Li, and C. Ren, Physics of Plasmas 21, 062705 (2014).
- S.Zhang et al. (2018) S.Zhang, C. M. Krauland, J. Li, J. Peebles, F. N. Beg, S. Muller, N. Alexander, C. Ren, W. Theobald, R. Betti, D. Haberberger, E. M. Campbell, R. Yan, E. Borwick, J. Trela, D. Batani, P. Nicolai, and M. S. Wei, “The generation of collimated moderate temperature electron beam in shock ignition-relevant planar target experiments on omega-ep,” presented in 48th Annual Anomalous Absorption Conference (2018).
- Hao et al. (2016) L. Hao, J. Li, W. D. Liu, R. Yan, and C. Ren, Physics of Plasmas 23, 042702 (2016).
- Hao et al. (2017) L. Hao, R. Yan, J. Li, W. D. Liu, and C. Ren, Physics of Plasmas 24 (2017), 10.1063/1.4989702.
- Li et al. (2017) J. Li, R. Yan, and C. Ren, Physics of Plasmas 24, 052705 (2017).
- Theobald et al. (2015) W. Theobald, R. Nora, W. Seka, M. Lafon, K. S. Anderson, M. Hohenberger, F. J. Marshall, D. T. Michel, A. A. Solodov, C. Stoeckl, D. H. Edgell, B. Yaakobi, A. Casner, C. Reverdin, X. Ribeyre, A. Shvydky, A. Vallet, J. Peebles, F. N. Beg, M. S. Wei, and R. Betti, Physics of Plasmas 22, 056310 (2015).
- Theobald et al. (2017) W. Theobald, A. Bose, R. Yan, R. Betti, M. Lafon, D. Mangino, A. R. Christopherson, C. Stoeckl, W. Seka, W. Shang, D. T. Michel, C. Ren, R. C. Nora, A. Casner, J. Peebles, F. N. Beg, X. Ribeyre, E. Llor Aisa, A. Colaïtis, V. Tikhonchuk, and M. S. Wei, Physics of Plasmas 24, 1 (2017).
- Theobald et al. (2012) W. Theobald, R. Nora, M. Lafon, A. Casner, X. Ribeyre, K. S. Anderson, R. Betti, J. A. Delettrez, J. A. Frenje, V. Y. Glebov, O. V. Gotchev, M. Hohenberger, S. X. Hu, F. J. Marshall, D. D. Meyerhofer, T. C. Sangster, G. Schurtz, W. Seka, V. A. Smalyuk, C. Stoeckl, and B. Yaakobi, Physics of Plasmas 19 (2012), 10.1063/1.4763556.
- Trela et al. (2018) J. Trela, W. Theobald, K. S. Anderson, D. Batani, R. Betti, A. Casner, J. A. Delettrez, J. A. Frenje, V. Y. Glebov, X. Ribeyre, A. A. Solodov, M. Stoeckl, and C. Stoeckl, Physics of Plasmas 25, 52707 (2018).
- Zhang et al. (2019) S. Zhang, J. Li, C. M. Krauland, F. N. Beg, S. Muller, W. Theobald, J. Palastro, T. Filkins, D. Turnbull, D. Haberberger, C. Ren, R. Betti, C. Stoeckl, E. M. Campbell, J. Trela, D. Batani, R. Scott, and M. S. Wei, “Pump-depletion dynamics and saturation of stimulated brillouin scattering in shock ignition relevant experiments,” (2019), arXiv:1909.00094 .
- Fonseca et al. (2002) R. A. Fonseca, L. O. Silva, F. S. Tsung, V. K. Decyk, W. Lu, C. Ren, W. B. Mori, S. Deng, S. Lee, T. Katsouleas, and J. C. Adam, “Computational science — iccs 2002: International conference amsterdam, the netherlands, april 21–24, 2002 proceedings, part iii,” (Springer Berlin Heidelberg, Berlin, Heidelberg, 2002) Chap. OSIRIS: A Three-Dimensional, Fully Relativistic Particle in Cell Code for Modeling Plasma Based Accelerators, pp. 342–351.
- Fryxell et al. (2000) B. Fryxell, K. Olson, P. Ricker, F. X. Timmes, M. Zingale, D. Q. Lamb, P. MacNeice, R. Rosner, J. W. Truran, and H. Tufo, The Astrophysical Journal Supplement Series 131, 273 (2000).
- Vu et al. (1994) H. X. Vu, J. M. Wallace, and B. Bezzerides, The Physics of Fluids 1, 869 (1994).
- Berger et al. (1989) R. L. Berger, E. A. Williams, and A. Simon, Physics of Fluids B 1, 414 (1989).
- Nicholson and Kaufman (1974) D. R. Nicholson and A. N. Kaufman, Physical Review Letters 33, 1207 (1974).
- Nicholson (1976) D. R. Nicholson, Physics of Fluids 19, 889 (1976).
- Williams et al. (1979) E. a. Williams, J. R. Albritton, and M. N. Rosenbluth, Physics of Fluids 22, 139 (1979).
- Picard and Johnston (1985) G. Picard and T. W. Johnston, Physics of Fluids 28, 1211 (1985).
- Moody et al. (1999) J. Moody, B. MacGowan, S. Glenzer, R. Kirkwood, W. Kruer, a. Schmitt, E. Williams, and G. Stone, Physical Review Letters 83, 1783 (1999).
- Tang (1966) C. L. Tang, Journal of Applied Physics 37, 2945 (1966).