Relevance of magnetism to cuprate superconductivity: Lanthanides versus charge-compensated cuprates
Abstract
We address what seemed to be a contradiction between the lanthanide series REBa2Cu3Oy (RE123) and the charge-compensated series (CaxLa1-x)(Ba1.75-xLa0.25+x)Cu3Oy (CLBLCO) regarding the superexchange () dependence of the maximum superconductivity (SC) critical temperature ; RE and are implicit variables. This is done by measuring the Néel temperature and the temperature dependence of the magnetic order parameter for RE=Nd, Sm, Eu, Gd, Dy, Yb, Y, and for Y(BaSr)Cu3Oy, at various very light dopings. The doping is determined by thermopower, and the magnetic properties by muon spin rotation. We find that the normalized-temperature dependence of the order parameter is identical for all RE123 in the undoped limit (with the exception of Gd123) implying identical out-of-plane magnetic coupling. The extrapolation of to zero doping suggests that, despite the variations in ionic radii, varies too weakly in this system to test the relation between SC and magnetism. This stands in contrast to CLBLCO where both and vary considerably in the undoped limit, and a positive correlation between the two quantities was observed.
I Introduction
Recently, the group of Tallon Mallett et al. (2013) measured the in plane super-exchange parameter in a series of samples similar to YBa2Cu3Oy, where Y was replaced by one of the lanthanides: La, Nd, Eu, Gd, Dy, Yb, Lu, or the Ba2 was modified to BaSr. The measurements were done using two-magnon Raman scattering. The samples were prepared with as low doping () as possible, although the actual value was not determined. They found that as one progresses in the lanthanide series and the atomic number increases, also increases. They justify this increase by the famous lanthanide contraction where the atomic radius becomes smaller as the atomic number increases. They also found anti-correlation between the maximum () of each family of materials, and . The internal pressure (induced by substitution of isovalent ions of smaller size) seems to increase but decrease .
The RE123 result stands in strong contrast to experiments on the charge-compensated compound (CaxLa1-x)(Ba1.75-xLa0.25+x)Cu3Oy (CLBLCO) performed by the Keren group. The name “charge-compensated” comes from the fact that Ca and Ba have the same valance and their replacement does not formally dope the system. However increasing shrinks the Cu-O-Cu distance and straightens the buckling angle Ofer et al. (2008); the total amount of La in the chemical formula is constant. In CLBLCO and were measured for various values of and . It was found that in the parent and doped compounds and are correlated; the stronger the magnetic interactions the higher is. The measurements were done with muon spin rotation (SR) Ofer et al. (2006), Raman scattering Wulferding et al. (2014), angle resolved photoemission Drachuck et al. (2014), and resonant inelastic x-ray scattering Ellis et al. (2015) and all methods agree qualitatively. The RE123 results are also in contradiction with external pressure experiments on Y123 as pointed out by Tallon and co-workers Mallett et al. (2013). External pressure raises and simultaneously.
An attempt was made to resolve the contradiction using new two-magnon Raman scattering measurements Müllner et al. (2018). In this experiment only samples that are prepared under the same conditions, and with the doping determined by thermopower, where remeasured. It was found that within experimental uncertainty the RE=Y, Dy, Gd, and Sm have the same two-magnon Raman peak frequency. The RE=Nd has a peak at substantially lower energy than its counterparts. This indicates that at least among the first four superconducting families is not changing appreciably with lanthanide substitution.
In this manuscript we address the same discrepancy from the perspective of magnetic measurements. We apply the SR technique to 27 samples with different RE compositions and doping, including the Y(BaSr)Cu3Oy. The doping is determined from the thermopower Seebeck coefficient () Obertelli et al. (1992). For each sample we measure the Néel temperature () and the muon spin angular rotation frequency as a function of temperature. Since is set by both in-plane and out-of-plane coupling and respectively, two measured quantities are required to determine both couplings. These quantities are and the order parameter , where is the muon spin rotation frequency at Ofer et al. (2006). This type of analysis works best in the fully undoped case which is described by the 3D Heisenberg Hamiltonian. But, since it is not clear if the samples are completely undoped, we perform measurements as a function of doping and extrapolate to zero doping.
II Experimental Aspects
The RE123 and Y(BaSr)Cu3Oy samples are prepared by solid-state reaction at ambient pressure Gilioli et al. (2000). Each sample is an agglomerate of single crystals of sizes up to m pressed into a pellet typically mm in diameter and mm thick. The doping of the crystals is set by argon annealing at C, followed by quenching into liquid nitrogen. The doping is determined from the room-temperature thermopower Seebeck coefficient, S(290), measured on the same samples used for the SR measurements prior to the beam time. The SR experiments are done on the GPS beam line at Paul Scherrer Institute using a closed cycle refrigerator which provides a temperature range of to K. Fine temperature scans where done close to the magnetic phase transition and between and K; above K muon diffusion sets in and hinders detailed data analysis but still allows the determination of Keren et al. (1993). The samples are cooled in zero field and the muon polarization as a function of time is determined via the asymmetry in decay positrons.
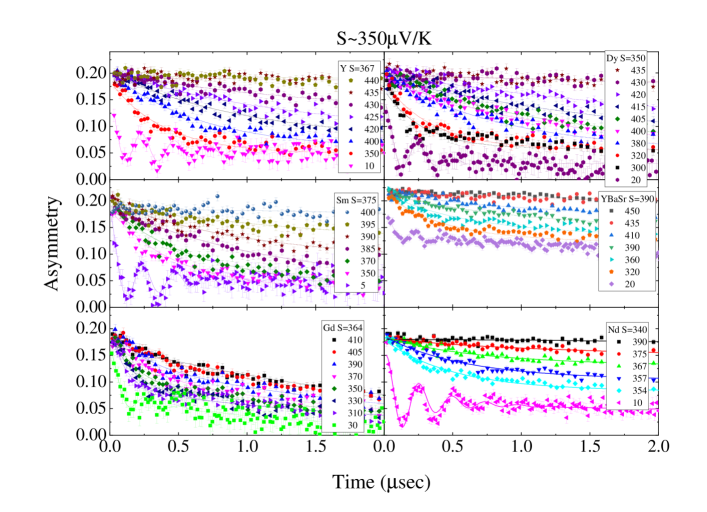
Raw data from the various RE123 systems with V/K are presented in Fig. 1. The exact value of is written in each panel. For all samples, apart from Gd123, there is a temperature high enough that the asymmetry does not relax on the time scale presented in the figure. In all cases the asymmetry develops a strong relaxation within a temperature range of K below . In the Gd case the asymmetry increases its relaxation from a high temperature saturated value. A finite, temperature independent relaxation rate at high temperatures, in samples containing Gd is ubiquitous (e.g., Ref. Shekhar et al. (2018)). In all cases, at very low temperatures oscillations develop indicating an ordered state of the material with a site-average magnetic field at the muon site larger than its fluctuation from site to site. The oscillation frequency is similar in all samples. The signal from YBaSr indicates that only part of this sample is actually magnetic.
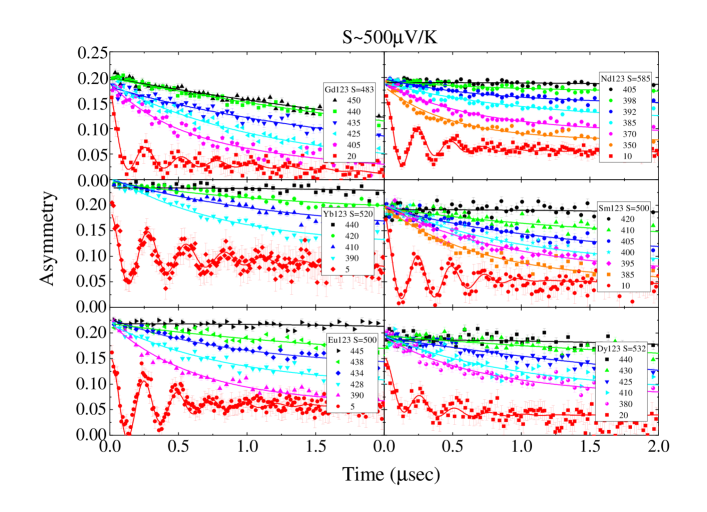
Results from a representative set of RE123 with V/K are shown in Fig. 2. Again, the relaxation in the Gd case is not zero at high temperatures but it saturates. For all families, the relaxation increases over a narrow temperature range (relative to the ). At low temperatures asymmetry oscillations develop.
The time-dependent SR asymmetry data is analyzed with the function
| (1) |
In this function represents the non-magnetic fraction of the sample, and the relaxation rate of the muon spin in this part of the sample. is proportional to the magnetic fraction of the samples. except for the Gd samples where above room temperature. apart from Gd and Sm samples where the values and respectively provide the best fit. and are the muon spin relaxation times in the direction of the local field at the muon site and perpendicular to it, respectively. The relaxation rate varies between samples but is kept fixed in the fit for each sample. In principle should be since there are two field components perpendicular to the muon spin compared to only one longitudinal component. In practice is a fit parameter. Also the total asymmetry should be shared at all temperatures. In practice it is shared for temperatures between and K and between to K separately. Finally, is the muon rotation frequency. It is set to zero when no oscillations are observed in the data, in which case is also set to zero and has no directional association.
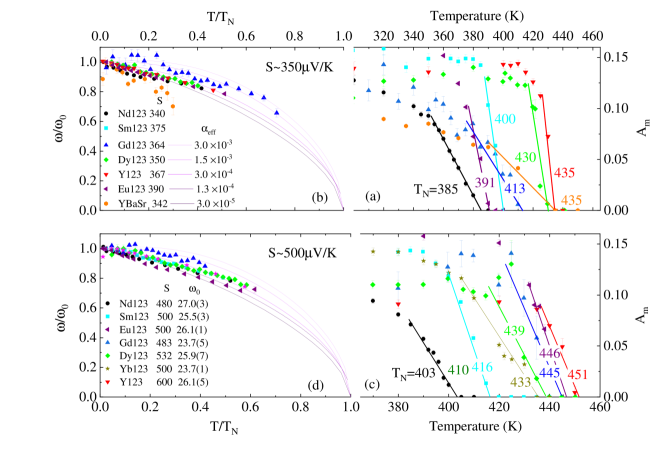
The relevant fit parameters are depicted in Fig. 3. Panel (a) shows the magnetic fraction as a function of temperature for samples with V/K. A straight line is fitted to the sharp rise in and the point of abscissa crossing defines . The value of varies between and K and is indicated next to each line. The sharpness of the phase transition also varies between families. The symbols in panel (b) show the temperature-dependent order parameter. Eu, Sm, Dy, and Y families have the same rate of order parameter reduction with increasing temperature. Gd has a smaller, and Nd and YBaSr have higher reduction rates than the common one. is a measure of the magnetic coupling anisotropy. The smaller at the more isotropic 3D-like is the magnetic system Arovas and Auerbach (1988).
The solid lines in panel (b) are the self-consistent Schwinger-boson mean-field theory calculations Arovas and Auerbach (1988) of where , , the ’s are the number of neighbors, is the in-plane anisotropy, and . Since RE123 has two types of , this parameter represents an average perpendicular coupling. More details are given in Ref. Ofer et al. (2006). However, this model is valid for the Heisenberg Hamiltonian, and the samples presented in Fig. 3(b) are slightly doped. The analysis becomes more accurate as increases further.
Figure 3 panels (c) and (d) also present and but for samples with V/K. In this case the lowest value of is K and therefore the spread in between different families is smaller. In addition, apart from Gd, all at nearly overlap and is on the order of . This result suggests that as the doping decreases the different families converge to the same magnetic behavior.
III Discussion
Our main results are depicted in Fig. 4. We present as a function of the thermopower in the lower abscissa for various RE123 families and Y(BaSr)Cu3Oy; decreases with increasing doping and hence the reverse axis. For all families, increases with increasing (decreasing doping). For some of the families such as RE=Y, and Dy, a saturation is clearly reached which reflects the fact that for these families doping is not changing at these high thermopower values. In RE=Gd and Eu it is not clear if saturation has been reached. For RE=Yb, Sm, and Nd it is clear that saturation has not been reached, and if it was possible to extract more oxygen from the sample, could have increased. In all families never exceeds K. This is particularly peculiar for the YBaSrCu3Oy where is larger by 10%, according to new measurements Wulferding18, and according to the original measurements Mallett et al. (2013) in YBa0.5Sr1.5Cu3Oy by 50%, than in RE=Y. Therefore, of YBaSrCu3Oy is expected to be higher than K, which is not the case. The solid lines in the figure are guides to the eye. It is conceivable but not guaranteed that all these lines meet at , which would then correspond to zero doping. These lines suggest that s for all examined families may be identical. Assuming that (i) all lines flatten by , (ii) that at an estimated doping level drops to zero, and (iii) that the relation between and is exponential, then we may convert to using the relation . Values of thus obtained are presented on the top abscissa.
A different way of looking at the same data is depicted in the inset of Fig. 4. Here we plot versus for each SC family at two, roughly fixed , namely fixed doping. The room temperature thermopower has been shown to be an excellent correlate of the doped hole concentration, , in units of holes/Cu Obertelli et al. (1992). Closer to optimal doping and beyond, it is a highly sensitive and a precise measure of doping, but at very low doping it becomes increasingly uncertain as . For this reason we bin our doping states separately into V/K and V/K. The corresponding data in Fig. 4 is highlighted. In both cases holes/Cu and we are confident that the doping state of the latter is less than that of the former. Beyond such broad categories it is impossible to read much into any variations within the V/K or V/K groups; both are extremely close to the undoped insulator and the variations in temperature seen between the two groups show just how sensitive is to small increments in doping near . Looking at the V/K and ignoring Y(BaSr)Cu3Oy it seems that there is anti-correlation between and . But, as increases towards V/K (doping decreases) this anti-correlation weakens, and, again, the effect of lanthanide substitution on disappears.
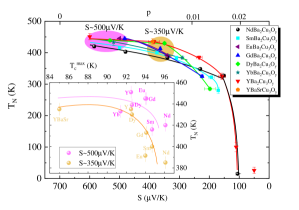
A comparison between RE123 and CLBLCO is presented in Fig. 5. The main panel depicts the relations between and , where is the maximum Néel temperature achieved for each family. For RE123 values are taken from Refs. Veal et al. (1989); Guillaume et al. (1994); Mallett et al. (2013), and is the highest value of we managed to achieve for each family by oxygen reduction. For CLBLCO, a saturation of is achieved for all values by underdoping, and there is no need to extrapolate to zero doping. Both quantities are plotted on a full scale including the origin. In the RE123 case, a fit to a straight line gives a slope of , namely, the error is similar to the value. This means that basically is independent of . Furthermore, since Nd and Sm are slightly doped, in the ideal undoped case all points should be bunched together with no variation in , as suggested from the extrapolation of the data in Fig. 4 to high . In contrast, the CLBLCO points are well separated on both the and axis.
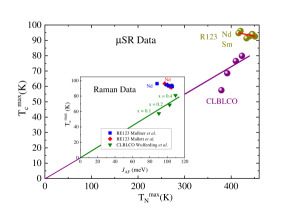
The inset shows data from the Raman measurements, also plotted on a full scale, but only for samples which are prepared under the same condition (ambient pressure) and measured by both Müllner Müllner et al. (2018) and Mallett Mallett et al. (2013). Close examination of this data shows an anti-correlation between and , however, there is disagreement on the Nd data point, and overall it seems that on a scale including the origin, neither nor changes enough in the R123 samples to allow for a proper examination of the relation between magnetism and superconductivity with this system. Again, in CLBLCO, both quantities change by more than 10% and the experimental message is clearer. One possibility is that indeed scales with , however a different interpretation is that CLBLCO is anomalous as discussed in Ref. Tallon (2014). There it was shown that, once the doping is determined using thermopower, the pseudogap shows a universal doping-dependent behavior, independent of composition, . In contrast, appears to show an anomalous suppression which grows with decreasing , thereby effectively reversing its correlation with . The reasons for such a suppression are not apparent and, for example, NMR studies suggest it is not associated with disorder scattering Amit and Keren (2010); Cvitanić et al. (2014); Agrestini et al. (2014). These are interesting model systems that deserve more study if systematic behavior is to be elucidated.
IV Conclusions
We characterize the magnetic properties of several different RE123 compounds, and Y(BaSr)Cu3Oy as a function of doping. In particular we focus on the Néel temperature and the reduction of the order parameter as a function of temperature. It is possible (yet not essential) to extrapolate the data for each family to zero doping in a way where all the RE123 have the same magnetic properties. In particular they have the same . This is quite surprising considering the changes in unit cell parameters Guillaume et al. (1994). Similarly, within experimental errors all RE123 presented here have nearly identical . Therefore, RE123 is not the system with which one would like to test the relation between superconductivity and magnetism. In contrast CLBLCO shows large variation in both quantities and indicates a positive correlation between magnetic properties and superconductivity.
V Acknowledgments
The Technion team is supported by the Israeli Science Foundation (ISF) grant number 315/17 and by Technion RBNI Nevet program. The SR work is based on experiments performed on the GPS instrument of the Swiss Muon Source SS, Paul Scherrer Institute, Villigen, Switzerland.
References
- Mallett et al. (2013) B. P. P. Mallett, T. Wolf, E. Gilioli, F. Licci, G. V. M. Williams, A. B. Kaiser, N. W. Ashcroft, N. Suresh, and J. L. Tallon, Phys. Rev. Lett. 111, 237001 (2013).
- Ofer et al. (2008) R. Ofer, A. Keren, O. Chmaissem, and A. Amato, Phys. Rev. B 78, 140508(R) (2008).
- Ofer et al. (2006) R. Ofer, G. Bazalitsky, A. Kanigel, A. Keren, A. Auerbach, J. S. Lord, and A. Amato, Phys. Rev. B 74, 220508(R) (2006).
- Wulferding et al. (2014) D. Wulferding, M. Shay, G. Drachuck, R. Ofer, G. Bazalitsky, Z. Salman, P. Lemmens, and A. Keren, Phys. Rev. B 90, 104511 (2014).
- Drachuck et al. (2014) G. Drachuck, E. Razzoli, R. Ofer, G. Bazalitsky, R. S. Dhaka, A. Kanigel, M. Shi, and A. Keren, Phys. Rev. B 89, 121119(R) (2014).
- Ellis et al. (2015) D. S. Ellis, Y.-B. Huang, P. Olalde-Velasco, M. Dantz, J. Pelliciari, G. Drachuck, R. Ofer, G. Bazalitsky, J. Berger, T. Schmitt, and A. Keren, Phys. Rev. B 92, 104507 (2015).
- Müllner et al. (2018) S. Müllner, W. Crump, D. Wulferding, B. P. P. Mallett, P. Lemmens, A. Keren, and J. L. Tallon, Phys. Rev. B 99, 094525 (2019).
- Obertelli et al. (1992) S. D. Obertelli, J. R. Cooper, and J. L. Tallon, Phys. Rev. B 46, 14928 (1992).
- Gilioli et al. (2000) E. Gilioli, A. Gauzzi, T. Besagni, F. Licci, M. Marezio, and P. G. Radaelli, International Journal of Modern Physics B 14, 2658 (2000).
- Keren et al. (1993) A. Keren, L. P. Le, G. M. Luke, B. J. Sternlieb, W. D. Wu, Y. J. Uemura, S. Tajima, and S. Uchida, Phys. Rev. B 48, 12926 (1993).
- Shekhar et al. (2018) C. Shekhar, N. Kumar, V. Grinenko, S. Singh, R. Sarkar, H. Luetkens, S.-C. Wu, Y. Zhang, A. C. Komarek, E. Kampert, Y. Skourski, J. Wosnitza, W. Schnelle, A. McCollam, U. Zeitler, J. Kübler, B. Yan, H.-H. Klauss, S. S. P. Parkin, and C. Felser, Proceedings of the National Academy of Sciences 115, 9140 (2018).
- Arovas and Auerbach (1988) D. P. Arovas and A. Auerbach, Phys. Rev. B 38, 316 (1988).
- Veal et al. (1989) B. W. Veal, A. P. Paulikas, J. W. Downey, H. Claus, K. Vandervoort, G. Tomlins, H. Shi, M. Jensen, and L. Morss, Physica (Amsterdam) C 162, 97 (1989).
- Guillaume et al. (1994) M. Guillaume, P. Allenspach, W. Henggeler, J. Mesot, B. Roessli, U. Staub, P. Fischer, A. Furrer, and V. Trounov, Journal of Physics: Condensed Matter 6, 7963 (1994).
- Tallon (2014) J. L. Tallon, Phys. Rev. B 90, 214523 (2014).
- Amit and Keren (2010) E. Amit and A. Keren, Phys. Rev. B 82, 172509 (2010).
- Cvitanić et al. (2014) T. Cvitanić, D. Pelc, M. Požek, E. Amit, and A. Keren, Phys. Rev. B 90, 054508 (2014).
- Agrestini et al. (2014) S. Agrestini, S. Sanna, K. Zheng, R. De Renzi, E. Pusceddu, G. Concas, N. L. Saini, and A. Bianconi, J. Phys. Chem. Solids 75, 259 (2014).