Constraining dark photon properties with Asteroseismology
Abstract
Dark photons are particles invoked in some extensions of the Standard Model which could account for at least part of the dark matter content of the Universe. It has been proposed that the production of dark photons in stellar interiors could happen at a rate that depends on both, the dark photon mass and its coupling to Standard Model particles (the kinetic mixing parameter ). In this work we aim at exploring the impact of dark photon productions in the stellar core of solar mass RGB stars during late evolutionary phases. We demonstrate that near the so-called RGB bump, dark photons production may be an energy sink for the star sufficiently significative to modify the extension of the star convective zones. We show that Asteroseismology is able to detect such variations in the structure, allowing us to predict an upper limit of and for the mass and kinetic mixing of the dark photons, respectively. We also demonstrate that additional constraints can be derived from the fact that dark photons increase the luminosity of the RGB tip over the current observational uncertainties. This work thus paves the way for an empirical approach to deepen the study of such dark-matter particles.
keywords:
Dark matter – Asteroseismology– Stars:interiors1 Introduction
Despite its success, the Standard Model of Particle Physics (SM) leaves many questions unanswered, suggesting that it should be extended. Dark matter, dark energy, and the CP (charge-parity) violation are some of these open questions. Many of the solutions proposed to solve the dark matter problem consist of extensions to the SM by assuming the existence of a dark sector, made of new particles which may or may not interact with the known fundamental particles. These hypothetical particles have been recognized as affecting astrophysical observables (Raffelt, 1999). Therefore, some constraints have been derived, from astrophysical observations, on Weakly Interacting Massive Particles or WIMPS (Lopes et al., 2011; Sivertsson & Gondolo, 2011; Scott et al., 2009; Spolyar et al., 2008), as well as on the so-called Weakly Interacting Slim Particles (WISPs) such as axions (Jaeckel & Ringwald, 2010; Weinberg, 1978; Wilczek, 1978). Among the effects of these particles there are changes in the standard stellar evolution.
For instance, it was pointed out some years ago that the post-main sequence stars could be affected by axion-photon interactions mediated by means of the Primakoff process in stellar interiors. This changes the lifetime of the central helium burning, during the horizontal branch (HB) phase (Horns & Meyer, 2012; Raffelt & Dearborn, 1987). More specifically, Primakoff axion emission from HB stars modifies the parameter, an observable relying on HB lifetimes and related to globular clusters, which has been used to constrain axion-photon coupling (Ayala et al., 2014).
The so-called tip of the red giant branch (TRGB), a local luminosity maximum in HR diagram which takes place by the end of RGB phase, has been used to derive bounds on axions and neutrino properties (Viaux et al., 2013). Also occurring during the RGB phase, the RGB bump, a maximum of the luminosity function that happens when the hydrogen shell reaches the chemical gradient left by the convective envelope (King et al., 1985; Iben, 1968; Thomas, 1967) has motivated a lot of research. After its first detection (King et al., 1985), a number of studies mentioned the discrepancies between theoretical models and the bump luminosity, arguing for the necessity of some additional mechanism. Specially that concerning convection or the additional cooling by new particles (Khan et al., 2018; Bjork & Chaboyer, 2006; Riello et al., 2003; Zoccali et al., 1999; Cassisi & Salaris, 1997; Fusi Pecci et al., 1990).
In this work we suggest the study of the RGB bump in order to constrain the properties of beyond Standadard Model particles. To do that we introduce, in the simulation of the RGB stars, an additional energy loss, the loss consisting of the emission from stellar cores of dark photons, boson particles which have been invoked in some minimal modifications of SM and could be a candidate for at least part of the dark matter content in the Universe (Kovetz et al., 2019; Brun et al., 2019; Fradette et al., 2014; Redondo & Raffelt, 2013; Arias et al., 2012; Redondo & Postma, 2009; Holdom, 1986; Okun, 1982). We explored the changes in the internal structure of RGB stars due to the dark photon emission from their degenerate cores. Then we performed a study of the observational consequences from the point of view of Asteroseismology, the study of oscillations in star light curves originated by internal instabilities (see e.g., Aerts et al. (2010)). This technique is nowadays the most accurate way of looking into the stellar interiors. In order to compare the prediction of asteroseismic parameters of the dark photon models with the observations we used the characterization of the RGB bump stars previously done by Khan et al. (2018), a reference work for this paper, with data coming from the APOKASC catalogue (Albareti et al., 2017).
In addition, due to the fact the dark photon cooling can affect the He core mass, as we demonstrate in this paper, it is appealing to study the luminosity at the tip of the RGB. This observable depends on the He mass by the end of the RGB, and therefore could be an additional constraint on dark photon models.
This paper is organized as follows: in section 2 we introduce the theoretical motivations of dark photons and the expression of the emission rate, as well as the possible effects of dark photons on the stellar oscillations. Section 3 deals with the results of the simulations concerning the stellar structure of the equilibrium models. The changes on the pulsations of the stars are described in Section 4. Section 5 deals with the RGB tip luminosity as an additional constraint on dark photons. Finally, section 6 summarizes the conclusions and addresses future work.
2 Physical case for dark photon
Dark photon was proposed as the associated particle of a vector field, , which can couple to the hypercharge of Standard Model, by means of the so-called kinetic mixing (Holdom, 1986; Okun, 1982). The SM lagrangian is then modify (Redondo & Raffelt, 2013) as follows:
| (1) |
where and stand, respectively, for the mass of the dark photon and the kinetic mixing or coupling between the photon, , and fields.
Several experiments are devoted to dark photon search (Baryakhtar et al., 2018; Bauer et al., 2018; Danilov et al., 2018; XMASS Collaboration et al., 2018; Suzuki et al., 2015; Döbrich et al., 2014). More specifically some recent experimental constraints on dark photon parameters are those of Kopylov et al. (2019) and Abe et al. (2018). In addition, constraints on dark photon models have been put on the basis of astrophysical arguments (Guo et al., 2019b, a; Kovetz et al., 2018; Cardoso et al., 2018; An et al., 2014). The fact that under certain conditions of the stellar interiors, dark photons could be emitted, carrying energy, with a rate proportional to and has been exploited by some authors to derive bounds on both parameters from the main sequence or the post-main sequence star features (Vinyoles et al., 2015; An et al., 2013; Redondo & Raffelt, 2013; Cadamuro & Redondo, 2010). With the exception of Vinyoles et al. (2015), these previous works do not take into account the feedback of dark photon emissions on the stellar evolution, as far as they depart from a previous stellar model and calculate an average of the energy loss due to dark photons. Then the possible effects on stellar structure due to dark photon emissions are neglected .
According to previous research the flux of hypothetical dark photons from stellar interiors has been computed under the assumption that these particles interact only with normal matter through kinetic mixing, by means of longitudinal and transverse modes of plasmon oscillations (Redondo & Raffelt, 2013; Redondo, 2008). For longitudinal plasmon oscillation the fact that the dispersion relation equals the plasma frequency ensures the existence of a region inside the stars where the kinetic mixing between the photons and dark photons reaches a maximum, leading to a resonance (Redondo & Raffelt, 2013). On the basis of this result, we restrict the study to longitudinal (L) modes. Now in case of longitudinal mode dark photon emission, according to An et al. (2013), the rate can be expressed in the form
| (2) |
Where as usual and stand for density and temperature, for the rate of longitudinal plasmon oscillation, for the frequency associates to dark photon dispersion relation, is the plasma frequency, the dark photon mass, and the kinetic mixing, which is a non-dimensional parameter. Then, if we consider resonant emission of dark photon, by taking the limit
| (3) |
and plug this into Equation 2, after including the change of units in numerical constants, we obtain the resonant expression of the rate, depending on and .
| (4) |
Where is in eV units, and .
For dark photon masses up to keV, the condition holds for the typical values of and T of RGB stars with initial masses around the solar one (An et al., 2014), thus the expression under the square root is positive and the rate is real. This condition motivated us to look into the dark photons throughout the RGB phase. As in the dark photon mass region , constraints from RGB stars could be more reliable than those coming from dark matter experiments, finally we decided to explore the mass range between and , as well as a kinetic mixing in the range of , not excluded by previous research in this mass interval.
2.1 Asteroseismology as dark photons probe
Asteroseismology is living a golden era thanks to space missions devoted to ultra-precise photometry, such as CoRoT (Baglin et al., 2006), Kepler (Koch
et al., 2010) and, recently, TESS (Ricker
et al., 2015). Stellar oscillations strongly depend on the stellar structure so Asteroseismology is able to probe interiors of pulsating stars. Bulk stellar parameters are inferred with an uncertainty of up to 2% on the radius, 4% on the mass and 15% on the age for stars showing solar-like oscillations (Silva Aguirre
et al., 2017). The oscillation modes on these stars form a clear structure where modes of consecutive radial orders and the same spherical degree are separated by an almost constant frequency distance. This periodic spacing is known as the large separation, (Aerts et al., 2010), and it is related to the mean stellar density.
In addition, Asteroseismology also succeeds in constraining the phenomenology of new particles in stars, as these particles act as supplementary sources or sinks of energy, or they imply a novel transport mechanism inside stars (Casanellas & Lopes, 2013; Lopes & Turck-Chieze, 1994). In that case the internal physical condition and the gradients vary. Therefore, the internal structure, namely the extension of radiative or convective zones, is modified and with them the sizes of the internal cavities the oscillations propagate throughout. According to this idea, the dark photon emission is able to change the internal structure of the star during its evolution, having an impact on the oscillation frequencies of RGB stars. Thus, the analysis of the periodic spacings in the frequency content of RGB stars has the potential to impose constraints on the characteristics of dark photons. This is the aim of our analysis: compare equilibrium and oscillation models with observations in order to constrain dark photon emission.
RGB stars excite solar-like oscillations.Throughout the RGB phase the degenerate core is dominated by gravity modes (g modes), whereas, in the outer regions, pressure modes (p modes) have a much larger amplitude (Elsworth et al., 2017; Bedding et al., 2011). Pressure modes carry the information of . The determination of the frequencies for modes of a given radial and angular order, , makes it possible to study second differences, (Lopes & Turck-Chieze, 1994; Gough, 1990), defined as
| (5) |
which tests the convective boundaries in stars of masses . In this work we deal with the variation of both parameters, second difference for radial modes (), and , produced by the inclusion of dark photons.
3 The equilibrium models
In order to compute the stellar models we used MESA, an open-source 1D code which includes most of the relevant physics, like updated opacities and convection (Paxton et al., 2019, 2018, 2015, 2013; Paxton et al., 2011). We extended the code to take into account the additional energy sink of dark photons, previously estimated by An et al. (2013) and Redondo & Raffelt (2013), implementing Equation 4.
We computed a grid of stellar models with , , , and solar metallicity, setting the mixing length . The initial stellar masses and metallicity were set to these values to compare the models with the observations, as we do in the last part of this work. Khan et al. (2018) have looked into the effect of overshooting from the base of the convective envelope on the bump. Notwithstanding overshooting is poorly constrained by theory, within the exponentially decaying overshooting formalism used in MESA, they exclude values higher than , on the basis of the theoretical prediction for the RGB bump average large separation. In fact, for overshooting values higher than there is an offset between the theoretical values and the observations, which is pretty much over the limits. On the contrary, the authors find that a moderate overshooting, , can address the mismatch between observations and the RGB bump models. We have introduced this last value in our simulations with the aims of checking if overshooting and dark photon effects can be disentangled.
To study the effects of the dark photon in the models, we computed evolutionary tracks, varying the values of between and and the dark photon mass, between 300 and 900 . We chose these values because they are not excluded by previous astrophysical research, even though the lower masses are close to the bounds imposed by the solar lifetime (Suzuki et al., 2015). Moreover, the resonance condition discussed before is satisfied for all the mass values.
For each model, we located the RGB bump searching the luminosity interval along the RGB that is crossed three times, as a consequence of the passage of the hydrogen-burning shell through the discontinuity in chemical composition left over by the first dredge-up (Cassisi et al., 2016). A local maximum and minimum in the evolutionary track is characteristic of the RGB bump. We have focused on the minimum in this paper, referring all the calculations to that point.
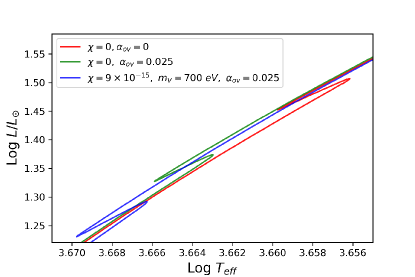
The ages, effective temperatures and luminosities at bump for a reference model (without neither dark photons nor overshooting), the models regarding dark photons, overshooting , and the combined effects of dark photons and overshooting are shown in Table 1. It is noticeable that the bump occurs earlier with respect to the standard scenario when dark photons production is considered. On the other hand, a slight increase in effective temperature, proportional to and is also verified. In addition, we report a decrease of luminosity as and are enhanced. Therefore, the introduction of dark photons implies a displacement of the position of the bump in the HR diagram, as it is shown in Figure 1. The overshooting effects on the age, luminosity and effective temperature at bump are analogous to those of dark photons: the bump is reached earlier, the effective temperature increases whereas the luminosity decreases. When overshooting and dark photon occur simultaneously, the variations with respect to the reference model are larger, reaching a maximum for the model , and .
The effects of dark photon cooling and overshooting on the He core and the hydrogen shell, occurring throughout the RGB phase, are shown in Table 2. The mass of the helium core decreases with respect to the model with , as does the central temperature. We also recall that the nuclear energy rate due to the pp and CNO reactions within the hydrogen shell is reduced when the dark photon production increases. These effects are compatible with dark photon playing the role of an additional energy sink throughout the RGB. It is remarkable that, also in this case, the envelope overshooting reinforces the dark photon effects, and that the highest variations of helium mass core and central temperature correspond to the model and whith overshooting.
| Age (Gyr) | |||||
|---|---|---|---|---|---|
| 0 | 12.25 | 3.660 | 1.452 | ||
| 900 | 12.23 | 3.660 | 1.441 | ||
| 900 | 12.08 | 3.664 | 1.365 | ||
| 900 | 12.02 | 3.665 | 1.338 | ||
| 500 | 12.21 | 3.661 | 1.431 | ||
| 700 | 12.18 | 3.662 | 1.414 | ||
| 900 | 12.15 | 3.662 | 1.397 | ||
| 12.24 | 3.666 | 1.327 | |||
| 900 | 12.22 | 3.666 | 1.315 | ||
| 900 | 12.07 | 3.669 | 1.232 | ||
| 900 | 12.01 | 3.671 | 1.204 | ||
| 500 | 12.19 | 3.667 | 1.304 | ||
| 700 | 12.17 | 3.668 | 1.286 | ||
| 900 | 12.14 | 3.668 | 1.267 |
The reduction of luminosity shown in Table 1 is in agreement with the contraction of the whole star, indicated by the ratio between the mean and the central densities, in Table 3. Nevertheless, most relevant for the internal structure is the deeper penetration of the convective zone (see also Table 3), which reaches lower regions than in the standard evolutionary models. The combination of the highest and with overshooting produces the deepest penetration of the convective zone and the maximum contraction.
| 0 | 0 | 0.242 | 7.5590 | 1.450 | |
| 0 | 900 | 0.240 | 7.5438 | 1.438 | |
| 0 | 900 | 0.229 | 7.4142 | 1.363 | |
| 0 | 900 | 0.224 | 7.3559 | 1.336 | |
| 0 | 500 | 0.239 | 7.5297 | 1.429 | |
| 0 | 700 | 0.236 | 7.5043 | 1.412 | |
| 0 | 900 | 0.234 | 7.4745 | 1.395 | |
| 0.025 | 0 | 0 | 0.232 | 7.5398 | 1.325 |
| 0.025 | 900 | 0.230 | 7.5240 | 1.313 | |
| 0.025 | 900 | 0.218 | 7.3882 | 1.230 | |
| 0.025 | 900 | 0.214 | 7.3284 | 1.203 | |
| 0.025 | 500 | 0.229 | 7.5091 | 1.302 | |
| 0.025 | 700 | 0.226 | 7.4822 | 1.283 | |
| 0.025 | 900 | 0.223 | 7.4508 | 1.265 |
| C. bottom | |||||
|---|---|---|---|---|---|
| 0 | 1.27 | 0.264 | 0.3573 | ||
| 0 | 900 | 1.33 | 0.262 | 0.3835 | |
| 0 | 900 | 1.79 | 0.251 | 0.7108 | |
| 0 | 900 | 1.98 | 0.247 | 0.3882 | |
| 0 | 500 | 1.38 | 0.261 | 0.4256 | |
| 0 | 700 | 1.48 | 0.259 | 0.4982 | |
| 0 | 900 | 1.58 | 0.256 | 0.5747 | |
| 0.025 | 0 | 0 | 2.35 | 0.258 | 0.3920 |
| 0.025 | 900 | 2.47 | 0.257 | 0.3890 | |
| 0.025 | 900 | 3.41 | 0.246 | 0.3744 | |
| 0.025 | 900 | 3.79 | 0.242 | 0.4376 | |
| 0.025 | 500 | 2.58 | 0.256 | 0.3822 | |
| 0.025 | 700 | 2.77 | 0.263 | 0.3612 | |
| 0.025 | 900 | 2.98 | 0.251 | 0.3275 |
4 The pulsation models
In order to understand the effects of dark photons and overshooting in stellar oscillations, we computed pulsation from our equilibrium models. The aim is to find an asteroseismic observable that can be compared to observations.
We used the oscillation code GYRE (Townsend et al., 2018; Townsend & Teitler, 2013), capable of computing adiabatic and non-adiabatic oscillations. Solar-like pulsations are correctly modelled with the adiabatic solution, so we calculated only adiabatic modes. We studied radial orders (with and ), evaluating the large separation and the second difference (Equation 5). The is an average of the large separation differences obtained around the frequency of maximum power, , which depends on the mass, radius and temperatures of each model at RGB bump (Guggenberger et al., 2017).
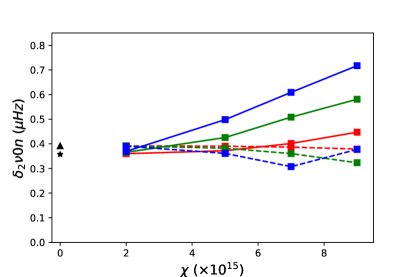
The results for can be seen in Table 3 and in Figure 2, where in both cases we show the maximum values of for the models. In Figure 2, it is observed that, when the combined effects of dark photons and overshooting are considered, the variations of remain in a narrow band. On the contrary, the models where only dark photons are taken into account undergo higher variations, when and increase, in agreement with the previously discussed changes in the structure of the core (Lopes & Turck-Chieze, 1994).
This behaviour can be explained on the following basis. The dark photons are produced in the RGB degenerate core and is sensitive to the structural changes inside this region. We found that over a certain value, overshooting can increase the extension of the convective envelope notably. That implies that the radiative core size is highly reduced and therefore the structural changes due to dark photons have not an appreciable effect on .
It is worth to notice that the lack of appreciable deviations of does not exclude the existence of dark photons, as they could yet occur inside stars, but their influence on would be diminished by the envelope overshooting. However, due to their different impacts on , dark photons and overshooting could be disentangled, with the aid of other observables. Although in this work, we have focused on the average large separation in order to impose constraints on dark photons, we remark that in conjunction with , the average large separation could be used to obtain bounds on overshooting and dark photons simultaneously.
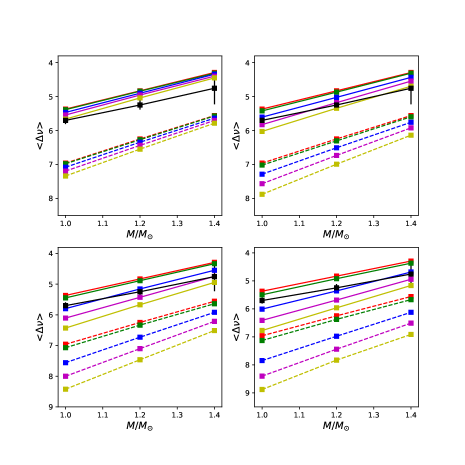
Looking into the impact of dark photons in the large separation, we used a well defined sample of RGB stars at the bump. The most recent and completed search for stars in this evolutionary state is that done by Khan et al. (2018). They used the APOKASC catalogue (Albareti et al., 2017) together with theoretical predictions of the distribution of and in order to locate a number of stars at RGB bump. Their conclusions point to a dependence of with the envelope overshooting considered in the modelling. The result of comparing the observations and our models is shown in Figure 3.
It is noticeable a mismatch between the observations and the predicted values of the average large separations for the oveshooting-only model with . Although it could seem in disagreement with the results reported by Khan et al. (2018), it must be pointed out that in this work the authors cover the range , and they report that the efficiency of overshooting increases with decreasing metallicity. Due to the fact they obtain an average between different metallicities, there are some discrepancies with respect to the results of our work for the overshooting model, which is calculated using the solar metallicity. In addition, some minor offset can arise because Khan et al. used the MESA version 7385, whereas we performed all the calculations with the version 10398. However, we computed models with same parameters definition using MESA v7385 and v10398, and found minimal differences between the values in calculated with both versions. In any case, the offset does not affect the self-consistency of our results and allow us to derive confident conclusions about the combined effects of dark photons and overshooting.
As it can be observed in Figure 3 and in Table 4, where we show the values for some of the models, the effect of dark photons is an increase of the large separation with respect to the reference model as is enhanced. This effect is augmented when higher values of are considered, becoming greater than the observational uncertainties of for RGB stars, at (Mosser et al., 2010). It is remarkable that the reference models without dark photons nor overshoot are not able to reproduce the observations. On the other hand, by means of including dark photons in the models the differences between predictions and observations for the entire mass set can be reduced. In fact, both the envelope overshooting and dark photons increase the large separation prediction.
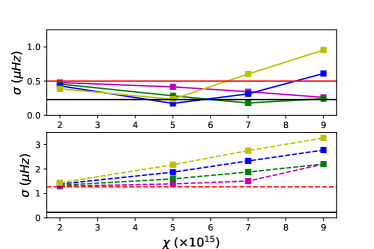
In order to estimate the errors of the predicted <> with respect to the observational data, we computed the standard deviation, , for all the models. A plot of vs and , is shown in Figure 4. The values of for some models are shown in Table 5.
Even considering the combined effect of dark photon and overshooting, some parameters of the dark photon models can be ruled out, like the couple , and , which correspond to an upper bound. The other excluded models are shown in Table 6. These models can be discarded on the basis of the increase of the large separation that they produce. As models like these without overshooting are already out of the 2 error bars of the measured <>, adding even a small fraction of overshooting acts moving the models away. This gives the important consequence that we can constrain the parameter space of dark photon with Asteroseismology even when other ingredients in modelling are uncertain. Moreover, taking into account that the error bars of for the masses and are smaller than for , we suggest the possibility of discarding a broader range of and values, those that imply a mismatch with respect to the observational data beyond confidence levels.
It is worth to notice that previous astrophysics constraints on dark photons present an essential difficulty, since the evolution of a star depends on many physical processes, some of which are not well-defined: having these constraints based uniquely on energy loss by dark photons is not very robust. In this sense, the present work is a considerable progress in obtaining robust astrophysical constraints for the dark photon model, mainly because the new class of stellar models used in this study is very solid. It uses a very well-built and tested stellar evolution code, a well-known set of input macro and microphysics, and up-to-date astronomical and asteroseismology data sets. Furthermore, in the present study the stellar model with dark photon physics includes the feedback of the energy loss by a dark photon in the evolution of the RGB, a process not included in previous astrophysics studies.
| 0 | 0.00 | 5.36 | |
| 0 | 0.00 | 6.96 | |
| 0 | 900 | 5.50 | |
| 0 | 900 | 6.41 | |
| 0 | 900 | 6.77 | |
| 0 | 500 | 5.60 | |
| 0 | 700 | 5.80 | |
| 0 | 900 | 6.01 | |
| 0.025 | 900 | 7.13 | |
| 0.025 | 900 | 8.40 | |
| 0.025 | 900 | 8.88 | |
| 0.025 | 500 | 7.28 | |
| 0.025 | 700 | 7.56 | |
| 0.025 | 900 | 7.84 |
| () | |||
|---|---|---|---|
| 0 | 0.00 | 0.50 | |
| 0 | 0.00 | 1.27 | |
| 0 | 900 | 0.39 | |
| 0 | 900 | 0.60 | |
| 0 | 900 | 0.96 | |
| 0 | 500 | 0.28 | |
| 0 | 700 | 0.17 | |
| 0 | 900 | 0.24 | |
| 0.025 | 900 | 1.44 | |
| 0.025 | 900 | 2.75 | |
| 0.025 | 900 | 3.27 | |
| 0.025 | 500 | 1.60 | |
| 0.025 | 700 | 1.87 | |
| 0.025 | 900 | 2.18 |
| () | ||
|---|---|---|
| 900 | 0.24 | |
| 900 | 0.60 | |
| 900 | 0.96 | |
| 700 | 0.31 | |
| 700 | 0.61 | |
| 500 | 0.24 |
5 Dark photon effects on the RGB tip
In the last step in our work we show the possibility of extending our analysis to another observable of the RGB phase, the RGB-tip luminosity, which corresponds to a local maximum in HR diagram by the He-flash. This observable has been proved to be strongly dependent on the He-core mass, which should be affected by the dark photon cooling, considering the change of the He mass verified previously at the bump for the dark photon models.
In Table 7 we show the variations of He core mass and luminosity at the RGB tip for two different dark photon models, as well as a couple of models, without overshooting and with . The He core mass increases with and , which implies an increase of the luminosity at the RGB tip.
The variations of luminosity we predict, correspond to a variation of magnitude higher than the observational uncertainties for the TRGB of the globular cluster M5. Our theoretical model with and gives a increase of . This variation correspond to a magnitude variation , which is more than twice the observational uncertainties () reported by Serenelli et al. (2017) and Viaux et al. (2013).
As overshooting leaves unaltered the He mass and practically the luminosity at the RGB tip, this may help to constrain the dark photon properties when studied simultaneously with the RGB bump (a work now in progress).
6 Conclusions and future work
In this work we have constrained the parameter space of dark photons using asteroseismic observables. For the first time as far as we know, we have looked into the influence of these particles on the Asteroseismology of stars different to the Sun (placed at the RGB bump), with a focus on the changes in the large frequency separation and the photometric properties of the RGB.
We have found that, at the RGB bump, the dark photons modify the internal structure and the depth of the convective borders, as well as produce an increase of density. This affects the second difference parameters of the models and, as we have verified, the average large separation.
Using the same observational sample as Khan et al. (2018) and comparing the predicted values of with observational data from the APOKASC catalogue we studied the combined effects of the relatively poor constrained envelope overshooting and dark photons cooling on at the RGB bump, finding that both processes reinforce each other. Even though, some combinations of and can be discarded because the models without overshooting are already out of observations. It is so expected that a better calibration of the overshooting at this evolutionary stage would give tighter constraints in the dark-photons parameter space. Regarding the second difference parameter, it decouples the effects of overshooting from those of dark photons. Therefore, combining the second difference with would allow us to put better constrains simultaneously on both quantities: overshooting and dark photons.
Moreover, the RGB tip luminosity (TRGB) is not modified by the different overshooting values. On the contrary different dark photon models affect the helium core mass at TRGB, and consequently the luminosity maximum, producing a magnitude enhancement around , which is higher than the observational uncertainty for Globular Clusters stars. Hence the TRGB can complement the observational information about the bump in order to look into the possible dark photon cooling and constrain the dark photon models. This will be explore in detail in an upcoming work.
The constraint obtained in this work using asteroseismology data is an improvement in relation to the previous astrophysical constraints (dark photon with mass between and and with a kinematic mixing larger that ). This is so, because feedback of the energy loss is included in the evolution of the star, but even more importantly because the high-quality data coming from asteroseismology allows us to have a snapshot of the stellar internal structure today. Unlike previous astrophysical constraints, we can guaranty that the internal structure of the star (which can be strongly affected by energy loss) is consistent (or not) with current asteroseismic data.
Therefore, this article is one of the first works that use high-quality stellar physics models and asteroseismology data to put robust constraints on the free parameters of the dark photon model. A denser grid of models, covering a wider range of parameters (several metallicities, different initial rotation rates, etc), at both the bump and the RGB tip, could be relevant in determining the real uncertainties in the predicted deviations of the large separation (work in preparation).
| 1.0 | 0.0 | 0 | 0 | 0.466 | 3.391 |
| 1.0 | 0.025 | 0 | 0 | 0.466 | 3.394 |
| 1.0 | 0.025 | 700 | 0.474 | 3.435 | |
| 1.0 | 0.0 | 900 | 0.491 | 3.526 |
Acknowledgements
We are grateful to Dr. Saniya Khan and Dr. Andrés Moya for useful explanations and advice about the Asteroseismology of RGB stars, as well as to Diane Haun for improving the quality of the text. We are also thankful to the anonymous referee for many valuable suggestions that helped to improve the manuscript. JCS acknowledges funding support from Spanish public funds for research under projects ESP2017-87676-C5-2-R, and from project RYC-2012-09913 under the ’Ramón y Cajal’ program of the Spanish Ministry of Science and Education. AGH acknowledges funding support from Spanish public funds for research under projects ESP2017-87676-C5-2-R and ESP2015-65712-C5-5-R of the Spanish Ministry of Science and Education.
References
- Abe et al. (2018) Abe K., et al., 2018, Physics Letters B, 787, 153
- Aerts et al. (2010) Aerts C., Christensen-Dalsgaard J., Kurtz D. W., 2010, Asteroseismology
- Albareti et al. (2017) Albareti F. D., et al., 2017, The Astrophysical Journal Supplement Series, 233, 25
- An et al. (2013) An H., Pospelov M., Pradler J., 2013, Physics Letters B, 725, 190
- An et al. (2014) An H., Pospelov M., Pradler J., Ritz A., 2014, preprint, (arXiv:1412.8378)
- Arias et al. (2012) Arias P., Cadamuro D., Goodsell M., Jaeckel J., Redondo J., Ringwald A., 2012, J. Cosmology Astropart. Phys., 2012, 013
- Ayala et al. (2014) Ayala A., Domínguez I., Giannotti M., Mirizzi A., Straniero O., 2014, Physical Review Letters, 113, 191302
- Baglin et al. (2006) Baglin A., Michel E., Auvergne M., COROT Team 2006, in Proceedings of SOHO 18/GONG 2006/HELAS I, Beyond the spherical Sun. p. 34
- Baryakhtar et al. (2018) Baryakhtar M., Huang J., Lasenby R., 2018, Phys. Rev. D, 98, 035006
- Bauer et al. (2018) Bauer M., Foldenauer P., Jaeckel J., 2018, Journal of High Energy Physics, 7, 94
- Bedding et al. (2011) Bedding T. R., et al., 2011, Nature, 471, 608
- Bjork & Chaboyer (2006) Bjork S. R., Chaboyer B., 2006, ApJ, 641, 1102
- Brun et al. (2019) Brun P., Chevalier L., Flouzat C., 2019, Phys. Rev. Lett., 122, 201801
- Cadamuro & Redondo (2010) Cadamuro D., Redondo J., 2010, preprint, (arXiv:1010.4689)
- Cardoso et al. (2018) Cardoso V., Dias Ó. J. C., Hartnett G. S., Middleton M., Pani P., Santos J. E., 2018, J. Cosmology Astropart. Phys., 3, 043
- Casanellas & Lopes (2013) Casanellas J., Lopes I., 2013, ApJ, 765, L21
- Cassisi & Salaris (1997) Cassisi S., Salaris M., 1997, MNRAS, 285, 593
- Cassisi et al. (2016) Cassisi S., Salaris M., Pietrinferni A., 2016, A&A, 585, A124
- Danilov et al. (2018) Danilov M., Demidov S., Gorbunov D., 2018, preprint, (arXiv:1804.10777)
- Döbrich et al. (2014) Döbrich B., Daumiller K., Engel R., Kowalski M., Lindner A., Redondo J., Roth M., 2014, arXiv e-prints,
- Elsworth et al. (2017) Elsworth Y., Hekker S., Basu S., Davies G. R., 2017, MNRAS, 466, 3344
- Fradette et al. (2014) Fradette A., Pospelov M., Pradler J., Ritz A., 2014, Phys. Rev. D, 90, 035022
- Fusi Pecci et al. (1990) Fusi Pecci F., Ferraro F. R., Crocker D. A., Rood R. T., Buonanno R., 1990, A&A, 238, 95
- Gough (1990) Gough D. O., 1990, in Osaki Y., Shibahashi H., eds, Lecture Notes in Physics, Berlin Springer Verlag Vol. 367, Progress of Seismology of the Sun and Stars. p. 283, doi:10.1007/3-540-53091-6
- Guggenberger et al. (2017) Guggenberger E., Hekker S., Angelou G. C., Basu S., Bellinger E. P., 2017, MNRAS, 470, 2069
- Guo et al. (2019a) Guo H.-K., Ma Y., Shu J., Xue X., Yuan Q., Zhao Y., 2019a, arXiv e-prints,
- Guo et al. (2019b) Guo H.-K., Ma Y., Shu J., Xue X., Yuan Q., Zhao Y., 2019b, J. Cosmology Astropart. Phys., 2019, 015
- Holdom (1986) Holdom B., 1986, in Lazarides G., Shafi Q., eds, Particles and the Universe. p. 133
- Horns & Meyer (2012) Horns D., Meyer M., 2012, J. Cosmology Astropart. Phys., 2, 033
- Iben (1968) Iben I., 1968, Nature, 220, 143
- Jaeckel & Ringwald (2010) Jaeckel J., Ringwald A., 2010, Annual Review of Nuclear and Particle Science, 60, 405
- Khan et al. (2018) Khan S., Hall O. J., Miglio A., Davies G. R., Mosser B., Girardi L., Montalbán J., 2018, ApJ, 859, 156
- King et al. (1985) King C. R., Da Costa G. S., Demarque P., 1985, ApJ, 299, 674
- Koch et al. (2010) Koch D. G., et al., 2010, ApJ, 713, L79
- Kopylov et al. (2019) Kopylov A., Orekhov I., Petukhov V., 2019, J. Cosmology Astropart. Phys., 2019, 008
- Kovetz et al. (2018) Kovetz E. D., Cholis I., Kaplan D. E., 2018, arXiv e-prints,
- Kovetz et al. (2019) Kovetz E. D., Cholis I., Kaplan D. E., 2019, Phys. Rev. D, 99, 123511
- Lopes & Turck-Chieze (1994) Lopes I., Turck-Chieze S., 1994, A&A, 290, 845
- Lopes et al. (2011) Lopes I., Casanellas J., Eugénio D., 2011, Phys. Rev. D, 83, 063521
- Mosser et al. (2010) Mosser B., et al., 2010, A&A, 517, A22
- Okun (1982) Okun L. B., 1982, Zhurnal Eksperimentalnoi i Teoreticheskoi Fiziki, 83, 892
- Paxton et al. (2011) Paxton B., Bildsten L., Dotter A., Herwig F., Lesaffre P., Timmes F., 2011, ApJS, 192, 3
- Paxton et al. (2013) Paxton B., et al., 2013, ApJS, 208, 4
- Paxton et al. (2015) Paxton B., et al., 2015, ApJS, 220, 15
- Paxton et al. (2018) Paxton B., et al., 2018, ApJS, 234, 34
- Paxton et al. (2019) Paxton B., et al., 2019, ApJS, 243, 10
- Raffelt (1999) Raffelt G. G., 1999, in D’Olivo J. C., López Castro G., Mondragón M., eds, American Institute of Physics Conference Series Vol. 490, American Institute of Physics Conference Series. pp 125–162, doi:10.1063/1.1301384
- Raffelt & Dearborn (1987) Raffelt G. G., Dearborn D. S. P., 1987, Phys. Rev. D, 36, 2211
- Redondo (2008) Redondo J., 2008, J. Cosmology Astropart. Phys., 7, 008
- Redondo & Postma (2009) Redondo J., Postma M., 2009, J. Cosmology Astropart. Phys., 2009, 005
- Redondo & Raffelt (2013) Redondo J., Raffelt G., 2013, JCAP, 1308, 034
- Ricker et al. (2015) Ricker G. R., et al., 2015, Journal of Astronomical Telescopes, Instruments, and Systems, 1, 014003
- Riello et al. (2003) Riello M., et al., 2003, A&A, 410, 553
- Scott et al. (2009) Scott P., Fairbairn M., Edsjö J., 2009, MNRAS, 394, 82
- Serenelli et al. (2017) Serenelli A., Weiss A., Cassisi S., Salaris M., Pietrinferni A., 2017, A&A, 606, A33
- Silva Aguirre et al. (2017) Silva Aguirre V., et al., 2017, ApJ, 835, 173
- Sivertsson & Gondolo (2011) Sivertsson S., Gondolo P., 2011, ApJ, 729, 51
- Spolyar et al. (2008) Spolyar D., Freese K., Gondolo P., 2008, Physical Review Letters, 100, 051101
- Suzuki et al. (2015) Suzuki J., Horie T., Inoue Y., Minowa M., 2015, Journal of Cosmology and Astro-Particle Physics, 2015, 042
- Thomas (1967) Thomas H.-C., 1967, Z. Astrophys., 67, 420
- Townsend & Teitler (2013) Townsend R. H. D., Teitler S. A., 2013, MNRAS, 435, 3406
- Townsend et al. (2018) Townsend R. H. D., Goldstein J., Zweibel E. G., 2018, MNRAS, 475, 879
- Viaux et al. (2013) Viaux N., Catelan M., Stetson P. B., Raffelt G. G., Redondo J., Valcarce A. A. R., Weiss A., 2013, Physical Review Letters, 111, 231301
- Vinyoles et al. (2015) Vinyoles N., Serenelli A., Villante F. L., Basu S., Redondo J., Isern J., 2015, J. Cosmology Astropart. Phys., 10, 015
- Weinberg (1978) Weinberg S., 1978, Physical Review Letters, 40, 223
- Wilczek (1978) Wilczek F., 1978, Physical Review Letters, 40, 279
- XMASS Collaboration et al. (2018) XMASS Collaboration et al., 2018, preprint, (arXiv:1807.08516)
- Zoccali et al. (1999) Zoccali M., Cassisi S., Piotto G., Bono G., Salaris M., 1999, ApJ, 518, L49