Dielectric properties of the pore solution in cement-based materials
Abstract
Dielectric properties are intimately related to the content and composition of the liquid phase present in micro- and mesoporous materials. The presence of ions is recognized to affect the dielectric response of electrolytes in a complex way that depends on the ion-water and ion-ion interactions and respective concentrations. Pore solutions in cement-based materials are complex and age-dependent exhibiting different ion pair states, which make them an interesting candidate for the study of the complex pore solution found in geomaterials in general. Here, we study the dielectric properties of bulk aqueous solutions representative of the pore solution found in cement-based materials using molecular dynamics simulations. Broadband dielectric spectra and frequency-dependent conductivities are provided. A mean field upscaling strategy is deployed to compute the dielectric response at cement-paste scale. In cement-based materials, the measurement of dielectric properties can be used for non-destructive monitoring of concrete structures conditions and to unravel details of the hierarchical pore structure of the material, notably at early-age when the microstructure of the material changes significantly. Our results can be used in the interpretation of high frequency electromagnetic methods, such as ground-penetrating radar, enhancing the quality of interpretation and improving the confidence in the corresponding results.
I Introduction
High Frequency Electromagnetic (HF-EM) method have been deployed last decades to assess water content of soil and rocks [1, 2, 3], as well as man made geomaterials such as cementitious materials (e.g. [4, 5, 6, 7, 8]). Among these methods, one can quote L-band remote sensing [9], Ground Penetrating Radar (GPR) [10], capacitive probe [11], etc. The success of such methods is caused by the dipolar character of the water molecules resulting in a high permittivity in comparison to other phases such as solid particles or gas voids. However, evidence suggests that the frequency-dependent dielectric permittivity contains far more information than water content only: structure [12], density [13], mineralogy, cohesion forces on the pore solution [14] and even material strength may leave distinct signatures that could potentially be quantified. Nevertheless, despite its great success, HF-EM methods are still confronted with theoretical challenges. Interaction of the pore solutions and solid phases leads to strong contributions to the EM properties. These interactions are not well understood at the moment: theoretical studies are urgently needed.
As for other physical properties [15, 16, 17, 18], micromechanics can be applied to upscale the dielectric permittivity of heterogeneous materials [19, 20]. However, important information concerning the behavior of the constituent phases is required to provide reliable predictions of the effective dielectric permittivity of nanoporous materials, is lacking. Dielectric properties are recognized to be dependent on pore size [21, 22] and pore solution composition [23, 24, 25]. The relative static dielectric permittivity of aqueous solutions are in general one order of magnitude larger (e.g. for bulk water is [26] =80.103 at 20∘C ) than the dielectric permittivity of solid phases. Therefore, the precise quantification of the dielectric response of the pore solution is crucial to upscale the dielectric properties and to interpret the experimental spectra of porous materials.
In cement-based materials, the composition of the pore solution is crucial to the stability and assemblage of phases in these materials [27]. Therefore, cement hydration processes and chemical alterations of cement-based materials (due, for instance, to durability issues) are closely related to the pore solution composition. The composition of the pore solution depends on the composition of the binder (e.g. ordinary Portland cement, alternative cements, and Supplementary Cementitious Materials (SCM) a), age and temperature [28, 29, 27]. Atomistic simulations have been successfully used to unveil the details of water interaction in cement-based materials, specially in calcium silicate hydrates (e.g.[30, 31, 32, 33, 34, 35]). Recently, the authors have studied for the first time the dynamics and structure of bulk aqueous solutions representative of the pore solution found in cement-based materials through molecular dynamics simulations [36]. The repercussions of the dynamics and structure differences observed in these pore solution on the dielectric response are still to be quantified.
Here, the dielectric properties of the pore solution of cement-based materials are computed taking into account the variability of ionic concentrations in aqueous solutions. To do so, we perform MD simulations to compute the dielectric response of the pore solutions. The composition of the pore solutions, atomic configurations and force fields, which are recalled in this article, are taken from Honorio et al. [36]. For the first time, the dielectric spectra of cement-based materials pore solutions are computed accounting for the age-dependent composition variations. We observe that the Cole-Cole equation fits well the dielectric spectra obtained for all pore solutions. Finally, we quantify the effect of the variability of the dielectric response of the pore solution on the effective response of cement-based materials using Monte Carlo Micromechanics [37]. Our results contribute to a better understanding of the electromagnetic behavior of cement-based materials and can be readily used in the interpretation of dielectric probing of cement-based materials, enhancing the performance of HF-EM testing and improving the confidence in the corresponding results.
II Theory and Calculation
II.1 Dielectric response and conductivity from molecular simulations
For a system with particles with charge , the total system polarization is defined as the sum of the the polarization (or dipole moment) of the each particle at time [38]:
| (1) |
where is the position of the (center of) particle .
The total system polarization is related to the electric field via the complex frequency-dependent dielectric susceptibility by
| (2) |
where is the vacuum permittivity. The dielectric susceptibility can be computed from the auto-correlation of equilibrium polarization fluctuations using [39, 24]:
| (3) |
where and are the volume and temperature of the system, respectively; is the Boltzmann constant and is the time-derivative of the total polarization.
For a salt aqueous solution, the total polarization is the sum of the contributions of the water and ionic polarizations: .
The ionic current is related to the ionic polarization by: . This ionic current is linked to the electric field via the frequency-dependent ionic conductivity by
| (4) |
| (5) |
Following Rinne et al. [24, 23], we define the following auto- and cross-correlations functions of the water polarization and ionic current:
| (6) |
| (7) |
| (8) |
from which the water, ion and ion-water interaction contributions on dielectric susceptibility and frequency-dependent ionic conductivity can be quantified.
Accordingly, the regularized susceptibility can be decomposed into three separate contributions:
| (9) |
where
| (10) |
| (11) |
| (12) |
The frequency-dependent ionic conductivity can be decomposed into the two terms:
| (13) |
with
| (14) |
| (15) |
Therefore, the static conductivity can be computed via .
II.2 Molecular modeling of the pore solutions
II.2.1 Pore solutions in cement-based materials: variability and definition of scenarios
Here, we study the bulk aqueous solutions mimicking the pore solutions in cement-based materials as in ref. [36]. One can legitimately raise the question of the relevance of analyzing bulk solutions to get insights on pore solution behavior. As previously discussed [36], the most significant part of the dynamics of water and ions in pore solution within cement-based materials can be described by the dynamics of the fluid portions less affected by pore walls. The ionic transport occurring in the pore zones affected by the interface (Stern layer) is reported to be negligible when compared to transport in the bulk pore, especially for aqueous solutions with a concentration similar to pore solutions in cement-based materials [41, 42]. Furthermore, atomistic simulations of water confined in mesopores show that for a large portion of these pores the fluid behaves as a bulk fluid (e.g [43]). The smaller pore size found in cement-based materials is the inter-layer calcium silicate hydrates (C-S-H) pores of approximately 0.95 nm [44], but C-S-H gels exhibit also a mesoporosity ranging from few up to tens of nanometers. Specific techniques [21, 22] are required to study the water confined in pore as small as C-S-H inter-layer pores. Regarding larger pores, though, molecular simulations of C-S-H and other mesoporous materials show that for pores as small as 5 nm, in a major portion of the pore the fluid shows bulk-like behavior [35, 43, 45]. These arguments show that a large portion of the fluids in cement-based materials porosity is expected to exhibit bulk-like behavior. Furthermore, most HF-EM remote sensing method is carried out in a frequency range around 1 GHz. In this frequency range, the effect of free water (or bulk water) is predominant. It was shown by previous studies that adsorbed water (chemically or hydrogen-bond) will manifest at for lower frequency [46, 47]. Therefore, critical physical insights that can be relevant to the understanding of the dielectric response of cement-based materials might be inferred from the analysis of bulk solutions representative of the pore solutions.
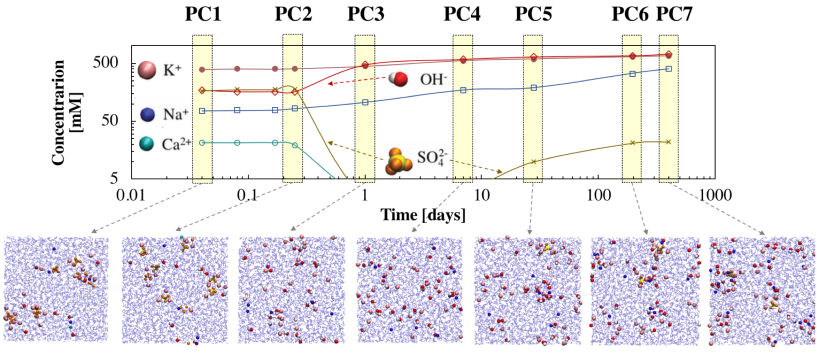
The composition of the pore solutions is based on the experimental data provided by Lothenbach et al. [48] for an ordinary Portland cement (PC) systems in a formulation with a water-to-cement ratio of 0.4. Seven scenarios PC1-PC7 corresponding to various ages are chosen to be simulated. The species with a concentration below 5 mM are not taken into account. Table 1 shows the compositions of the pore solutions studied here and the associated age in ordinary Portland cement (PC) systems. The ionic concentrations were adjusted to comply with the electroneutrality of the simulated system. Figure 1 shows the evolution of the concentration of the ionic species plotted as a function of the age. For each age, we present a snapshot of the atomic configurations in a system equilibrated in a canonical simulation at 300K.
| Sim. | H2O | Na+ | K+ | Ca2+ | SO | OH- | |
|---|---|---|---|---|---|---|---|
| [days] | |||||||
| PC1 | 0.04 | 2767 | 4 | 20 | 1 | 8 | 10 |
| PC2 | 0.25 | 2767 | 4 | 20 | 1 | 9 | 8 |
| PC3 | 1 | 2767 | 5 | 20 | 0 | 0 | 25 |
| PC4 | 7 | 2767 | 9 | 24 | 0 | 0 | 33 |
| PC5 | 28 | 2767 | 9 | 27 | 0 | 1 | 34 |
| PC6 | 197 | 2767 | 12 | 29 | 0 | 2 | 37 |
| PC7 | 400 | 2767 | 16 | 30 | 0 | 2 | 42 |
II.2.2 Force fields and simulation details
A detailed description of the force field parameters is provided in a previous work [36]. The interactions among all the species in the system are modeled by a sum of non-bonded (van der Waals and electrostatic) and bonded (angle and bonds for OH groups) interactions. The van der Waals interactions are described either by the Lennard-Jones (12-6) potential for interactions between water (SPC/E [49]), hydroxide and monatomic ions or by the Buckingham potential for interactions involving sulfates. The force field parameters are provided as Supporting Information. Long-range van der Waals interactions are treated with tail corrections. Coulomb potential describes the electrostatic contribution. Ewald sum method is used to cope with long-range electrostatic interactions. Water and hydroxide bonds and water angles are constrained by SHAKE algorithm. Sulfate ions are constrained using RIGID algorithm.
We use LAMMPS [50] to perform the simulations. Initial atomic configurations were obtained by randomly placing the ions in the simulation box following the composition in Tab.1. Next, a microcanonical (NVE) simulation with an imposed maximum displacement of 0.01 Å per atom was performed during 1 ps to cope with possible overlapping atoms. Then, the system was equilibrated during 0.25 ns at 300 K in a canonical simulation (NVT). Nosé-Hoover thermostat is used for equilibration and production with a damping parameter of 100 timesteps. The dipole moments of water and all ions were computed separately each 25 fs in an NVT simulation with a 1 fs timestep during 1.0 ns. As shown in the Supporting Information, 1 ns seems enough to sample the fluctuations of the water polarization and ionic currents. The effects of finite size and fictitious forces from Nosé-Hoover thermostat are discussed in the Supporting Information.
III Results and Discussion
Figure 2 (a)-(e) shows the water solvation shells of the ions present in the pore solutions PC1-PC7. As discussed previously [36], cation-water and hydroxide-water structuration are similar in all pore solutions studied; whereas sulfates-water pair exhibits structure variations according to the pore solution. We compute the ion pair states following contact ion pairs (CIP), single solvent-separated ion pairs (SIP) and doubly solvent-separated ion pairs (DSIP) configurations depicted in Fig. 2 (f). DSIP configurations are prevalent in most of the cation-hydroxide pairs while CIP configurations are prevalent in most of the cation-sulfate pairs.
Three main stages can be identified regarding the ionic composition of the pore solution for a given cement system [36]:
-
•
very early age up to setting (first hours): PC1 and PC2;
-
•
early-age related to property development (within the first days): PC3 and PC4;
-
•
late stage associated and the service life of cement-based materials: PC5 to PC7.
such classification has been useful in linking the dynamics of ions to the electrical properties of cement-based materials [37]. As shown in Fig. 2 (g) and (h), ion pair states seems to obey this classification in most cases.
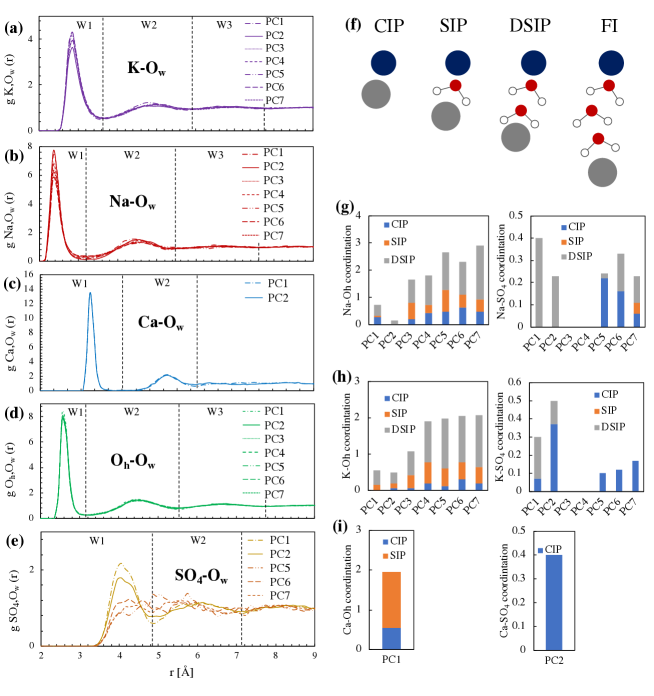
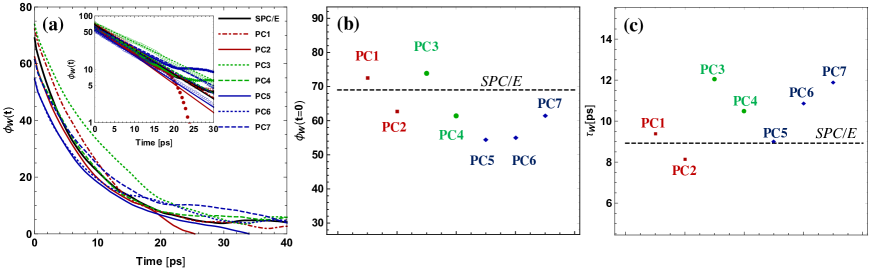
Figure 3 (a) shows the auto-correlation function of the water polarization for all the pore solutions studied and for (pure) SPC/E water. This auto-correlation function is the most relevant for the computation of the dielectric spectra [24]. In all cases, exponential decay is observed. Due to noise, exhibit negative values for times exceeding 25 to 60 ps for all solutions. We fit with the expression , where is the characteristic relaxation time. The values of and are plotted for each pore solution and for SPC/E water in Figs. 3 (b) and (c), respectively. No clear tendency is observed in the values for the pore solution concerning the three stages classification or the similarity with respect to SPC/E water values.
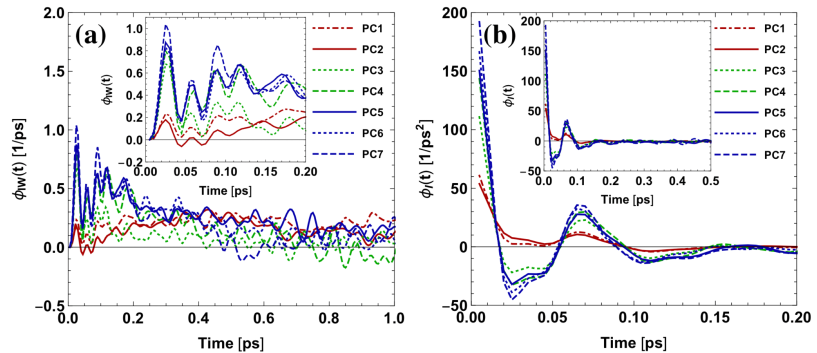
Ion-water cross-correlation and ion auto-correlation functions are presented in Figs. 4 (a) and (b), respectively. Both functions present a high-frequency oscillatory behavior with the oscillations being more strongly damped in the case of . Strong dampening has been also observed in NaCl, NaI, NaBr and NaF aqueous solutions [24]. The ion auto-correlation functions of the pore solution at the very early-age (PC1 and PC2) show an oscillatory behavior with lower amplitude when compared to the other solutions; the larger amplitudes are observed with the solution at later stages (PC5-PC7). As observed to other aqueous solutions (NaCl, NaI, NaBr and NaF), ion-water cross-correlation function present an initial steep increase followed by an initial decay and a subsequent slower relaxation. Compared to the other simpler aqueous solutions, the pore solution shows persistent oscillations even for times above 1 ps.
III.1 Dielectric spectra
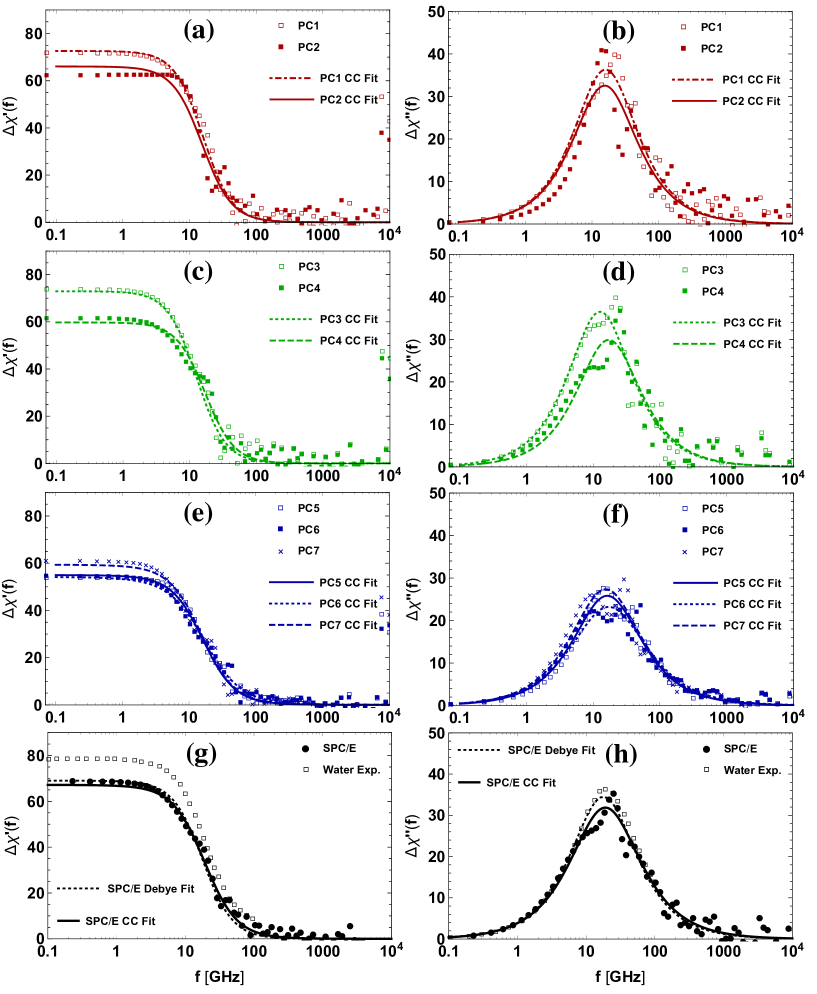
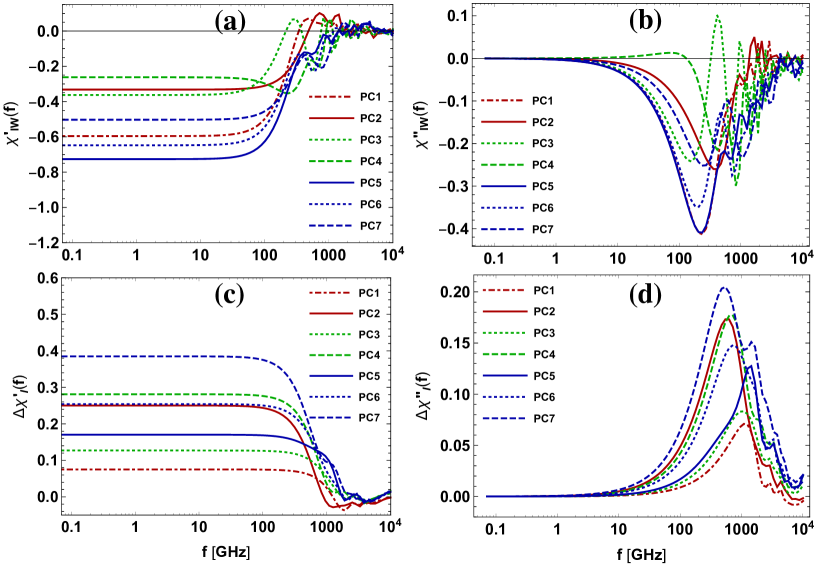
The dielectric spectra of the pore solutions and SPC/E including all contributions are shown in Fig. 5 together with the respective Cole-Cole fits. The water contribution is predominant (see the Supporting Information for the results without ion contributions). The ion-water dielectric contributions on the dielectric spectra of the pore solutions are shown in Fig. 6 (a) and (b), respectively. The real and the imaginary parts of the DC-conductivity dielectric ion contribution for all pore solution are shown in Fig. 6 (c) and (d), respectively.
| (16) |
where and are, respectively, the Cole-Cole amplitude and characteristic relaxation time; and, is an exponent parameter ranging from 0 to 1 (=0 corresponding to Debye model). We adopt =1 since the force fields employed in MD simulation do not comprise atomic polarization. To fit simultaneously the real and imaginary parts of the dielectric spectrum, we minimize the function , where refers to the spectrum data to be fitted and denotes the complex conjugate.
The parameters of Cole-Cole fits are gathered in Tab. 2. Water simulation and experimental data from the literature are also provided. The static dielectric permittivity of SPC/E water is known to be inferior to the experimental value. We obtain 69.0 for SPC/E water, which is in agreement with other values from the literature (e.g.[53] 67 10). In spite of its simplicity, the SPC/E model shows a remarkable agreement with experiments.
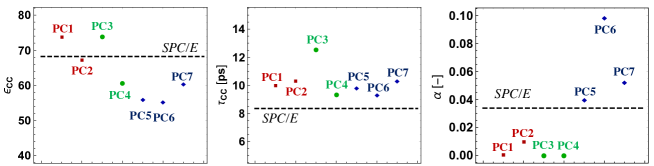
Figure 7 shows the parameters of Cole-Cole fits. The amplitude of Cole-Cole fits is inferior to that of SPC/E water for pore solution at late ages (PC5-PC7). Cole-Cole relaxation times of all pore solutions exceed that of SPC/E water, with very early-age (PC1-PC2) and late ages (PC5-PC7) pore solution exhibiting similar . The parameter of very early-age (PC1-PC2) and early-age (PC3-PC4) pore solutions are closer to 0 (i.e. a Debye-like behavior) than the values of late ages solutions (PC5-PC7).
In agreement with our results, recent experimental measurements of the dielectric response of a concrete pore solution show that the real part remains almost constant for frequencies up, at least, to 2 GHz [54]. The same authors also showed that a Debye model can describe fairly well the dielectric spectra of the pore solution, which is also consistent with our results that show values of close to zero.
| PC1 | 73.6 | 9.97 | 0.000 |
| PC2 | 67.1 | 10.26 | 0.009 |
| PC3 | 73.9 | 12.55 | 0.000 |
| PC4 | 60.7 | 9.33 | 0.000 |
| PC5 | 56.0 | 9.80 | 0.040 |
| PC6 | 55.2 | 9.33 | 0.098 |
| PC7 | 60.4 | 10.30 | 0.052 |
| SPC/E 111This work. | 68.2 | 8.35 | 0.033 |
| SPC/E 222Buchner et al. [51] experiments. | 78.4 | 8.27 | 0.000 |
| SPC/E 333Rinne et al. [24] MD simulations. | 69.9 | 10.72 | 0.014 |
III.2 Electrical conductivity
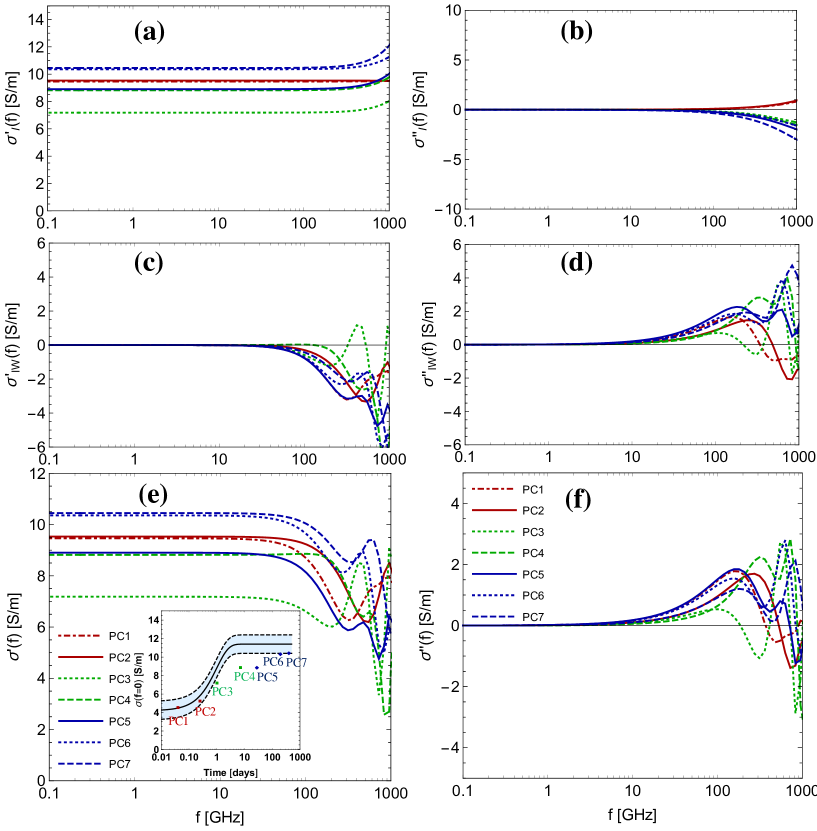
Figure 8 shows the real and imaginary parts of the frequency-dependent conductivity of the pore solutions. The ion-ion and ion-water contributions are shown. Our results are in agreement with the static conductivity reported for ordinary PC systems with a water-to-cement ratio of 0.4, which can be described by a single master curved weighted by the as discussed by Honorio et al. [37]. The conductivities of the pore solutions are similar to the static value up to frequencies on the order of 10 GHz. AT higher frequencies both ion-ion and ion-water contributions exhibit oscillating responses with respect to the frequency.
III.3 Upscaling the effects of the variability pore solution dielectric response
The homogenization of the dielectric permittivity and electrical conductivity is analogous to the homogenization of the thermal conductivity and diffusivity [20]. Bruggeman (or the self-consistent) scheme has been shown to provide a good estimate of the effective electrical conductivity of cement-pastes by capturing the transition from a liquid to a solid matrix during cement hydration [37].
In a polycrystalline-like morphology, for a -phase heterogeneous materials with isotropic equiaxed inclusions randomly distributed in representative elementary volume, the Bruggeman (or Self-Consistent) estimate of the effective electrical permittivity can be computed from the implicit formula [20]:
| (17) |
for all phases with volume fraction and dielectric permittivity .
To upscale the effective permittivity of the cement paste we use the Cole-Cole fits with the parameters in Tab. 2 to describe the dielectric permittivity of each pore solution . Powers cement hydration model [55] is used to estimate the evolution of the capillary porosity (i.e. the volume fraction associated to the pore solution phase) in the system:
| (18) |
where the degree of hydration can be described by the sigmoid for in days as in ref. [37], and is the initial porosity computed from the and densities of water and cement ( and , respectively). It is worth to note that this approach does not take into account interface processes that will dominate the spectra around kHz and MHz range [46, 47]. Nevertheless, as far as the authors know, it is the first attempt to use effective medium theory with realistic data on pore solution dielectric response for the modeling of HF-EM properties of cement paste.
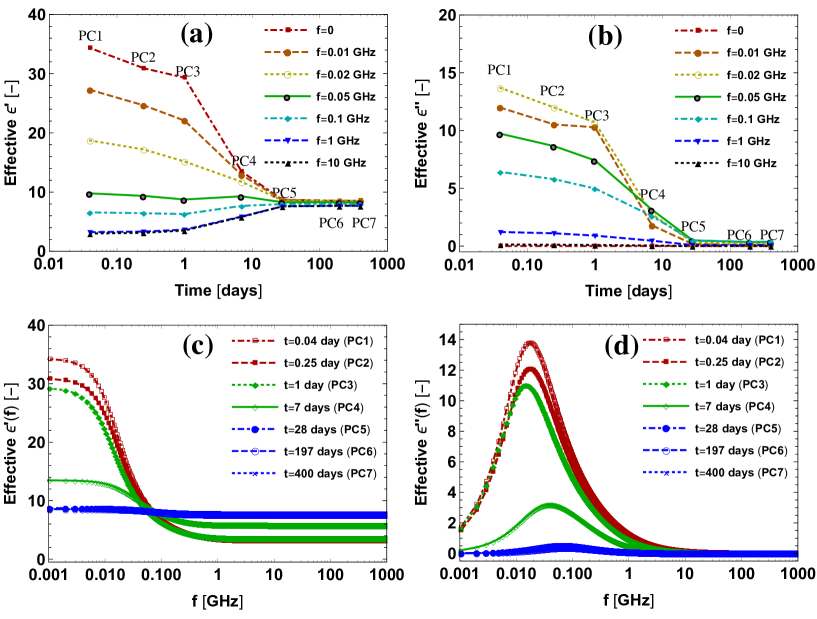
The real and imaginary parts of the effective permittivity of the cement paste with a water-to-cement ratio () of 0.4 are shown in Fig. 9. The frequency-dependence of both real and imaginary parts are very well pronounced in the range 0 to 1 GHz, especially at the early-ages (). The static values of the real part decrease with age. The imaginary part reaches its maximum at a frequency in the range 0.01 to 0.2 GHz and decreases with age. These results indicate that experimental measurements of effective permittivity can be used to discriminate the age of the cement paste or, using cross-property relations, to follow property development at early-age.
IV Conclusions
The dielectric spectra and frequency-dependent conductivities of bulk aqueous solutions representative of the pore solution found in cement-based materials were computed for the first time using classical molecular dynamics simulations. Our main conclusions are as follows:
-
•
Classical molecular dynamics simulations provide a powerful tool to compute the dielectric response of pore solutions with complex composition. Pore solutions in cement-based materials are cement type, age, and temperature-dependent. The dielectric spectra and frequency-dependent conductivities can be computed for various scenarios, which provide important input to the interpretation of the dielectric response of porous materials with complex fluid phase composition.
-
•
The age-dependent composition of the pore solutions is reflected in the dielectric spectra. In terms of static susceptibility values, the difference between the maximum (PC3) and minimum (PC6) is of approximately 20. This result shows that accounting for the composition variability of the pore is crucial to obtain the precise dielectric response of cement-based materials. The results provided in this paper can readily be used to upscale the dielectric response of ordinary Portland cement-based materials. Further studies are, though, necessary to quantify the dielectric response of highly confined water in the micropores found in C-S-H and AF-phases encountered in these materials. Again, molecular dynamics simulations can be a powerful tool in such an analysis.
-
•
Cole-Cole fits provide a reasonable description of the dielectric spectra of the pore solution studied. For pore solutions at the early ages (PC1-PC4), the Debye model seems sufficient to capture the real and imaginary parts of the spectrum (ie. parameter in Cole-Cole model close to 0). As expected, the water contribution to the dielectric spectra is the most significant. The ion-ion and ion-water contributions are one to two orders inferior to the water contribution.
-
•
The age-dependent dielectric response of the pore solution can be used to upscale the dielectric response of cement pastes using effective medium approaches. Both the static values of the real part and the peak in the imaginary part when plotted against the frequency decreases with the age. These results show that the measurement of the (effective) dielectric response can be deployed to discriminate the age of cement pastes.
Our results can be used in the interpretation of dielectric probing of cement-based materials, enhancing the performance of non-destructive monitoring of concrete structures conditions such as radar testing and improving the confidence in the corresponding results. Improvements on the detection of cracking and the diagnostic of structures pathologies (e.g. alkali-silica reactions, delayed ettringite formation, etc) can be envisioned using HF-EM techniques. The next step will be focused on the modeling of the dielectric profile [22] of confined electrolytes in cement hydrates micro- and meso-pores. This will bring fundamental knowledge about the electromagnetic properties of confined (bound) water in cement-based materials micro- and meso-pores, which is still not understood. Thus, a more realistic model of HF-EM properties of cement-based material could then be developed.
References
- Topp et al. [1980] G. C. Topp, J. L. Davis, and A. P. Annan, Electromagnetic determination of soil water content: Measurements in coaxial transmission lines, Water Resources Research 16, 574 (1980).
- Santamarina et al. [2001] J. C. Santamarina, A. Klein, and M. A. Fam, Soils and waves:Particulate materials behavior, characterization and process monitoring, Journal of Soils and Sediments 1, 130 (2001).
- Bore et al. [2018] T. Bore, M. Schwing, M. L. Serna, J. Speer, A. Scheuermann, and N. Wagner, A New Broadband Dielectric Model for Simultaneous Determination of Water Saturation and Porosity, IEEE Transactions on Geoscience and Remote Sensing 56, 4702 (2018).
- Klysz and Balayssac [2007] G. Klysz and J. P. Balayssac, Determination of volumetric water content of concrete using ground-penetrating radar, Cement and Concrete Research 37, 1164 (2007).
- Rhim and Buyukozturk [1998] H. C. Rhim and O. Buyukozturk, Electromagnetic Properties of Concrete at Microwave Frequency Range, Materials Journal 95, 262 (1998).
- Laurens et al. [2002] S. Laurens, J. P. Balayssac, J. Rhazi, and G. Arliguie, Influence of concrete relative humidity on the amplitude of Ground-Penetrating radar (GPR) signal, Materials and Structures 35, 198 (2002).
- Van Beek, A. and Milhorst, M.A. [2000] Van Beek, A. and Milhorst, M.A., Dielectric measurements to characterize the microstructural changes of young concrete, HERON, vol. 44 (1), 2000 (2000).
- Cataldo et al. [2018] A. Cataldo, E. D. Benedetto, G. Cannazza, E. Piuzzi, and E. Pittella, TDR-Based Measurements of Water Content in Construction Materials for In-the-Field Use and Calibration, IEEE Transactions on Instrumentation and Measurement 67, 1230 (2018).
- Marino et al. [2001] C. M. Marino, C. Panigada, and L. Busetto, Airborne hyperspectral remote sensing applications in urban areas: asbestos concrete sheeting identification and mapping, in IEEE/ISPRS Joint Workshop on Remote Sensing and Data Fusion over Urban Areas (Cat. No.01EX482) (2001) pp. 212–216.
- Bungey [2004] J. H. Bungey, Sub-surface radar testing of concrete: a review, Construction and Building Materials 18, 1 (2004).
- Bore et al. [2013] T. Bore, D. Placko, F. Taillade, and M. Himbert, Capacitive Sensor for Measuring the Filled of Post-Tensioned Ducts. Experimental Setup, Modeling and Signal Processing, IEEE Sensors Journal 13, 457 (2013).
- Tang et al. [2017] S. Tang, X. Cai, Z. He, W. Zhou, H. Shao, Z. Li, T. Wu, and E. Chen, The review of early hydration of cement-based materials by electrical methods, Construction and Building Materials 146, 15 (2017).
- Drnevich et al. [2005] V. P. Drnevich, A. K. Ashmawy, X. Yu, and A. M. Sallam, Time domain reflectometry for water content and density of soils: study of soil-dependent calibration constants, Canadian Geotechnical Journal 42, 1053 (2005).
- Escorihuela et al. [2007] M. J. Escorihuela, P. d. Rosnay, Y. H. Kerr, and J. Calvet, Influence of Bound-Water Relaxation Frequency on Soil Moisture Measurements, IEEE Transactions on Geoscience and Remote Sensing 45, 4067 (2007).
- Honorio et al. [2018] T. Honorio, B. Bary, and F. Benboudjema, Thermal properties of cement-based materials: Multiscale estimations at early-age, Cement and Concrete Composites 87, 205 (2018).
- Bernard et al. [2003] O. Bernard, F.-J. Ulm, and E. Lemarchand, A multiscale micromechanics-hydration model for the early-age elastic properties of cement-based materials, Cement and Concrete Research 33, 1293 (2003).
- Stora et al. [2008] E. Stora, B. Bary, and Q.-C. He, On Estimating the Effective Diffusive Properties of Hardened Cement Pastes, Transport in Porous Media 73, 279 (2008).
- Wyrzykowski et al. [2017] M. Wyrzykowski, J. Sanahuja, L. Charpin, M. Königsberger, C. Hellmich, B. Pichler, L. Valentini, T. Honório, V. Smilauer, K. Hajkova, G. Ye, P. Gao, C. Dunant, A. Hilaire, S. Bishnoi, and M. Azenha, Numerical benchmark campaign of COST Action TU1404 – microstructural modelling, RILEM Technical Letters 2, 99 (2017).
- Bruggeman [1935] D. a. G. Bruggeman, Berechnung verschiedener physikalischer Konstanten von heterogenen Substanzen. I. Dielektrizitätskonstanten und Leitfähigkeiten der Mischkörper aus isotropen Substanzen, Annalen der Physik 416, 636 (1935).
- Torquato [2002] S. Torquato, Random Heterogeneous Materials: Microstructure and Macroscopic Properties (Springer Science & Business Media, 2002).
- Ballenegger and Hansen [2005] V. Ballenegger and J.-P. Hansen, Dielectric permittivity profiles of confined polar fluids, The Journal of Chemical Physics 122, 114711 (2005).
- Bonthuis et al. [2011] D. J. Bonthuis, S. Gekle, and R. R. Netz, Dielectric Profile of Interfacial Water and its Effect on Double-Layer Capacitance, Physical Review Letters 107, 10.1103/PhysRevLett.107.166102 (2011).
- Rinne et al. [2014a] K. F. Rinne, S. Gekle, and R. R. Netz, Ion-Specific Solvation Water Dynamics: Single Water versus Collective Water Effects, The Journal of Physical Chemistry A 118, 11667 (2014a).
- Rinne et al. [2014b] K. F. Rinne, S. Gekle, and R. R. Netz, Dissecting ion-specific dielectric spectra of sodium-halide solutions into solvation water and ionic contributions, The Journal of Chemical Physics 141, 214502 (2014b).
- Schaaf and Gekle [2015] C. Schaaf and S. Gekle, Dielectric response of the water hydration layer around spherical solutes, Physical Review E 92, 10.1103/PhysRevE.92.032718 (2015).
- Malmberg and Maryott [1956] C. Malmberg and A. Maryott, Dielectric constant of water from 0 to 100 C, Journal of Research of the National Bureau of Standards 56, 1 (1956).
- Vollpracht et al. [2016] A. Vollpracht, B. Lothenbach, R. Snellings, and J. Haufe, The pore solution of blended cements: a review, Materials and Structures 49, 3341 (2016).
- Lothenbach and Winnefeld [2006] B. Lothenbach and F. Winnefeld, Thermodynamic modelling of the hydration of Portland cement, Cement and Concrete Research 36, 209 (2006).
- Lothenbach et al. [2008a] B. Lothenbach, T. Matschei, G. Möschner, and F. P. Glasser, Thermodynamic modelling of the effect of temperature on the hydration and porosity of Portland cement, Cement and Concrete Research 38, 1 (2008a).
- Pellenq et al. [2008] R. J. M. Pellenq, N. Lequeux, and H. van Damme, Engineering the bonding scheme in C–S–H: The iono-covalent framework, Cement and Concrete Research Special Issue — The 12th International Congress on the Chemistry of Cement. Montreal, Canada, July 8-13 2007, 38, 159 (2008).
- Youssef et al. [2011] M. Youssef, R. J.-M. Pellenq, and B. Yildiz, Glassy Nature of Water in an Ultraconfining Disordered Material: The Case of Calcium−Silicate−Hydrate, Journal of the American Chemical Society 133, 2499 (2011).
- Bonnaud et al. [2016] P. A. Bonnaud, C. Labbez, R. Miura, A. Suzuki, N. Miyamoto, N. Hatakeyama, A. Miyamoto, and K. J. V. Vliet, Interaction grand potential between calcium–silicate–hydrate nanoparticles at the molecular level, Nanoscale 8, 4160 (2016).
- Ozcelik and White [2016] V. O. Ozcelik and C. E. White, Nanoscale Charge-Balancing Mechanism in Alkali-Substituted Calcium–Silicate–Hydrate Gels, The Journal of Physical Chemistry Letters 7, 5266 (2016).
- Masoumi et al. [2019] S. Masoumi, S. Zare, H. Valipour, and M. J. Abdolhosseini Qomi, Effective Interactions between Calcium-Silicate-Hydrate Nanolayers, The Journal of Physical Chemistry C 123, 4755 (2019).
- Honorio [2019] T. Honorio, Monte Carlo Molecular Modeling of Temperature and Pressure Effects on the Interactions between Crystalline Calcium Silicate Hydrate Layers, Langmuir 35, 3907 (2019).
- Honorio et al. [2019a] T. Honorio, F. Benboudjema, T. Bore, M. Ferhat, and E. Vourc’h, The pore solution of cement-based materials: structure and dynamics of water and ions from molecular simulations, Physical Chemistry Chemical Physics 21, 11111 (2019a).
- Honorio et al. [2019b] T. Honorio, H. Carasek, and O. Cascudo, Electrical properties of cement-based materials: multiscale modeling and quantification of the variability, pre-print available at ¡https://doi.org/10.13140/RG.2.2.16317.51688¿ 10.13140/RG.2.2.16317.51688 (2019b).
- Praprotnik and Janežič [2005] M. Praprotnik and D. Janežič, Molecular dynamics integration and molecular vibrational theory. III. The infrared spectrum of water, The Journal of Chemical Physics 122, 174103 (2005).
- Köhler and Findenegg [1972] F. Köhler and G. H. Findenegg, The liquid state, Vol. 1 (Wiley-VCH, 1972).
- Caillol et al. [1986] J. M. Caillol, D. Levesque, and J. J. Weis, Theoretical calculation of ionic solution properties, The Journal of Chemical Physics 85, 6645 (1986).
- Samson et al. [2005] E. Samson, J. Marchand, K. A. Snyder, and J. J. Beaudoin, Modeling ion and fluid transport in unsaturated cement systems in isothermal conditions, Cement and Concrete Research 35, 141 (2005).
- Revil [1999] A. Revil, Ionic Diffusivity, Electrical Conductivity, Membrane and Thermoelectric Potentials in Colloids and Granular Porous Media: A Unified Model, Journal of Colloid and Interface Science 212, 503 (1999).
- Honorio et al. [2019c] T. Honorio, T. Lemaire, D. D. Tommaso, and S. Naili, Anomalous water and ion dynamics in hydroxyapatite mesopores, Computational Materials Science 156, 26 (2019c).
- Muller et al. [2013] A. C. A. Muller, K. L. Scrivener, A. M. Gajewicz, and P. J. McDonald, Use of bench-top NMR to measure the density, composition and desorption isotherm of C–S–H in cement paste, Microporous and Mesoporous Materials Proceedings of the 11th Internatioanl Bologna Conference on Magnetic Resonance in Porous Media (MRPM11), 178, 99 (2013).
- Honorio et al. [2019d] T. Honorio, T. Lemaire, D. D. Tommaso, and S. Naili, Molecular modelling of the heat capacity and anisotropic thermal expansion of nanoporous hydroxyapatite, Materialia , 100251 (2019d).
- Miura et al. [1998] N. Miura, N. Shinyashiki, S. Yagihara, and M. Shiotsubo, Microwave Dielectric Study of Water Structure in the Hydration Process of Cement Paste, Journal of the American Ceramic Society 81, 213 (1998).
- Hager and Domszy [2004] N. E. Hager and R. C. Domszy, Monitoring of cement hydration by broadband time-domain-reflectometry dielectric spectroscopy, Journal of Applied Physics 96, 5117 (2004).
- Lothenbach et al. [2008b] B. Lothenbach, G. Le Saout, E. Gallucci, and K. Scrivener, Influence of limestone on the hydration of Portland cements, Cement and Concrete Research 38, 848 (2008b).
- Berendsen et al. [1987] H. J. C. Berendsen, J. R. Grigera, and T. P. Straatsma, The missing term in effective pair potentials, The Journal of Physical Chemistry 91, 6269 (1987).
- Plimpton [1995] S. Plimpton, Fast Parallel Algorithms for Short-Range Molecular Dynamics, Journal of Computational Physics 117, 1 (1995).
- Buchner et al. [1999] R. Buchner, G. T. Hefter, and P. M. May, Dielectric Relaxation of Aqueous NaCl Solutions, The Journal of Physical Chemistry A 103, 1 (1999).
- Cole and Cole [1941] K. S. Cole and R. H. Cole, Dispersion and Absorption in Dielectrics I. Alternating Current Characteristics, The Journal of Chemical Physics 9, 341 (1941).
- Smith and Dang [1994] D. E. Smith and L. X. Dang, Computer simulations of NaCl association in polarizable water, The Journal of Chemical Physics 100, 3757 (1994).
- Guihard et al. [2019] V. Guihard, F. Taillade, J.-P. Balayssac, B. Steck, and J. Sanahuja, Permittivity measurement of cementitious materials and constituents with an open-ended coaxial probe: combination of experimental data, numerical modelling and a capacitive model, RILEM Technical Letters 4, 39 (2019).
- Powers and Brownyard [1946] T. C. Powers and T. L. Brownyard, Studies of the Physical Properties of Hardened Portland Cement Paste, Journal Proceedings 43, 101 (1946).