DFT study of itinerant ferromagnetism in p-doped monolayers of MoS
Abstract
We use density functional theory to explore the possibility of making the semiconducting transition-metal dichalcogenide MoS2 ferromagnetic by introducing holes into the narrow Mo band that forms the top of the valence band. In the single impurity limit, the repulsive Coulomb potential of an acceptor atom and intervalley scattering lead to a twofold orbitally degenerate effective-mass like state being formed from Mo and states, bound to the K and K′ valence band maxima. It also leads to a singly degenerate state with Mo character bound to the slightly lower lying valence band maximum at . Within the accuracy of our calculations, these and states are degenerate for MoS2 and accommodate the hole that polarizes fully in the local spin density approximation in the impurity limit. With spin-orbit coupling included, we find a single ion magnetic anisotropy of meV favouring out-of-plane orientation of the magnetic moment. Pairs of such hole states introduced by V, Nb or Ta doping are found to couple ferromagnetically unless the dopant atoms are too close in which case the magnetic moments are quenched by the formation of spin singlets. Combining these exchange interactions with Monte Carlo calculations allows us to estimate ordering temperatures as a function of . For , Curie temperatures as high as 100K for Nb and Ta and in excess of 160K for V doping are predicted. Factors limiting the ordering temperature are identified and suggestions made to circumvent these limitations.
pacs:
75.70.Ak, 73.22.-f, 75.30.Hx, 75.50.PpI Introduction
The discovery of ferromagnetism in (In,Mn)As Ohno et al. (1992) and (Ga,Mn)As Ohno et al. (1996) and predictions for achieving room temperature ordering Dietl et al. (2000) sparked a huge effort to realize a dilute magnetic semiconductor (DMS) that might lead to a semiconductor-based spin electronics (“Spintronics”). After twenty-five years of intensive research, the maximum ordering temperature has stagnated at values too low for extensive applications Dietl (2010). The number of material systems being considered has proliferated but it is not clear what the fundamental limit is to the ordering temperature achievable in any particular material system. There are many reasons for the low ordering temperatures Jungwirth et al. (2006); Sato et al. (2010) but the essential dilemma is that the open shell states of magnetic impurities like Mn are quite localized. While this favours the onsite exchange interaction that is the origin of the Hund’s-rule spin alignment and makes the ionic moment insensitive to temperature, it leads to weaker exchange interactions between pairs of impurity ions that determine the Curie temperature , the ferromagnetic ordering temperature. To increase , the concentration of impurity atoms has to be increased. This is accompanied by a variety of adverse effects such as a nonuniform distribution of magnetic impurities or the formation of antisite defects that are electron donors which counter the intended increase in the concentration of holes. In many semiconductors, transition metal ions introduce “deep levels”, tightly bound partially occupied states in the fundamental gap of the semiconductor. At high dopant concentrations, these form deep impurity bands that dominate the (transport) properties of a material that is no longer a semiconductor and from the electronic structure point of view, is an entirely new material.
In a quite different context, it was long believed that long-range magnetic ordering would not be possible in two-dimensional (2D) materials Mermin and Wagner (1966); Hohenberg (1967). However the observation of ferromagnetism in ultrathin epitaxial layers of e.g., Fe on Au substrates demonstrated that the Mermin-Wagner theorem is not watertight, violation of the proof usually being attributed to magnetocrystalline anisotropy UMS (1994-2005). The recent observation of ferromagnetic ordering in two different chromium-based 2D crystalline materials Cr2Ge2Te6 Gong et al. (2017) and CrI3 Huang et al. (2017) nonetheless attracted considerable attention Samarth (2017). One reason was because of the general interest in 2D materials, triggered by spectacular observations on graphene Novoselov et al. (2004, 2005, 2012). This interest was reinforced by the realization that the properties of semiconductors like MoS2 could also be importantly different in few- and mono-layer form Splendiani et al. (2010); Mak et al. (2010); Radisavljevic et al. (2011) and was compounded by the desirability of stacking layers of 2D materials with different properties Geim and Grigorieva (2013) whereby the lack of a ferromagnetic material in a vast profusion of 2D materials was a striking lacuna Gibertini et al. (2019). Because the Curie temperatures of monolayers of the chromium based materials Gong et al. (2017); Huang et al. (2017) is low, K, the very recent reports that the transition metal dichalcogenide VSe2 Bonilla et al. (2018) and Fe3GeTe2 Deng et al. (2018) exhibit ferromagnetism at room temperature acquires huge significance.
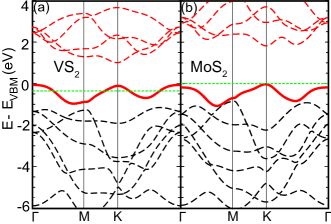
The ferromagnetism of VS2 and VSe2 was predicted with the aid of density functional theory (DFT) calculations foo . The driving force behind the magnetic ordering can be understood in terms of the band structure of the nonmagnetic 1H phase shown in Fig. 1(a) that is very similar to that of the isostructural MoS2 shown in Fig. 1(b) but with one valence electron per formula unit less so that it is metallic with the Fermi level situated in the middle of the solid red band. Bulk multilayered MoS2 is a non-magnetic semiconductor with an indirect bandgap of about 1 eV. In monolayer form it was predicted to have a larger, direct gap Li and Galli (2007) and this was confirmed experimentally where direct gaps of eV have been reported Splendiani et al. (2010); Mak et al. (2010). In the figure, the “nominal” Mo bands are indicated in red, the black bands are sulphur-derived bands. The interaction of the Mo- and S- states is such that a large covalent bonding-antibonding gap is formed leaving a single Mo- band (solid red line) with mixed character in the fundamental band gap Bromley et al. (1972); Mattheiss (1973). For MoX2, this band is completely filled but for VX2 it is only half full. The dispersion of only about 1 eV leads to a high average density of states of states/eV and the gain in energy achieved by exchange-splitting this narrow band more than offsets the kinetic energy cost. The bandwidth reduction in 2D that leads to larger band gaps is favourable for itinerant ferromagnetism because of the higher average densities of states (DoS) than in three dimensions. Likewise elements are more favourable than and more favourable than because of the greater localization of the electrons and concomittant smaller bandwidth as the principal quantum number decreases.
A number of intrinsic defects have been found to form local moments Ataca and Ciraci (2011); Lu and Leburton (2014); Hong et al. (2015); Li et al. (2016); Khan and Leuenberger (2018) in MX2 materials and suggestions have been made to make the MX2 materials magnetic by adsorption of impurity atoms He et al. (2010); Ataca and Ciraci (2011); Dolui et al. (2013); Lu and Leburton (2014), or by substituting M or X atoms with impurity atoms Karthikeyan et al. (2019); Cheng et al. (2013); Yue et al. (2013); Ramasubramaniam and Naveh (2013); Mishra et al. (2013); Dolui et al. (2013); Yun and Lee (2014); Qi et al. (2014); Gil et al. (2014); Andriotis and Menon (2014); Lu and Leburton (2014); Zhang et al. (2015); Miao et al. (2016); Zhao et al. (2016a, b); Fan et al. (2016); Robertson et al. (2016); Singh and Schwingenschlögl (2017); Miao et al. (2018); Mekonnen and Singh (2018). Even though the Mermin-Wagner theorem Mermin and Wagner (1966); Hohenberg (1967) tells us that there is no long range ordering in two dimensions for isotropic Heisenberg exchange, few attempts have been made to determine the exchange coupling between magnetic impurities Ramasubramaniam and Naveh (2013); Mishra et al. (2013); Dolui et al. (2013); Qi et al. (2014); Gil et al. (2014); Fan et al. (2016); Mekonnen and Singh (2018) and it was only very recently that the magnetic anistropy of a defect was calculated, for an antisite defect in MoS2 Khan and Leuenberger (2018). Replacing some of the M atoms with Hund’s-rule coupled transition metal atoms like Mn or Fe gives rise to deep impurity levels in the semiconductor gap. Where attempts have been made to estimate the Curie temperature, the predicted values are either very low or the concentration of transition metal dopant is so high that the doped material is no longer a semiconductor Cheng et al. (2013); Ramasubramaniam and Naveh (2013); Mishra et al. (2013); Qi et al. (2014); Gil et al. (2014); Miao et al. (2018). Based upon the electronic structure shown in Fig. 1(b), we explore a different approach to making MoS2 ferromagnetic in this manuscript [Ashortsummaryofthisworkappearedin]Gao:prb19.
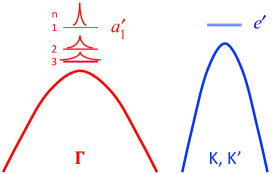
Group VIB Mo has a 45 electronic configuration and, in a dichalcogenide like MoS2, is nominally Mo4+ with one up-spin and one down-spin electron so it is nonmagnetic as seen in Fig. 1(b). When a Mo atom is substituted by a group VB atom like V, Nb or Ta, then the dopant atom e.g. V4+, has a single unpaired electron and a single hole is thereby introduced into the narrow Mo 4 band; substitution of a group IVB atom (Ti, Zr, Hf) will introduce two holes per dopant atom. In the impurity limit, the asymptotic Coulomb potential leads to a series of hydrogenic states bound to the top of the valence band; to the maxima at the K and K′ points with mixed Mo and character and to the slightly lower valence band maximum at the point with Mo character and a large effective mass Peelaers and Van de Walle (2012).
The aim of this paper Gao et al. (2019) is to determine if there are dopant atoms whose potential is sufficiently similar to that of the host Mo atom that only weakly bound, effective-mass like states are formed above the valence band edge, Fig. 2. At low concentrations these bound states should polarize and form impurity bands that have such a high density of states that they remain exchange split Edwards and Katsnelson (2006). At finite temperatures these polarized bound holes will be excited into the valence band giving rise to a DMS. The key objectives of this paper are to determine (i) whether single acceptor dopant atoms give rise to polarized effective-mass like states in the MoS2 host system and to determine the position of these states with respect to the valence band edge; (ii) whether the interaction between pairs of dopant atoms favours ferromagnetic or antiferromagnetic alignment and to identify the nature of the interaction, Zener - type, double exchange etc. Jungwirth et al. (2006); Sato et al. (2010) and understand the factors determining it; (iii) the magnetic anisotropy of single impurities, the so-called single ion anisotropy (SIA); (iv) the ordering temperature and express it in terms of parameterized models that describe the dopant-induced states and their interactions in order to identify the most promising regions of parameter space to realize a room temperature DMS.
To do this we use density functional theory total energy calculations to determine ground state energies of single acceptor impurities. We outline the methods used and give some technical details specific to the present work in Sec. II. Our results are presented in Sec. III beginning with a study of the single impurity limit of a substitutional vanadium atom in Sec. III.1 including the effects of spin polarization and local atomic relaxation. The binding of pairs of V dopants is considered in Sec. III.2 and their magnetic “exchange” interaction in Sec. III.3 with special attention being devoted to understanding the quenching of the magnetic moments of close pairs of impurity ions. In Sec. III.4 we briefly compare V with Nb and Ta. Sec. IV is concerned with the question of magnetic ordering and begins with a study of the single ion anisotropy of V impurities in Sec. IV.1 to justify using an Ising spin model with the exchange interactions from Sec. III.3 and the Monte Carlo techniques described in Sec. IV.2 to estimate ordering temperatures in Sec. IV.3. A comparison of our findings with other calculations in Sec. V leads us to consider how using the generalized gradient approximation (GGA) would alter our local density approximation (LDA) results. After a brief discussion in Sec. VI some conclusions are drawn in Sec. VII.
II Computational Details
Calculations of the total energy and structural optimizations were carried out within the framework of density functional theory (DFT) using the projector augmented wave (PAW) method Blöchl (1994) and a plane-wave basis set with a cut-off energy of 400 eV as implemented in the vasp code Kresse and Hafner (1993); Kresse and Furthmüller (1996); Kresse and Joubert (1999). Monolayers of MX2 periodically repeated in the direction were separated by more than 20 Å of vacuum to avoid spurious interaction.
| (Å) | (Å) | (Å) | (eV) | |||
| Bulk | GGA | 3.183 | 3.127 | 2.42 | 0.885 | -0.640 |
| LDA | 3.125 | 3.115 | 2.38 | 0.748 | -0.640 | |
| Exp | 3.160a | 3.172a | 2.41a | 1.290c | -0.600b | |
| ML | GGA | 3.185 | 3.130 | 2.42 | 1.650 | 0.012 |
| LDA | 3.120 | 3.115 | 2.38 | 1.860 | 0.150 | |
| Exp | 3.160 | 3.172 | 2.41 | 1.900c | 0.140b |
The equilibrium structural parameters for bulk and monolayer MoS2 were calculated in both the LDA Perdew and Zunger (1981) and GGA Perdew et al. (1996) and are given in Table 1. It can be seen that the GGA slightly overestimates lattice constants and bond lengths compared to experiment Böker et al. (2001). The LDA underestimates them by more than the GGA overestimates them, a result found for many materials. In the present case, the agreement with experiment is still very reasonable for both LDA and GGA. However, we see that for an MoS2 monolayer the LDA gives a better description of the energy levels near the valence band maximum (VBM) than does the GGA, in particular the important quantity , the position of the VBM at the point, , relative to the top of the valence band at the K point, Jin et al. (2013). To describe acceptor states accurately, it is important to have a good description of the host band structure in the vicinity of the VBM so we will describe exchange and correlation effects in this paper using the local spin density approximation LSDA as parameterized by Perdew and Zunger Perdew and Zunger (1981). Results obtained with the GGA are considered in Sec. V.
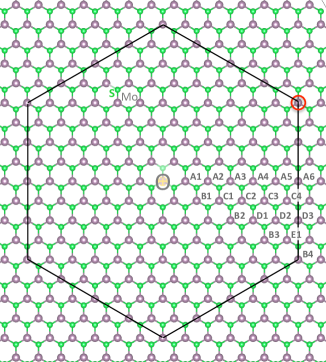
We model substitutional impurities and impurity pairs in in-plane supercells with as large as 15 using the calculated equilibrium lattice constant for the pure monolayer (ML) host, Fig. 3. Local geometries are first relaxed using and only a small differential relaxation needs to be performed in the larger supercells. Interactions between pairs of impurities were studied in 1212 supercells. The atomic positions were relaxed using a 221 -centered -point mesh until the forces on each ion were smaller than 0.01 eV/Å. Spin-polarized calculations were performed with a denser mesh corresponding to 44 -points for a 1212 unit cell.
III Results
Impurity states in semiconductors are usually described in one of two limits: (i) in effective mass theory (EMT) where the main emphasis is on the Rydberg series of bound states tied to the conduction band minima or valence band maxima formed in response to a Coulomb potential or (ii) in the tight-binding limit where the main emphasis is on the local chemical binding, atomic relaxation and impurity states formed deep in the fundamental bandgap associated with an impurity potential very different to the host atomic potential Pantelides (1978); Lannoo and Bourgoin (1981); Altarelli and Bassani (1982). Because there is no consensus of how best to combine both aspects Smith et al. (2017), we consider the behaviour of shallow acceptor states in a periodic supercell geometry in some detail in the following section.
III.1 Single impurity limit: V in MoS2
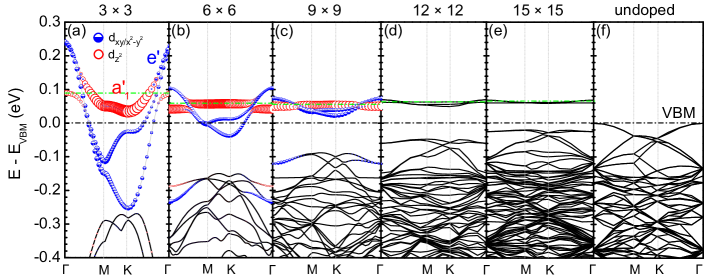
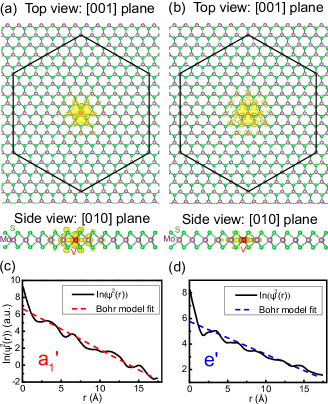
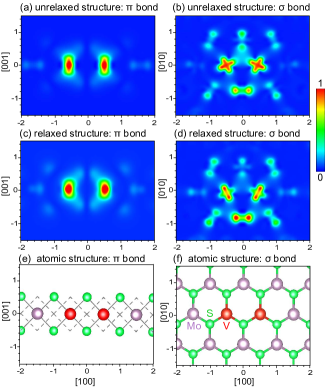
We begin by replacing a single Mo atom in an MoS2 supercell with a V atom with one valence electron less, Fig. 3. To more easily identify the downfolded host bands we choose to be a multiple of three whereby the K and K′ points fold down to the point of the reduced BZ. The energy bands for this supercell before relaxing the local geometry are shown in Fig. 4 for , 6, 9, 12 and 15. The repulsive (for electrons; attractive for holes) impurity potential is seen to push not one but three impurity states out of the valence band to form localized states labeled and under the local symmetry, Fig. 2. By projecting the corresponding wavefunctions at the point onto spherical harmonics on the site, we find that the singly degenerate state has V character while the state that is doubly degenerate at the center of the BZ has V {} character. The corresponding partial charge density plots are shown on the left- respectively right-hand sides (lhs, rhs) of Fig. 5. By fitting the wave functions of the impurity states to a hydrogenic wave function =A, we find effective Bohr radii of 4.2 Å and 8.0 Å for the and states, respectively in Fig. 5(c) and Fig. 5(d).
We identify these and states with the most tightly bound (effective mass like) acceptor states formed when a screened Coulomb potential is introduced by substitution of a Mo atom by V (Nb or Ta). In the single impurity limit, intervalley scattering leads to a twofold orbitally degenerate effective mass like state formed from Mo {} states bound to the K and K′ valence band maxima in Fig. 1 and a singly degenerate state with Mo character bound to the slightly lower lying valence band maximum at in Fig. 1. Within the accuracy of our calculations, these and states are (accidentally) degenerate for MoS2 and accommodate the hole that we will see polarizes fully in the local spin density approximation Gunnarsson et al. (1974). The shape of the dispersion of the impurity states is essentially independent of the supercell size so the bands can be described with a single effective hopping parameter. The state exhibits very little dispersion consistent with the out-of-plane orbital character at where the weak dispersion of the host MoS2 bands is described by a large effective mass Aghajanian et al. (2018). In the language of effective mass theory (EMT), the binding energy of the state is dominated by the central cell correction Pantelides (1978).
In the rightmost panel of Fig. 4, we show the band structure of an undoped monolayer calculated in a supercell so the K point VBM is downfolded onto . If we compare this with the impurity supercell bands on the left, we see that even for , Fig. 4(e), the interaction of the impurity bands and the VBM still suppresses the VBM quite noticeably, by more than 20 meV.
III.1.1 Screened impurity potential
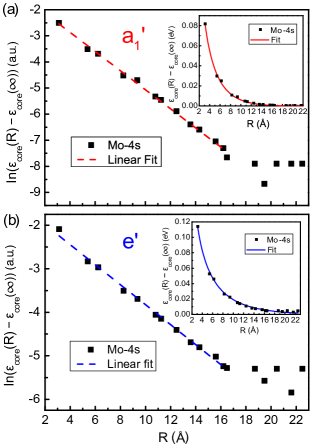
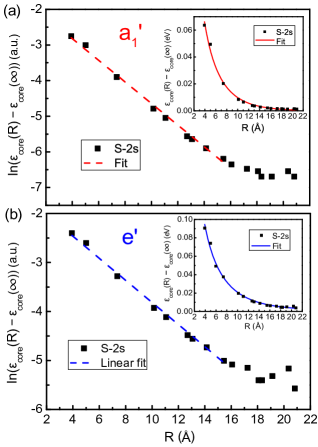
Identifying the valence band maximum (VBM) in an impurity supercell calculation is complicated by the Rydberg series of effective mass like states associated with the single impurity whose wavefunctions will overlap with their periodic images and form bands that overlap and hybridize with the “true” valence band states, Fig. 2. To disentangle those effects, we first determine the position of the VBM with respect to Mo 4 semicore states, , for an undoped monolayer of MoS2; denotes a Kohn-Sham eigenvalue. For a sufficiently large impurity supercell, the position of for the Mo atom furthest from the impurity (indicated with a red circle in Fig. 3) relative to the VBM should be asymptotically equal to the corresponding energy separation for an undoped monolayer of MoS2 because the impurity potential far from the dopant center will be completely screened by the bound charge of the neutral impurity in an or bound state. To test this hypothesis quantitatively, we plot with respect to its asymptotic value as a function of the separation of Mo from the impurity V ion in the insets of Fig. 6 for supercells (symbols). The corresponding results for the S semicore 2 state are shown in Appendix A and yield similar conclusions.
In an impurity supercell calculation, a localized electron in a (semi)core level on a Mo atom a distance from the impurity atom will see a screened repulsive potential that is partially compensated by the charge of the bound hole, . Here is the relative static dielectric constant. We can “measure” this screened Coulomb potential by studying how Mo (and S) semicore levels behave as a function of their separation from the central V atom. The perturbing electrostatic potential seen by the core electrons has the form
| (1a) | ||||
| (1b) | ||||
where in (1a) and is obtained by integrating over for or . In (1b), we assume that is the solution of a strictly two dimensional hydrogenic problem Yang et al. (1991). If we take the natural logarithm of (1b), the slope is for large values of and we can extract from Fig. 6.
In the supercell band structures shown in Fig. 4, the and derived states overlap and is a mixture of these two states with different masses . To circumvent this complication, we calculate the electronic structure at the K (or M) point where the lowest unoccupied state has character. By using a sufficiently small temperature broadening we can obtain the corresponding charge density and obtain the result shown in Fig. 6 (upper panel). Alternatively, we calculate the electronic structure at the point where the lowest unoccupied state has character to obtain Fig. 6 (lower panel). The ab-initio values of and are fit quite well with (1b) with an effective Bohr radius of Å and for the hole and Å and for the hole. The values of should be compared to recent calculations for the in-plane “macroscopic” dielectric constant where was found for monolayers of MoS2 as well as for bulk MoS2 with negligible ionic contribution to the screening Laturia et al. (2018). The deviation of from the macroscopic value is not very surprising in view of the localization of the hole that does not “see” many unit cells of MoS2. The value for the hole is reasonable.
At large values of in Fig. 6, the potential felt by the core states is seen not to decay but to oscillate. We attribute this to the accumulation of the residual hole charge at the supercell boundary that is a consequence of charge neutrality. The data points in Fig. 6 that deviate from the trend line are to be found outside the circle inscribed in the hexagonal WS cell.
In the effective mass approximation the effective Bohr radius Å and the ground state binding energy with respect to the appropriate VBM is eV. From the band structure in Fig. 1, the effective mass in units of the free electron mass is at the K point VBM and 3.42 at the point VBM, consistent with a previous calculation Yun et al. (2012). Combining these masses with Laturia et al. (2018) leads to values of Å and meV for holes and Å and meV for holes, respectively. At best the EMT is indicative but is clearly not quantitative for the most strongly bound acceptor states - a conclusion that is not especially surprising in view of the expected central cell correction for ground states Pantelides (1978) as well as the strong localization of both states.
The screening of the impurity potential by (i) the MoS2 valence electrons and (ii) by the bound impurity hole means that the residual perturbation measured by the core states decreases rapidly with allowing us to estimate the position of the reference core state far from the impurity and therefore of the VBM to an accuracy of a few meV for . This procedure was used to estimate the position of the VBM and of the impurity states with respect to it for each supercell size shown in Fig. 4 (dot-dashed line).
The same results can be obtained more simply by noting that the repulsive potential that binds a Rydberg series to the top of the valence band has little effect on the conduction band edge. Since we know the value of the band gap, the VBM can be determined from the conduction band minimum. We verified that this leads to the same results as the more elaborate procedure discussed in the foregoing.
III.1.2 Hydrogenic perturbation model
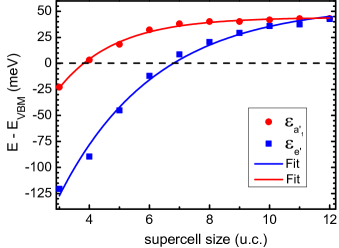
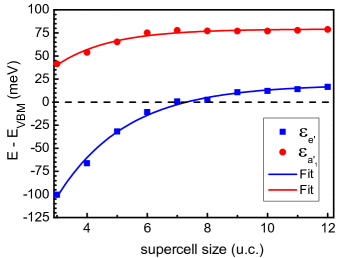
Now that we have established procedures for determining the position of the VBM, we see that the and impurity bands in Fig. 4 not only narrow as the supercell size is increased but rise with respect to the VBM. To make this clearer, we plot their centers of gravity
| (2) |
with respect to the VBM in Fig. 7; both levels are seen to rise as a function of . The probability is the character of the wavefunction obtained by projecting onto site centered orbitals and is a composite site, angular momentum index. Here we have chosen to be the and Kubic harmonics on the atom for the state and on for the state and the summation is carried out over the entire Brillouin zone and over the three split off impurity bands in Fig. 4. Since the position of the impurity levels introduced by atoms will play an important role in determining the magnetic moment and exchange interaction between impurities, we wish to understand this increase.

A Coulomb potential in a semiconductor gives rise to a Rydberg series of bound states. A finite supercell cannot describe the asymptotic form of the potential correctly but will truncate it on the supercell boundary. In a self-consistent calculation, the requirement of charge neutrality will lead to the charge in the tail of the hydrogenic state accumulating on the supercell boundary. As the supercell size is increased, more of the “tail” of the (repulsive) Coulomb potential is described correctly, leading to the rise of the impurity levels seen in Figs. 4 and 7.
The effect of truncating the Coulomb potential can be estimated using a simple two dimensional (2D) hydrogenic Yang et al. (1991) model and first order perturbation theory. For simplicity we assume a circular geometry and replace the 2D Wigner-Seitz cell with a circle of radius with the same area . The correction to the ground state energy of a hydrogen atom in 2D is
| (3) |
where a is the effective Bohr radius, is the relative dielectric constant and is the radial part of the 2D hydrogenic wave function Yang et al. (1991) for a screened Coulomb potential. Taking the top of the valence band of an ideal MoS2 monolayer, as estimated in the previous subsection, to be zero, we fit the ab-initio calculated data points with the solid curves shown in Fig. 7. The fit is very good and deviations can be attributed to local screening effects in the “real” inhomogeneous crystal as modelled in DFT.
The and impurity levels increase in energy with increasing supercell size and converge to a (coincidentally) common value of meV in the single impurity limit (). From the fitting, we obtain another estimate of the effective Bohr radius of 8.3 Å for the state, of 5.5 Å for the state and of for the in-plane dielectric constant. These values should be compared to the EMT predictions of Å and meV with respect to the K point VBM for the holes and Å and meV with respect to the point VBM for the holes. Taking the LDA value of meV from Table 1 into account, we would expect to find the ground state at meV above the K point VBM.
According to Fig. 7, the highest impurity states emerge from the valence band when the supercell size is larger than 55. This is consistent with the effective Bohr radius of the impurity levels deduced in Fig. 5. For impurity states with higher principal quantum numbers, the Bohr radii are at least twice as large. These states are not sufficiently localized in the Coulomb potential to appear above the valence band maximum for the largest supercells we have studied.
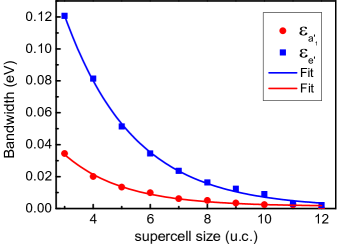
We can also determine effective Bohr radii from the dependence of the widths of the impurity bands, shown in Fig. 4, on the supercell size because of the dependence of the bandwidth on the overlap of impurity wavefunctions in neighboring supercells. In Fig. 8 we plot the second moment of the impurity bands
| (4) |
as a function of where a is the effective Bohr radius and is the distance between dopants in neighboring supercells. From the fitting, we get effective Bohr radii of 7.8 Å for the state and 5.2 Å for the state which are consistent with our earlier results summarized in Table 2.
| V | Nb | Ta | |||||
| (K) | (K) | (K) | |||||
| Fig. 5 | 4.2 | 8.0 | 5.3 | 10.0 | 5.2 | 10.3 | |
| Fig. 6, | Eq. 1b Mo | 5.4 | 8.7 | 6.2 | 9.6 | 5.8 | 9.7 |
| Fig. 29, | Eq. 1b S | 6.5 | 8.8 | 6.8 | 10.0 | 6.5 | 10.0 |
| Fig. 7, | Eq. 3 | 5.5 | 8.3 | 5.9 | 10.0 | 6.2 | 10.4 |
| Fig. 8, | Eq. 4 | 5.2 | 7.8 | 5.2 | 9.8 | 5.4 | 10.1 |
| EMT | () | 2.3 | 14.0 | 2.3 | 14.0 | 2.3 | 14.0 |
III.1.3 Effect of relaxation
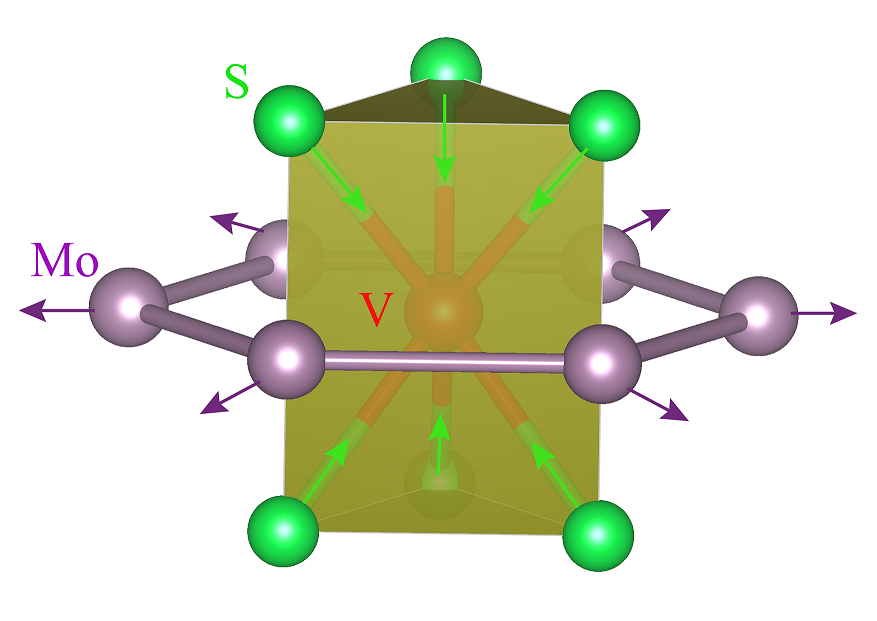
One of the most attractive and useful features of a plane wave basis is the ease with which Hellmann-Feynman forces can be calculated. This makes it simple to determine how the host MoS2 crystal relaxes locally in response to substituting a Mo atom with V, Fig. 9. According to the electronic structure Fig. 4(d) for the unrelaxed geometry, shown enlarged in Fig. 10(b), the Fermi level is essentially pinned in the orbitally nondegenerate state and the system does not undergo a Jahn-Teller (JT) distortion; if we begin geometry optimisation from a JT distorted configuration, the system relaxes back to a symmetric one. Consistent with this, we find only symmetry-conserving (“breathing mode”) relaxation about the vanadium ion with the six nearest neighbour sulphur atoms relaxing towards the V atom and the six in-plane neighbouring Mo atoms relaxing radially away, shown in Fig. 9. The displacements converge rapidly with supercell size to Å and Å as seen in Table 3. The total energy gain from relaxation is 150 meV.
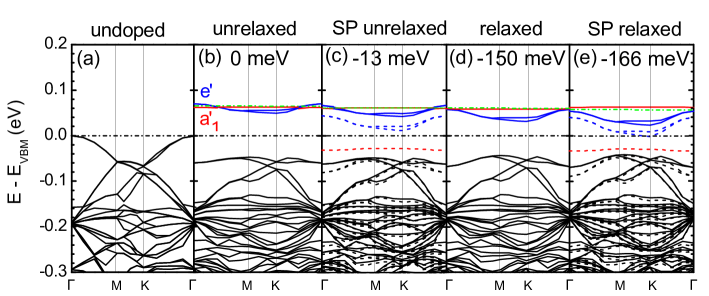
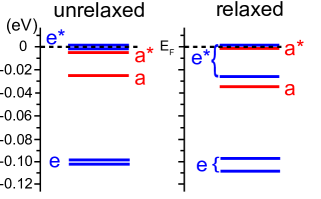
The band structures of the unrelaxed and relaxed 1212 impurity supercells are compared in panels (b) and (d) of Fig. 10. The band structures are aligned on the VBM, located at the point as seen in Fig. 10(a) for an undoped monolayer, using the semicore level shift of the “B4” Mo atom on the boundary of the Wigner-Seitz cell furthest from the dopant V atom, see Fig. 3. The main effect of relaxation is to lift the quasidegeneracy of the and impurity states, Fig. 10(d). The increased V-Mo bond length leads to a lowering of the center of gravity of the state with respect to the state that is antibonding with respect to the neighbouring S states. As a consequence, the hole state acquires essentially pure character.
| 3 | 6 | 9 | 12 | 15 | |
| -0.060 | -0.060 | -0.060 | -0.060 | -0.060 | |
| 0.003 | 0.005 | 0.008 | 0.008 | 0.008 |
III.1.4 Spin polarization
The electronic structure of an unpaired spin in an orbitally nondegenerate impurity state resembles that of a free hydrogen-like atom and, like a free atom, its total energy can be lowered by allowing the electron to polarize in the local spin density approximation Gunnarsson et al. (1974); Gunnarsson and Lundqvist (1976). The result of doing so in the dilute limit is shown in Figs. 10(c) and (e). Without relaxation, the localized and dispersionless state splits by 91 meV leaving the hole with mixed – character and a magnetic moment of . Expressing the exchange splitting in terms of an effective Stoner parameter as results in a value of of 91 meV that is substantially less than the free atom value of eV Janak (1977). In the local density approximation, it is the local electron density that drives the exchange splitting and the small exchange splitting can be understood in terms of the much lower spin density of the impurity state compared to that of a free atom. Consistent with this picture is the even smaller exchange splitting of the more delocalized state that is only meV. Before relaxation, the partial occupation of and states allows the state to “freeload” on the much more localized electron density enhancing its spin polarization and exchange splitting (24.7 meV) which decreases to 15.2 meV after relaxation, Table 6. The mixing of the impurity state with what will eventually become the top of the valence band is clearly seen in the 1212 supercell in terms of the large exchange splitting of the uppermost host valence band state (black solid and dashed bands) at the point. The total energy gain from spin polarization of 13 meV without relaxation or 16 meV with relaxation is dwarfed by the 150 meV energy gain from relaxation.
| 3 | 4 | 5 | 6 | 7 | 8 | 9 | 10 | 11 | 12 | ||
| V | Un | ||||||||||
| Re | |||||||||||
| U | |||||||||||
| Nb | Un | ||||||||||
| Re | |||||||||||
| Ta | Un | ||||||||||
| Re |
For smaller supercell sizes, the dispersion of the state increases until it overlaps the unoccupied level and begins to quench the spin polarization for , Table 4. Reducing the supercell size further increases the quenching and when, in addition, the impurity potential fails to pull the impurity levels above the VBM for supercell sizes smaller than , the magnetic moment disappears. Relaxation enhances the magnetic moment by reducing the overlap of the and states in spite of the unfavourable increase of the state dispersion. Even a very small value of the Coulomb repulsion parameter eV Dudarev et al. (1998) can lead to a supercell becoming polarized. Most of the discrepancies in the literature can be explained in terms of the supercell size, k-point sampling, exchange-correlation potential, etc. Dolui et al. (2013); Yue et al. (2013); Yun and Lee (2014); Andriotis and Menon (2014); Lu and Leburton (2014); Miao et al. (2016); Singh and Schwingenschlögl (2017); Miao et al. (2018); Wu et al. (2018)
III.1.5 Formation energies
| V | Nb | Ta | |
| Unrelaxed | 0.40 | 0.01 | -0.12 |
| Relaxed | 0.25 | -0.15 | -0.23 |
The formation energy of a substitutional dopant is defined as
| (5) |
where Etot[MoS2:X] is the total energy of an MoS2 monolayer with one Mo atom replaced by one X atom, Etot[MoS2] is the total energy of a pristine MoS2 monolayer and and are the total energies per atom of Mo and X in their bulk metallic bcc phases, respectively. Taking the (spin-polarized) S2 molecule as the reference chemical potential for S, the heat of formation of a MoS2 monolayer, , was calculated to be -5.31 eV/formula unit. The formation energy of VMo is small and those of NbMo and TaMo actually become negative when relaxed indicating that doping MoS2 with these group V elements should be experimentally feasible, Table 5.
III.2 Binding of V impurity pairs
Two substitutional dopant V atoms will have a negligible interaction energy when sufficiently far apart. This energy can be calculated as follows. First define a reference energy for a single V dopant atom substituting a Mo atom in MoS2 as
| (6) |
where is the total energy of an supercell of MoS2 in equilibrium and is the total energy of the same supercell with one Mo atom replaced with a V atom. To calculate absolute formation energies, suitable chemical potentials would need to be included to take account of where the V atom came from and where the Mo atom went to; we will not be concerned with those here. The binding energy is then
| (7) |
where is the total energy of a supercell with two Mo atoms a distance apart substituted with V atoms and the last two terms on the right do not depend on . We consider the two cases where relaxation is (Re) and is not (Un) included.
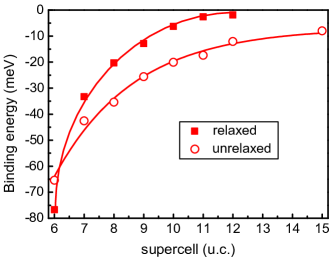
For supercells containing two substitutional V atoms as far apart as possible (), with one V atom at the origin and the second at the corner site in Fig. 3, the binding energy is shown as a function of the supercell size in Fig. 11 with spin polarization included. Although does not change much for , there is still a surprisingly large binding energy of meV for in the unrelaxed case. We can trace this to the near degeneracy of the minority-spin and related bands shown in Fig. 10(c) for the unrelaxed VMo as well as the relatively long range of the holes. When relaxation is included, the hole becomes localized in the dispersionless minority-spin band, Fig. 10(e), it becomes much easier to converge the total energy (with respect to BZ sampling and self-consistency) and decreases fast to meV for . In general, when there is a gap between occupied and unoccupied states, total energies can be converged better. Since the problem has to do with the (separation independent) reference energy , it turns out to be better to consider
| (8) |
and approximate
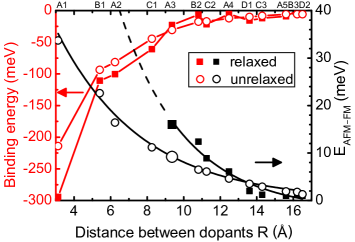
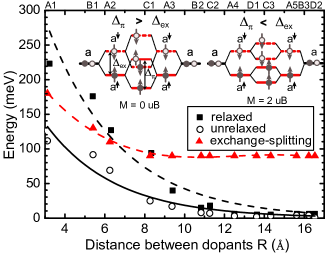
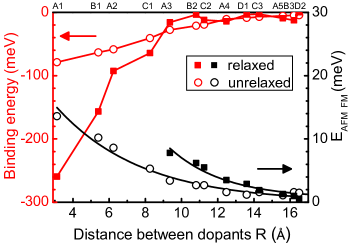
Using a 1212 supercell and (8) we explore the pair binding energy for dopants as a function of their separation in Fig. 12 where one dopant atom is assumed at the site marked 0 in Fig. 3. Without relaxation, the (absolute value of the) binding energy decreases monotonically from a value of meV for V atoms on neighbouring Mo sites to a value of meV at the maximum separation in a 1212 supercell (open red circles, left axis). Because these energies are so small, we will later assume that dopant atoms are randomly distributed in real materials that are not in full thermodynamic equilibrium.
With relaxation (filled symbols), the magnitude of the binding energy increases for separations smaller than a critical separation, Å, and does not change for separations larger than this. This behaviour is intimately related to quenching of the magnetic moments for V dopant atoms closer than and for these separations, , an exchange interaction cannot be determined. We proceed to consider the magnetic interactions.
III.3 Magnetic Interaction of impurity pairs
We estimate the exchange interaction between pairs of dopant atoms as the energy difference between configurations with the V magnetic moments aligned parallel (“ferromagnetically”, FM) and antiparallel (“antiferromagnetically”, AFM)
| (9) |
in 1212 supercells so that the interaction between periodic images is acceptably small. Because the spin-polarized calculations are computationally expensive, care is taken to construct suitable starting V configurations using “superpositions” of relaxed, spin-polarized local atomic configurations for single . Starting V configurations are constructed from relaxed V configurations so only the much smaller differential relaxation needs to be calculated.
The energy difference between antiferromagnetic and ferromagnetic ordering without (open black circles) and with (filled black squares) relaxation is shown on the right axis of Fig. 12. Before relaxation, neighbouring V dopant atoms show FM coupling with a total moment of or per V for all separations. The interaction decreases monotonically and exponentially from a maximum of meV for nearest neighbours with a decay length of Å. With relaxation included the magnetic moments are quenched for separations smaller than a critical separation, Å, and for these separations an exchange interaction cannot be determined. For separations , the coupling remains ferromagnetic and is enhanced. Because the maximum value of the magnetic ordering temperature will depend strongly on this relaxation-induced behaviour, we need to understand its origin.
III.3.1 Quenching of moments for
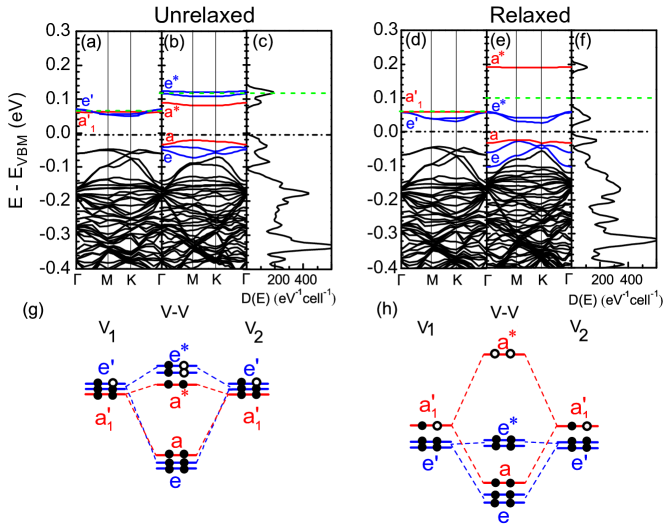
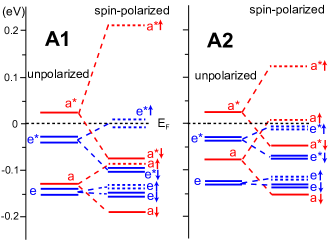
To do so, we consider a 1212 supercell for an MoS2 monolayer with a pair of Mo atoms on neighbouring sites substituted with V. The unpolarized supercell electronic structures and DoS are shown in Fig. 13 without (left) and with relaxation (right). The corresponding band structures for a single V impurity are included in the left panels for reference. In the spirit of a defect molecule model, Fig. 13(a-c) suggests that the orbitals form bonding-antibonding - pairs scarcely lifting the degeneracy of the states while the states interact less strongly to form a bonding-antibonding - pair. Without relaxation, the strength of the bond between the orbitals is not strong enough to raise the level above the level and the two holes reside on the fourfold orbitally and spin degenerate states as sketched in Fig. 13(g). This leads to a DoS peak at the Fermi level that is unstable with respect to exchange splitting.
Relaxation results in a structure where the neighbouring S atoms move closer to the V atoms, the two V atoms move apart and the levels on individual atoms are lifted clear of the levels. The reduced V-S separation strengthens the bond [Fig. 14(a) versus Fig. 14(c)] through hybridization between vanadium and sulphur and orbitals, while the bonds formed by vanadium orbitals are weakened by the increased V-V separation [Fig. 14(b) versus Fig. 14(d)]. This makes the bond the dominant bonding interaction between dopants. The - splitting is increased so much by relaxation that the level is lifted well above the level and the two holes are accommodated in an orbitally nondegenerate state (rhs of Fig. 13).
To demonstrate how competition between bonding and exchange interactions of the V orbitals leads to the quenching of the magnetic moments, we examine how these interactions depend on the separation between the dopant atoms. We define the bond strength of the bond to be the – bonding-antibonding splitting. Fig. 15 shows how depends on the impurity separation with (filled black squares) and without (open black circles) structural relaxation. As increases, decreases because of the decreasing wavefunction overlap. Without relaxation (open circles), is smaller than the exchange splitting (red triangles, dashed red line) for all separations and a triplet state would form as indicated in the rhs inset of Fig. 15. With relaxation (filled squares), is larger and exceeds the exchange splitting at distances smaller than Å. A singlet state is formed to gain bonding energy, as sketched in the lhs inset of Fig. 15, and this leads to the quenching of the magnetic moment. The critical quenching separation is twice the effective Bohr radius Å for the state, implying the formation of a bond. In general, to quench the magnetic moment, the bonding interaction should be strong enough to make the state the highest lying state.
Lastly, we note a significant enhancement of the exchange splitting when two vanadium atoms are close, Fig. 15. From a value of 92 meV for single V dopants, the increase in hole density at short separations doubles the exchange splitting to meV for (unrelaxed) V dopants on neighbouring Mo sites.
III.3.2 Enhancement of Exchange Interaction for
For separations greater than , the exchange interaction is strongly enhanced by relaxation before decaying more strongly than the unrelaxed case till it eventually becomes smaller when Å, Fig. 12. We can understand the enhancement by considering in Fig. 16 the defect levels associated with the A3 configuration, Fig. 3. For the unrelaxed structure (lhs), the breaking of the local symmetry is negligible and the bonding and antibonding states remain doubly degenerate. At this separation of 9.55 Å, the bonding interaction of the states is much less that of the states so that the level is the lowest unoccupied level to which both holes gravitate. Because it is degenerate, the level can exchange split with both holes aligned to form a triplet spin state. The exchange splitting is weak because of the delocalisation of the levels.
Relaxation reduces the V-S bond length while increasing the V-V bond length and breaks the local symmetry leading to a significant splitting of the degenerate and levels as well as a small increase in the bonding interaction between the levels (Fig. 16, rhs). The net result is that the level and highest level become degenerate and accommodate the two holes. Because of the greater localization of the levels, this leads to an enhancement of the exchange splitting for the parallel (FM) configuration of the two VMo dopants (compared to the unrelaxed case) and a reduction for the antiparallel (AFM) configuration with a corresponding increase of the energy difference (large symbols in Fig. 12). To a good approximation the interaction strength only depends on the separation and decays exponentially more rapidly than the unrelaxed case with a much reduced decay length of 3.6 Å reflecting the greater localization of the holes.
III.4 Nb and Ta in MoS2
We expect Nb and Ta to more closely resemble Mo than V with a weaker central cell potential leading to less localized impurity states than in the case of V. Nb and Ta will turn out to have very similar effective Bohr radii and binding energies that lead to virtually indistinguishable magnetic properties.
III.4.1 Single impurity limit: Nb and Ta in MoS2
For an unrelaxed Nb (Ta) substitutional impurity, we find an effective Bohr radius of 10.0 (10.3) Å for the state and 5.3 (5.2) Å for the state by fitting the circularly averaged wave function in a 1212 supercell to be compared to values of 8 Å and 4.2 Å, respectively, for V found in Sec. III.1, Table 2. The binding energies of these and states converge to a common value of meV in the large supercell, single impurity limit Fig. 17; the results for Nb and Ta are virtually indistinguishable and only those for Nb are shown. The smaller binding energies and larger effective Bohr radii make the Nb (Ta) impurity states more sensitive to the supercell truncation of the impurity potential compared to V. Increasing delocalization of the holes from VTa leads to a reduction of the exchange splittings, Table 6, and a magnetic moment is found to develop only when . Total polarization only occurs for , see Table 4.
After relaxation, the Nb-Mo (Ta-Mo) bond length increases by 0.040 (0.036) Å, leading to a lowering of the state. The hole then goes into the state whose exchange splitting increases while that of the state decreases because of the reduced overlap in space of the and partial electron densities. As we already saw for V in Table 4, relaxation enhances the magnetic moments.
| V | Nb | Ta | ||||
| (K) | (K) | (K) | ||||
| Un | 91.3 | 24.7 | 32.4 | 10.9 | 35.6 | 10.8 |
| Re | 96.1 | 15.2 | 53.2 | 9.8 | 52.0 | 9.7 |
III.4.2 Interaction of Nb (Ta) impurity pairs
Because of the smaller bound state energies and weaker spin polarization, the exchange interaction between pairs of Nb (Ta) dopant atoms is weaker than that between pairs of V atoms, Fig. 12, and decays more slowly with increasing separation, Fig. 18. To a good approximation the interaction strength only depends on the separation and decays exponentially with with a decay length of 5.2 (5.8) Å versus 3.6 for V when relaxation is included.
The exchange splitting of the and levels and their relative hole occupations determine the strength of their different exchange interactions. Relaxation raises the level to become degenerate with the upper level, enhancing the exchange splitting of the level while reducing that of the level (see Table 6) and changes the character of the holes from -like to +-like. This increases the strength of the exchange interaction but leads to a faster decay as we saw in Figs 12 and 18 for vanadium.
In summary, before relaxation, the long-range weak ferromagnetic interaction dominates while the strong short-range interaction dominates after relaxation, the near-degeneracy of the upper and levels making it possible to form a triplet without violating the Pauli exclusion principle.
IV Magnetic Ordering
The Ising spin model in two dimensions undergoes a phase transition to long-range magnetic order at a finite temperature Onsager (1944); Yang (1952). For a Heisenberg model with isotropic exchange interactions, thermal fluctuations destroy long-range magnetic ordering in two dimensions at any finite temperature Mermin and Wagner (1966); Hohenberg (1967). The Ising spin model, with spin dimensionality , is recovered by assuming a generalized Heisenberg spin Hamiltonian with isotropic exchange and strong perpendicular anisotropy. Though the predictions of such generalized Heisenberg models are not identical to those of the Ising spin model, the consensus is that for ferromagnetism to exist in two-dimensional systems, magnetic anisotropy is essential. We therefore begin this section on magnetic ordering by studying the magnetic anisotropy of a single substitutional dopant, the so-called single ion anisotropy (SIA).
IV.1 Single ion anisotropy
Microscopically, magnetic anisotropy arises when spin and orbital degrees of freedom are coupled by the spin-orbit interaction so that the total energy depends on the spatial orientation of the magnetic moment. According to the “force theorem” Mackintosh and Andersen (1980); Heine (1980), changes to the total energy, , that result from a small perturbation can be related to changes in the sum of the single-particle eigenstates of the Kohn-Sham equations Kohn and Sham (1965) of DFT, , which should not be iterated to self consistency. The force theorem has been applied to the calculation of the magnetic anisotropy energy (MAE) where the perturbation is the spin-orbit coupling (SOC) Daalderop et al. (1990) and comparison with explicit total energy calculations yields essentially perfect agreement for Fe, Co and Ni Stiles et al. (2001). The advantage of the force-theorem approach is that it allows the MAE to be directly related to (changes to) the electronic structure Daalderop et al. (1994a, b) which are shown for the relaxed configuration of a single V atom in a supercell of MoS2 in Fig. 19.
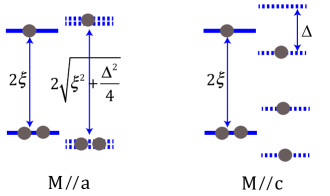
In the context of Fig. 10(e), we already discussed the exchange splitting of the and levels. In a supercell, the increased band dispersion leads to a smaller exchange splitting. With (without) relaxation, these splittings averaged over the Brillouin zone are, respectively, 66 (64) meV and 20 (22) meV (Fig. 19b). Because MX2 monolayers do not have inversion symmetry, SOC leads to a substantial splitting of the spin degenerate states at K and K′ with character () Zhu et al. (2011). In Fig. 19(c), we see that SOC splits the level at by 130 meV while the level with character () is not affected. For a larger (1212) supercell, the effect of SOC on the bands shown in Fig. 10(d) is to split the upper level so that it lies above the unaffected level and accommodates the hole.
To understand the energy levels obtained with SOC and spin polarization (exchange splitting) in the single impurity limit, it is instructive to consider the model Hamiltonian
| (10) |
where is the spin-independent part of the Hamiltonian, is the exchange field that leads to an exchange splitting , and is a unit vector in the direction of the magnetization, . In the subspace of the orbitals
| (11) |
where we use Hartree atomic units with . For ,
| (12) |
and the SOC Hamiltonian can be written as
| (13) |
For we have
| (14) |
Diagonalizing results in the energy level scheme sketched in Fig. 20. The magnetic anisotropy energy is , where and are the total energies when and , respectively. Using the force theorem, the energy change on including SOC is given by the change in the sum of single-particle eigenvalues. The reference energy (without SOC) cancels when the difference is taken for the two magnetization directions and, for occupancy with a single hole, can be estimated to be
| (15) |
where we make use of the fact that the sum over all single particle eigenvalues is zero to express the sum over occupied states in terms of the sum over unoccupied states that is simply the energy of the hole. In this simple model, it is clear that for single acceptors the energy is lower when the magnetization is out of plane. In the limit that , .
To determine the MAE using the vasp code 111The vasp guide, https://cms.mpi.univie.ac.at/vasp/vasp.pdf, we adopt a two step procedure. We first perform a well-converged self-consistent spin-polarized calculation for the minimum energy geometry without SOC. The output from that calculation is used as input to the second step where SOC is added and the Kohn-Sham equation is solved non self-consistently yielding a new eigenvalue spectrum, Fermi energy and wavefunctions from which a total energy can be determined; to use the force theorem, we will just make use of the eigenvalue-sum part of the total-energy output. When adding the SOC, an orientation for the exchange field (magnetization direction) needs to be chosen and this will yield an orientation dependent eigenvalue spectrum, Fermi energy etc. To determine the MAE, we need to perform two calculations with the magnetization chosen (i) perpendicular to the plane and (ii) in plane. The MAE will be expressed as the difference. To calculate the single particle eigenvalue sum for the electronic structure shown in Fig. 19 requires a careful BZ summation Daalderop et al. (1990, 1992, 1994a) for which we use the improved tetrahedron method Blöchl et al. (1994). The results obtained using the force theorem for a 66 supercell and 4, 8 and 12 divisions of the reciprocal lattice vectors are shown in Fig. 21 as a function of the BZ area element (2) normalized to the area, , of the BZ for a 11 primitive unit cell (black squares). An integral is defined as the limit where for an infinite number of sampling k points and from the figure we expect a value of meV.
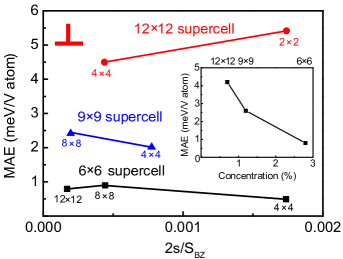
When the supercell size is increased and the dispersion of the and states becomes smaller, we might expect the BZ summation to converge faster but the situation is complicated by the near-degeneracy of the and bands. Fig. 21 includes results for 99 and 1212 supercells indicating a strong increase in the size of the in the single impurity limit. The strong dependence of the MAE on the supercell size can be understood in terms of the reduced dispersion of the impurity levels and the contribution to the MAE from states near the Fermi level whose degeneracy is lifted when the magnetization direction is rotated from in-plane with to out-of-plane with as illustrated by Fig. 19(d,e) and Fig. 20. For a 1212 supercell, we can extrapolate the results obtained using a 22 and 44 k-point sampling to estimate a converged MAE of 4.2 meV. The exchange-splitting is 15.2 meV for the level and using this value of and meV in (15) yields a value of meV that is still larger than the 4.2 meV estimate from the full calculation. We can extrapolate the results for the three sizes of supercell to and then plot the results as a function of the inverse supercell size (inset) to estimate the SIA in the infinite supercell limit to be meV per V ion. This is much larger than the value reported for 2D CrI3 Xu et al. (2018) that exhibits Ising behavior Huang et al. (2017). The dipole-dipole interactions that play an important role in determining whether or not the magnetization of thin magnetic layers and magnetic multilayers is in-plane or out-of-plane are orders of magnitude smaller in the present case and can be safely neglected. Daalderop et al. (1990, 1992, 1994a)
IV.2 Monte Carlo calculations
Very strong single-ion anisotropy combined with isotropic Heisenberg exchange results in Ising-like behaviour Leonel et al. (2006) which automatically gives a magnetically ordered phase at finite temperature Onsager (1944); Yang (1952). We map the energy differences calculated between FM and AFM oriented spins onto an isotropic Heisenberg exchange interaction and then model the V-doped MoS2 monolayer as an Ising spin system for which all odd moments disappear in zero field by symmetry. Monte Carlo calculations are used to determine the Curie temperature using Binder’s cumulant method Binder (1981); Landau and Binder (2009) where the fourth order cumulant of the magnetization simplifies to . As the system size , for and for . For large enough lattice size, curves for different values of cross as a function of temperature at a “fixed point” value and the location of the crossing fixed point is the critical point Landau and Binder (2009).
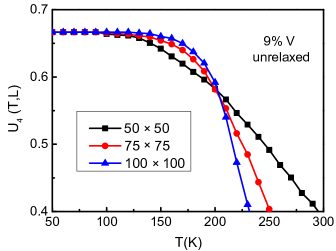
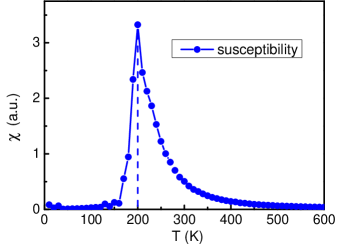
At a given temperature and doping concentration, we establish thermodynamic equilibrium in Monte Carlo (MC) thermalization steps and then average over 48 different random dopant configurations to obtain and . Three different lattice sizes with are used to calculate as a function of the temperature with doping concentrations from 1% to 11%. An example of the results is shown in Fig. 22 where the fitting curve for the unrelaxed case in Fig. 12 is used to describe the exchange interactions for a doping concentration of 9%. The temperature corresponding to the size independent universal fixed point where the curves for different lattice sizes intersect yields an estimate for . For the largest supercell size , we calculated the magnetic susceptibility which diverges at the critical temperature in the thermodynamic limit Landau and Binder (2009). An example is shown in Fig. 23 in which the Curie temperature obtained from the position of the magnetic susceptibility peak is in good agreement with that obtained from the fourth order cumulant.
IV.3 Curie temperature

| SC size (# atoms) | Vac. | Exchange | ||||||||
| Default | Max/test | Dopant | Method | XC | U(eV) | (Å) | Code | MAE | Int. | Reference |
| V, Nb, Ta | US-PP | GGA/PBE | 0 | 10 | QE | No | No | Cheng PRB13 Cheng et al. (2013) | ||
| V | PAW | GGA/PBE | 0 | 12 | VASP | No | No | Yue PLA13 Yue et al. (2013) | ||
| Nb | NC-PP | LDA/CA | 0 | 15 | SIESTA | No | No | Dolui PRB13 Dolui et al. (2013) | ||
| Nb | PAW | HSE | 0 | VASP | No | No | " " | |||
| V | PAW | GGA/PBE | 0 | 15 | VASP | No | No | Yun PCCP14 Yun and Lee (2014) | ||
| V | PAW | GGA/PBE | 5.5 | VASP | No | No | Andriotis PRB14 Andriotis and Menon (2014) | |||
| V, Nb, Ta | US-PP | GGA/PBE | 0 | 12 | QE | No | No | Lu NRL14 Lu and Leburton (2014) | ||
| V | PAW | GGA/PBE | 0 | 15 | VASP | No | No | Miao JMS16 Miao et al. (2016) | ||
| V | PAW | GGA/PBE | 3 | 15 | VASP | No | Yes | Fan NRL16 Fan et al. (2016) | ||
| Cr, V | PAW | GGA/PBE | 0 | 20 | VASP | No | No | Robertson ACSN16 Robertson et al. (2016) | ||
| V, Cr | FLAPW | GGA | 2.5 | 15 | WIEN2K | No | No | Singh AM17 Singh and Schwingenschlögl (2017) | ||
| V | PAW | GGA/PBE | 0 | 16 | VASP | No | Yes | Miao ASS18 Miao et al. (2018) | ||
| Nb, Ta | PAW | HSE | 0 | 17 | VASP | No | No | Choi PRAP Choi (2018) | ||
| V | US-PP | GGA | 3 | 20 | QE | No | Yes | Mekonnen IJMPB18 Mekonnen and Singh (2018) | ||
| V, Nb, Ta | PAW | LDA(GGA) | — | 20 | VASP | Yes | Yes | This work | ||
The ordering temperatures we calculate are shown in Fig. 24 for V doping concentrations in the range from 1% to 11%. Without relaxation, increases monotonically with doping concentration and reaches room temperature for a concentration of %. With relaxation, the ferromagnetic exchange interaction is quenched for close dopant pairs and exhibits a maximum of K for 9% doping. If we extrapolate the exchange interaction for relaxed dopant pairs to separations smaller than the critical separation where quenching occurs (dashed line in Fig. 12), the Curie temperature increases rapidly and monotonically with doping concentration and exceeds room temperature for dopant concentrations larger than 9%. Because the maximum value of we obtain would be higher but for the quenching of the magnetic moments of closely separated relaxed dopants, it becomes important to consider how to suppress the quenching to obtain higher Curie temperatures. This will be discussed in Sec. VI.
V Comparison with other work
Table 7 summarizes earlier computational work on doping MoS2 monolayers with V, Nb or Ta. Because much of it was concerned with doping rather than with magnetic ordering, no attempts were made to calculate the magnetic anisotropy. Most of the calculations were done using small supercells and the separation dependence of the exchange interaction was not studied systematically, if at all. We noted in Sec. II that the GGA positions the -point VBM too high with respect to the K-point VBM by comparison with experiment Jin et al. (2013) and we therefore used the LDA that yields better agreement with experiment in this regard. Because most of the calculations referred to in Table 7 were performed with the GGA exchange-correlation potential, we examine the effect of using the GGA rather than the LDA.
V.0.1 GGA versus LDA
If we use atomic configurations whose geometry was optimized using the LDA and repeat the electronic structure calculations using the GGA, we qualitatively reproduce the LDA results for the exchange interaction between V dopant atoms. The significant differences that will be documented below therefore have their origin in the only slightly different minimum-energy geometries predicted by the GGA.
Our starting point is an MoS2 monolayer whose lattice constant Å minimizes the GGA total energy, Table 1. The GGA overestimate of the position of the -point VBM with respect to the K/K′ VBM makes the level much higher than the levels as shown in Fig. 25 where these levels are plotted as a function of supercell size. The asymptotic values are 76 and meV for the and states, respectively compared to meV for both in the LDA case, Fig. 7. Compared to the LDA estimate of a Bohr radius of 4.2Å from the radial extent of the partial charge density in Fig. 5, with the GGA we find a slightly larger value of 4.7Å for the state. By analogy with a hydrogen atom where the extent of the 1 orbital increases greatly for the H- ion compared to the neutral atom, we attribute the slightly larger radial extent for the more strongly bound hole in the GGA case to its greater (hole) occupancy. In the GGA, the doped system is fully spin-polarized for the smallest 33 supercell we considered and the exchange splitting of 142 meV is much larger than the 91 meV we found in the unrelaxed LDA case. (The LDA predicts an exchange splitting of Rydberg for a hydrogen atom compared to 0.55 Rydberg for the GGA; see appendix B).
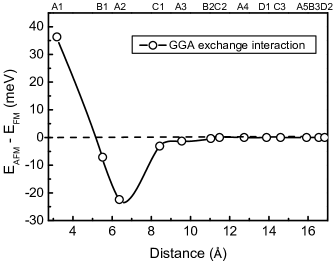
Fig. 26 shows the exchange interaction calculated with the GGA for pairs of unrelaxed VMo dopants as a function of the distance between them. We observe an oscillatory behavior with FM coupling for neighbouring pairs (“A1” configuration, see Fig. 3) that switches to AFM for B1, A2, C1 and A3 configurations after which it is essentially zero reflecting the small effective Bohr radius of the level (Å). The relatively large separation in energy of the and levels means that for separations larger than Å, both holes are to be found in the anti-bonding level because the bonding-antibonding interaction is too weak to lead to hole occupancy of the level. Because both holes must of necessity occupy the level, their spins must be opposite and FM ordering is energetically unfavourable (though the energy difference is very small).
To understand the oscillation for small separations, we consider the electronic structures of the and derived – and – bonding and antibonding states for the A1 and A2 configurations in Fig. 27 with and without spin polarization. We begin with the A1 configuration. Compared to the LDA case that was shown in Fig. 13(b), we see that the unpolarized and levels (lhs of Fig. 27) are higher than the – levels reflecting the corresponding feature for a single substitutional dopant and that the – bonding-antibonding interaction is larger because the Bohr radius of the states is larger in the GGA. On the rhs of the A1 panel, we see that the exchange splitting of the levels is approximately doubled to meV for the A1 configuration compared to the single VMo case because of the overlapping hole densities; the same doubling occurs in the LSDA, where the exchange splitting of meV for a single substitutional V is enhanced to meV for neighbouring V pairs, see Fig. 15. The exchange splitting is so large that the down-spin level moves below the (approximately doubly) degenerate up-spin level with the result that the hole can flip its spin and the Fermi level is pinned in the half-filled up-spin state. By having one hole in an state and the other in an state it is possible for their spins to be parallel and to simultaneously gain spin-polarization and bonding energy.
As the separation between the VMo atoms is increased, the exchange splitting and bonding interaction decrease rapidly for the states and a FM triplet state is only formed at the expense of having one hole occupying a bonding state (rhs of A2 panel); spin-polarization energy gain is offset by loss of bonding energy. Antiparallel alignment of the holes allowing gain of both spin-polarization and bonding energy becomes more favourable.
The effect of relaxation is to push the level up in energy and increase the – bonding-antibonding splitting so that the unpolarized electronic structure resembles that of Fig. 13(e) with both holes in the level. For dopant separations less than Å this leads to quenching of the magnetism. For separations larger than this, the levels (Å) interact only weakly with each other leading to very small energy differences and negligible exchange interaction because the related levels are too low in energy to be occupied.
As anticipated at the beginning of this section, we can trace the large difference between the GGA and LDA descriptions of the exchange interaction between pairs of VMo dopants to the 2% difference between the LDA and GGA lattice constants. If we use the experimental lattice parameters listed in Table 1, the differences between LDA and GGA disappear and we find that near-degenerate and impurity levels with binding energies of 56 meV in a direct band gap of 1.78 eV couple ferromagnetically for all separations. The different orbital character of the and levels means that they are very sensitive to the in-plane lattice constant and out-of-plane , respectively, whose ratio determines their relative positions. From Table 1, we see that the LDA ratio of 1.001 is much closer to the experimental value of 0.996 than the GGA ratio of 1.018 and argue that the LDA provides a more reasonable description of the relative position of the impurity levels.
When SOC is taken into consideration, the energy difference between the K/K′ and -point valence band maxima increases from 150 to 216 meV for LDA and from 12 to 88 meV for GGA, respectively, because of the large spin-orbit splitting at the K/K′ point, Table 8. The experimental value, 140 meV, is just in between making it unclear what will actually happen. To resolve this issue, experiment should focus on determining the position of the level with respect to the top of the valence band in the single impurity limit.
Because the relative position of the impurity states determines the exchange interaction between dopant atoms, we have performed exploratory calculations to tune the relative positions of the K/K′ and valence band maxima and consequently of the and levels with strain. For GGA, a 1% compressive strain () is found to lower the levels to be degenerate with the levels and we find FM coupling for all separations. 2% tensile strain () lifts the levels far above the levels stabilizing the magnetic moment of single impurities but favouring singlet formation of impurity pairs and AFM coupling. So while tensile strain reduces the formation energies of NbMo and TaMo and facilitates doping of MoS2 Choi (2018), it is detrimental for ferromagnetic ordering.
If the exchange interactions are so sensitive to the lattice constant and the ratio of to , it might be useful to consider tuning this ratio by modifying either using strain or by alloying, Mo(S/Se/Te)2. In the MoSe2, MoTe2 and WSe2 systems, the level lies so much lower than the level that using GGA or LDA with their different lattice parameters has little effect; the coupling is dominated by the long range of the levels.
V.0.2 LDA + U
Two of the studies cited in Table 7 use a finite value of to better describe onsite Coulomb repulsion between electrons in localized orbitals Andriotis and Menon (2014); Singh and Schwingenschlögl (2017). We find that LDA+U Dudarev et al. (1998) with modest values of makes the local magnetic moment more localized and enhances it. The (more localized) level is more sensitive to than the level.
A small value of (less than 1 eV) increases the exchange splitting of the level and increases the FM exchange interaction which would yield a larger compared to calculations without . A larger value of (larger than 3 eV) causes the hole to become even more localized and fully polarized even at very high concentrations (25%). As a consequence, the exchange interaction decays more rapidly and the separation below which quenching occurs decreases because the bonding interaction decays more rapidly. Compared to LDA calculations, the Curie temperature would be lower at low dopant concentration but enhanced at high concentration.
In our LDA calculations, we find that the shallow vanadium 3 orbitals hybridize strongly with S-3 and Mo-4 orbitals delocalizing the holes. We expect the Coulomb in our system to be small and with a small , the Curie temperature should be enhanced. Our LDA results should thus represent a lower bound on the exchange interaction and ordering temperature.
VI Discussion
According to the Zener – model used to interpret magnetic coupling in Ga(Mn)As dilute magnetic semiconductors Dietl (2010), holes in As () bonding states mediate the exchange interaction between strong local () magnetic moments on Mn2+ dopant ions. In the present case, the magnetic moments that we find come from unpaired () spins in gap states that are only weakly bound by the Coulomb potential of the dopant ions, Fig. 2. The large Bohr radii we find for these states, Table 2, allows them to overlap to form narrow bands and suggests that on-site Coulomb interactions may play a minor role and a model of itinerant ferromagnetism may be more appropriate than the various localized models used to study the Ga(Mn)As and related systems Jungwirth et al. (2006); Sato et al. (2010). When the holes are in orbitally nondegenerate levels, AFM coupling is favoured to satisfy Pauli’s exclusion principle; when they are in the degenerate levels, FM coupling is preferred to minimize the Coulomb interaction. For MoS2, the (accidental) near-degeneracy of the and hole states leads to them competing to determine the magnetic properties whereby the strength of the exchange interaction is related to the exchange splitting of the impurity band and will be affected by the band dispersion for high doping concentrations.
In the low doping limit, the impurity states have no dispersion and are fully polarized. As the impurity concentration is increased, the impurity levels overlap to form narrow bands that broaden and eventually overlap the narrow Mo band that forms the top of the valence band. As seen in Fig. 8, the impurity bandwidth increases exponentially with increasing doping concentration. For the 9% V dopant concentration for which we find to be a maximum, the impurity bandwidth is meV. The band is narrower, only about a third as wide. Both bandwidths exceed the 91 meV exchange splitting we find for single V impurities in Fig. 10 that would imply partial quenching of the magnetic moments. For the ordered V dopants studied in Table 4, this quenching occurs as the concentration is increased above 3% and is complete by 6%. For itinerant electrons occupying narrow bands, it has been argued that the effective interaction predicted by the Stoner criterion will not be reduced by correlation effects or spin wave excitations Edwards and Katsnelson (2006). In contrast to traditional dilute magnetic semiconductors with large local moments that do not contribute to the spin stiffness, the completely spin polarized carriers in narrow impurity bands lead to a large spin stiffness and develop ferromagnetic ordering by their mutual interaction.
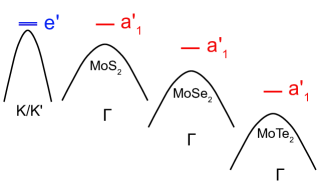
The quenching of ferromagnetic pairing for close impurity pairs can be avoided by considering instead of MoS2 as host semiconductor, MoSe2 or MoTe2 (WSe2 or WTe2) for which the point VBM drops with respect to the K/K′ VBM as SSeTe (sketched in Fig. 28). Preliminary calculations show that the defect levels do indeed follow the point VBM leaving the holes in the orbitally degenerate derived impurity bands. The increased lattice constant makes the states more localized and enhances the spin polarization in MoSe2 and MoTe2. Very recently there have been reports of long-range and/or room temperature ferromagnetism occurring in V doped WSe2 monolayers Yun et al. , in MoSe2 and MoTe2 Guguchia et al. (2018), in V and Ta doped MoTe2 Coelho et al. (2019); Yang et al. (2019) and in MoS2 Hu et al. (2019) whereby the interaction with anion vacancies would appear to play an important role. These systems clearly warrant closer study.
We might expect double acceptors to have larger magnetic moments and exchange interactions. However, when MoS2 is doped with Ti, Zr, Hf on the Mo site, the level is lifted far above the levels and accommodates both holes so such substitutional impurities are nonmagnetic in the single impurity limit. Only when dopant pairs are sufficiently close ( Å) does strong bonding lift the antibonding level above the bonding level so all four holes occupy antibonding states. The two holes in the states can become ferromagnetic with a total magnetic moment of 2 but this does not represent an improvement on the single acceptor case.
In MoSe2 or MoTe2 (WSe2 or WTe2) monolayers where the point VBM lies well below the K/K′ VBM, the two holes introduced by double acceptors occupy states that can acccomodate four holes. Half-filling of these degenerate levels leads to a competition between Jahn-Teller distortion and exchange splitting. If the Jahn-Teller distortion is sufficiently strong, the magnetic moment will be quenched and we do not expect double acceptors to be magnetic for low doping concentrations.
VII Summary & Conclusions
We have used ab initio calculations to explore the possibility of inducing ferromagnetism in an MoS2 monolayer by substitutionally doping it with V, Nb or Ta on Mo sites. In the single impurity limit, the resulting repulsive Coulomb potential leads to a doubly degenerate state with symmetry bound to the K/K′ valence band maxima and a singly degenerate state with character bound to the slightly lower-lying -point valence band maximum that are accidentally degenerate. The exchange interaction between two such hole states depends on whether the holes have or character, the former being quite localized, the latter quite extended in space. The magnetic moments of the spin acceptor states couple ferromagnetically at low concentrations but if the dopants are closer than the effective Bohr radius of the orbital, the magnetic moments quench in order to profit from the bonding interaction. The details of the exchange interaction depend sensitively on the equilibrium structure of the undoped monolayer that in turn depends on the (approximate) exchange-correlation functional used. We argue that the LDA is preferable to the GGA because it describes the ordering of the K/K′ and valence band maxima better compared to experiment.
When spin-orbit coupling is included, we calculate a large magnetic anisotropy energy for acceptors with a preference for out of plane orientation and argue that this large single ion anisotropy justifies using an Ising spin model to study the ferromagnetic ordering. We estimate the ordering temperature by combining our (isotropic) separation-dependent exchange interactions with Monte Carlo calculations using Binder’s cumulant method. For an MoS2 monolayer doped with V (Nb or Ta), we estimate ferromagnetic Curie temperatures as a function of the dopant concentration and find a maximum of 170 K (100 K) at around 9% dopant concentration. At sufficiently high concentrations of impurity states, the acceptor states form bands and magnetism is quenched when the bandwidth exceeds a critical value; this critical value depends sensitively on the exchange-correlation functional used.
Although the maximum calculated is below room temperature, our work demonstrates that shallow impurities in MX2 monolayers that bind weakly but have long range interactions are promising dopants to explore with a view to realizing room temperature ferromagnetism.
Acknowledgements.
This work was financially supported by the “Nederlandse Organisatie voor Wetenschappelijk Onderzoek” (NWO) through the research programme of the former “Stichting voor Fundamenteel Onderzoek der Materie,” (NWO-I, formerly FOM) and through the use of supercomputer facilities of NWO “Exacte Wetenschappen” (Physical Sciences). Y. G. thanks the China Scholarship Council for financial support. N.G. is grateful to Dr. Supravat Dey for fruitful discussions.Appendix A Sulphur reference atom
The impurity potential of a vanadium acceptor screened by a hole in the and states as felt by S atoms is plotted in the insets to Fig. 29. The effective Bohr radii of these impurity states determined by fitting to Eq. (1b) are 8.8 Å for screening by the state and 6.5 Å for screening by the state. For the level, this effective Bohr radius is consistent with the other estimates summarized in Table 2. For the level, however, the value of 6.5 Å yielded by the S atom probes is larger than the value of 5.4 Å yielded by using Mo atoms as probes. We already saw more scatter in the estimate of the radius and in view of its very small value and the importance of the central cell potential and local screening effects on this length scale, it is not surprising to see this type of variation measured by probes at different radial distances.
Appendix B Hydrogen atom in LDA/GGA
| LDA | GGA | |||
| NSP | SP | NSP | SP | |
In the local density approximation (LDA), the total energy of a neutral hydrogen atom is not Rydberg but its absolute value is about 10% smaller, Rydberg and the Kohn-Sham eigenvalue for the 1 state is Gunnarsson et al. (1974). It has been shown that the discrepancy can be substantially reduced by using the spin-polarized (SP) version of the LDA, the local spin density approximation (LSDA) Gunnarsson et al. (1974). Using the Perdew-Zunger Perdew and Zunger (1981) parameterization of L(S)DA, we obtain total energies () and KS eigenvalues () of Ry, Ry (LDA) and Ry (LSDA) and an exchange splitting of the Kohn-Sham eigenvalues of -0.35 Ry. If instead of the L(S)DA, we use the Perdew-Burke-Ernzerhof Perdew et al. (1996) GGA, we obtain energies of -0.92 Ry (GGA) and -0.99 Ry (SP-GGA) and an exchange splitting of -0.55 Ry.
References
- Ohno et al. (1992) H. Ohno, H. Munekata, T. Penney, S. von Molnár, and L. L. Chang, “Magnetotransport properties of -type (In,Mn)As diluted magnetic III-V semiconductors,” Phys. Rev. Lett. 68, 2664–2667 (1992).
- Ohno et al. (1996) H. Ohno, A. Shen, F. Matsukura, A. Oiwa, A. Endo, S. Katsumoto, and Y. Iye, “(Ga,Mn)As: A new diluted magnetic semiconductor based on GaAs,” Appl. Phys. Lett. 69, 363–365 (1996).
- Dietl et al. (2000) T. Dietl, H. Ohno, F. Matsukura, J. Cibert, and D. Ferrand, “Zener model description of ferromagnetism in zinc-blende magnetic semiconductors,” Science 287, 1019–1022 (2000).
- Dietl (2010) Tomasz Dietl, “A ten-year perspective on dilute magnetic semiconductors and oxides,” Nat. Mater. 9, 965–974 (2010).
- Jungwirth et al. (2006) T. Jungwirth, Jairo Sinova, J. Mašek, J. Kučera, and A. H. MacDonald, “Theory of ferromagnetic (III,Mn)V semiconductors,” Rev. Mod. Phys. 78, 809–864 (2006).
- Sato et al. (2010) K. Sato, L. Bergqvist, J. Kudrnovský, P. H. Dederichs, O. Eriksson, I. Turek, B. Sanyal, G. Bouzerar, H. Katayama-Yoshida, V. A. Dinh, T. Fukushima, H. Kizaki, and R. Zeller, “First-principles theory of dilute magnetic semiconductors,” Rev. Mod. Phys. 82, 1633–1690 (2010).
- Mermin and Wagner (1966) N. D. Mermin and H. Wagner, “Absence of Ferromagnetism or Antiferromagnetism in One- or Two-Dimensional Isotropic Heisenberg Models,” Phys. Rev. Lett. 17, 1133–1136 (1966).
- Hohenberg (1967) P. C. Hohenberg, “Existence of long-range order in one and two dimensions,” Phys. Rev. 158, 383–386 (1967).
- UMS (1994-2005) in Ultrathin Magnetic Structures I-IV, edited by J. A. C. Bland and B. Heinrich (Springer-Verlag, Berlin, 1994-2005).
- Gong et al. (2017) Cheng Gong, Lin Li, Zhenglu Li, Huiwen Ji, Alex Stern, Yang Xia, Ting Cao, Wei Bao, Chenzhe Wang, Yuan Wang, Z. Q. Qiu, R. J. Cava, Steven G. Louie, Jing Xia, and Xiang Zhang, “Discovery of intrinsic ferromagnetism in two-dimensional van der Waals crystals,” Nature (London) 546, 265–269 (2017).
- Huang et al. (2017) Bevin Huang, Genevieve Clark, Efrén Navarro-Moratalla, Dahlia R. Klein, Ran Cheng, Kyle L. Seyler, Ding Zhong, Emma Schmidgall, Michael A. McGuire, David H. Cobden, Wang Yao, Di Xiao, Pablo Jarillo-Herrero, and Xiaodong Xu, “Layer-dependent ferromagnetism in a van der Waals crystal down to the monolayer limit,” Nature (London) 546, 270–273 (2017).
- Samarth (2017) Nitin Samarth, “Magnetism in flatland,” Nature (London) 546, 216–218 (2017).
- Novoselov et al. (2004) K. S. Novoselov, A. K. Geim, S. V. Morozov, D. Jiang, Y. Zhang, S. V. Dubonos, I. V. Grigorieva, and A. A. Firsov, “Electric Field Effect in Atomically Thin Carbon Films,” Science 306, 666–669 (2004).
- Novoselov et al. (2005) K. S. Novoselov, D. Jiang, F. Schedin, T. J. Booth, V. V. Khotkevich, S. V. Morozov, and A. K. Geim, “Two-dimensional atomic crystals,” Proc. Natl. Acad. Sci. U.S.A. 102, 10451–10453 (2005).
- Novoselov et al. (2012) K. S. Novoselov, V. I. Fal’ko, L. Colombo, P. R. Gellert, M. G. Schwab, and K. Kim, “A roadmap for graphene,” Nature (London) 490, 192–200 (2012).
- Splendiani et al. (2010) Andrea Splendiani, Liang Sun, Yuanbo Zhang, Tianshu Li, Jonghwan Kim, Chi-Yung Chim, Giulia Galli, and Feng Wang, “Emerging photoluminescence in monolayer MoS2,” Nano Letters 10, 1271–1275 (2010).
- Mak et al. (2010) Kin Fai Mak, Changgu Lee, James Hone, Jie Shan, and Tony F. Heinz, “Atomically Thin MoS2: A New Direct-Gap Semiconductor,” Phys. Rev. Lett. 105, 136805 (2010).
- Radisavljevic et al. (2011) B. Radisavljevic, A. Radenovic, J. Brivio, V. Giacometti, and A. Kis, “Single-layer MoS2 transistors,” Nat. Nanotechnol. 6, 147–150 (2011).
- Geim and Grigorieva (2013) A. K. Geim and I. V. Grigorieva, “Van der Waals heterostructures,” Nature (London) 499, 419–425 (2013).
- Gibertini et al. (2019) M. Gibertini, M. Koperski, A. F. Morpurgo, and K. S. Novoselov, “Magnetic 2D materials and heterostructures,” Nat. Nanotechnol. 14, 408–419 (2019).
- Bonilla et al. (2018) Manuel Bonilla, Sadhu Kolekar, Yujing Ma, H. C. Diaz, Vijaysankar Kalappattil, Raja Das, Tatiana Eggers, H. R. Gutierrez, Manh-Huong Phan, and Matthias Batzill, “Strong room-temperature ferromagnetism in VSe2 monolayers on van der Waals substrates,” Nat. Nanotechnol. 13, 289–294 (2018).
- Deng et al. (2018) Yujun Deng, Yijun Yu, Yichen Song, Jingzhao Zhang, Nai Zhou Wang, Zeyuan Sun, Yangfan Yi, Yi Zheng Wu, Shiwei Wu, Junyi Zhu, Jing Wang, Xian Hui Chen, and Yuanbo Zhang, “Gate-tunable room-temperature ferromagnetism in two-dimensional Fe3GeTe2,” Nature (London) 563, 94–99 (2018).
- (23) Though they state that they are studying trigonal prismatic (H) monolayers, it is clear from their sketches of the structure as well as the density of states and magnetic moments that the calculations of Ma et al. were for the octahedral (T) phase Ma et al. (2012). Subsequent studies of both phases Ataca et al. (2012); Zhang et al. (2013); Gan et al. (2013); Kan et al. (2015); Wasey et al. (2015); Zhuang and Hennig (2016) find the H phase to have a lower energy and to be magnetic with a moment of /V atom.
- Li and Galli (2007) T. Li and G. Galli, “Electronic properties of MoS2 nanoparticles,” J. Phys. Chem. C 111, 16192–16196 (2007).
- Bromley et al. (1972) R. A. Bromley, R. B. Murray, and A. D. Yoffe, “The band structures of some transition metal dichalcogenides: III. Group VI A: trigonal prism materials,” J. Phys. C: Sol. State Phys. 5, 759–778 (1972).
- Mattheiss (1973) L. F. Mattheiss, “Band structures of transition-metal-dichalcogenide layer compounds,” Phys. Rev. B 8, 3719–3740 (1973).
- Ataca and Ciraci (2011) C. Ataca and S. Ciraci, “Functionalization of single-layer MoS2 honeycomb structures,” J. Phys. Chem. C 115, 13303–13311 (2011).
- Lu and Leburton (2014) Shang-Chun Lu and Jean-Pierre Leburton, “Electronic structures of defects and magnetic impurities in MoS2 monolayers,” Nanoscale Research Letters 9, 676 (2014).
- Hong et al. (2015) Jinhua Hong, Zhixin Hu, Matt Probert, Kun Li, Danhui Lv, Xinan Yang, Lin Gu, Nannan Mao, Qingliang Feng, Liming Xie, Jin Zhang, Dianzhong Wu, Zhiyong Zhang, Chuanhong Jin, Wei Ji, Xixiang Zhang, Jun Yuan, and Ze Zhang, “Exploring atomic defects in molybdenum disulphide monolayers,” Nat. Communications 6, 6293 (2015).
- Li et al. (2016) Wun-Fan Li, Changming Fang, and Marijn A. van Huis, “Strong spin-orbit splitting and magnetism of point defect states in monolayer WS2,” Phys. Rev. B 94, 195425 (2016).
- Khan and Leuenberger (2018) M. A. Khan and Michael N. Leuenberger, “Room-temperature superparamagnetism due to giant magnetic anisotropy in MoS defected single-layer MoS2,” J. Phys.: Condens. Matter 30, 155802 (2018).
- He et al. (2010) Jiangang He, Kechen Wu, Rongjian Sa, Qiaohong Li, and Yongqin Wei1, “Magnetic properties of nonmetal atoms absorbed MoS2 monolayers,” Appl. Phys. Lett. 96, 082504 (2010).
- Dolui et al. (2013) Kapildeb Dolui, Ivan Rungger, Chaitanya Das Pemmaraju, and Stefano Sanvito, “Possible doping strategies for MoS2 monolayers: An ab initio study,” Phys. Rev. B 88, 075420 (2013).
- Karthikeyan et al. (2019) J. Karthikeyan, H. P. Komsa, M. Batzill, and A. V. Krasheninnikov, “Which transition metal atoms can be embedded into two-dimensional molybdenum dichalcogenides and add magnetism?” Nano Letters 19, 4581–4587 (2019).
- Cheng et al. (2013) Y. C. Cheng, Z. Y. Zhu, W. B. Mi, Z. B. Guo, and U. Schwingenschlögl, “Prediction of two-dimensional diluted magnetic semiconductors: Doped monolayer MoS2 systems,” Phys. Rev. B 87, 100401(R) (2013).
- Yue et al. (2013) Qu Yue, Shengli Chang, Shiqiao Qin, and Jingbo Li, “Functionalization of monolayer MoS2 by substitutional doping: A first-principles study,” Phys. Lett. A 377, 1362–1367 (2013).
- Ramasubramaniam and Naveh (2013) Ashwin Ramasubramaniam and Doron Naveh, “Mn-doped monolayer MoS2: An atomically thin dilute magnetic semiconductor,” Phys. Rev. B 87, 195201 (2013).
- Mishra et al. (2013) Rohan Mishra, Wu Zhou, Stephen J. Pennycook, Sokrates T. Pantelides, and Juan-Carlos Idrobo, “Long-range ferromagnetic ordering in manganese-doped two-dimensional dichalcogenides,” Phys. Rev. B 88, 144409 (2013).
- Yun and Lee (2014) Won Seok Yun and J. D. Lee, “Unexpected strong magnetism of Cu doped single-layer MoS2 and its origin,” Physical Chemistry Chemical Physics 16, 8990–8996 (2014).
- Qi et al. (2014) Jingshan Qi, Xiao Li, Xiaofang Chen, and Kaige Hu, “Strain tuning of magnetism in Mn doped MoS2 monolayer,” J. Phys.: Condens. Matter 26, 256003 (2014).
- Gil et al. (2014) Carmen J. Gil, Anh Pham, Aibing Yu, and Sean Li, “An ab initio study of transition metals doped with WSe2 for long-range room temperature ferromagnetism in two-dimensional transition metal dichalcogenide,” J. Phys.: Condens. Matter 26, 306004 (2014).
- Andriotis and Menon (2014) Antonis N. Andriotis and Madhu Menon, “Tunable magnetic properties of transition metal doped MoS2,” Phys. Rev. B 90, 125304 (2014).
- Zhang et al. (2015) Jianmin Zhang, Huiling Zheng, Ruilin Han, Xiaobo Du, and Yu Yan, “Tuning magnetic properties of CrS2 monolayer by doping transition metal and alkaline-earth atoms,” J. Alloys Compd. 647, 75–81 (2015).
- Miao et al. (2016) Yaping Miao, Yuhong Huang, Qinglong Fang, Zhi Yang, Kewei Xu, Fei Ma, and Paul K. Chu, “Tuning of electronic states and magnetic polarization in monolayered MoS2 by codoping with transition metals and nonmetals,” J. Mater. Sci. 51, 9514–9525 (2016).
- Zhao et al. (2016a) Xu Zhao, Congxin Xia, Tianxing Wang, and Xianqi Dai, “Electronic and magnetic properties of X-doped (X = Ti, Zr, Hf) tungsten disulphide monolayer,” J. Alloys Compd. 654, 574–579 (2016a).
- Zhao et al. (2016b) Xu Zhao, Peng Chen, Congxin Xia, Tianxing Wang, and Xianqi Dai, “Electronic and magnetic properties of -type and -doped MoS2 monolayers,” RSC Advances 6, 16772 (2016b).
- Fan et al. (2016) Xiao-Li Fan, Yu-Rong An, and Wen-Jun Guo, “Ferromagnetism in transitional metal-doped MoS2 monolayer,” Nanoscale Research Letters 11, 154 (2016).
- Robertson et al. (2016) Alex W. Robertson, Yung-Chang Lin, Shanshan Wang, Hidetaka Sawada, Christopher S. Allen, Qu Chen, Sungwoo Lee, Gun-Do Lee, Joohee Lee, Seungwu Han, Euijoon Yoon, Angus I. Kirkland, Heeyeon Kim, Kazu Suenaga, and Jamie H. Warner, “Atomic structure and spectroscopy of single metal (Cr, V) substitutional dopants in monolayer MoS2,” ACS Nano 10, 10227–10236 (2016).
- Singh and Schwingenschlögl (2017) N. Singh and U. Schwingenschlögl, “A route to permanent valley polarization in monolayer MoS2,” Adv. Mater. 29, 1600970 (2017).
- Miao et al. (2018) Yaping Miao, Yan Li, Qinglong Fang, Yuhong Huang, Yunjin Sund, Kewei Xub, Fei Ma, and Paul K. Chu, “Effects of dopant separation on electronic states and magnetism in monolayer MoS2,” Appl. Surf. Sci. 428, 226–232 (2018).
- Mekonnen and Singh (2018) Sintayehu Mekonnen and Pooran Singh, “Electronic structure and nearly room-temperature ferromagnetism in V-doped monolayer and bilayer MoS2,” International Journal of Modern Physics B 32, 1850231 (2018).
- Gao et al. (2019) Yuqiang Gao, Nirmal Ganguli, and Paul J. Kelly, “Itinerant ferromagnetism in p-doped monolayers of MoS2,” Phys. Rev. B 99, 220406(R) (2019).
- Peelaers and Van de Walle (2012) Hartwin Peelaers and Chris G. Van de Walle, “Effects of strain on band structure and effective masses in MoS2,” Phys. Rev. B 86, 241401 (2012).
- Edwards and Katsnelson (2006) D. M. Edwards and M. I. Katsnelson, “High-temperature ferromagnetism of sp electrons in narrow impurity bands: application to CaB6,” J. Phys.: Condens. Matter 18, 7209–7225 (2006).
- Blöchl (1994) P. E. Blöchl, “Projector augmented-wave method,” Phys. Rev. B 50, 17953–17979 (1994).
- Kresse and Hafner (1993) G. Kresse and J. Hafner, “Ab initio molecular dynamics for open-shell transition metals,” Phys. Rev. B 48, 13115 (1993).
- Kresse and Furthmüller (1996) G. Kresse and J. Furthmüller, “Efficient iterative schemes for ab initio total-energy calculations using a plane-wave basis set,” Phys. Rev. B 54, 11169–11186 (1996).
- Kresse and Joubert (1999) G. Kresse and D. Joubert, “From ultrasoft pseudopotentials to the projector augmented-wave method,” Phys. Rev. B 59, 1758–1775 (1999).
- Böker et al. (2001) Th. Böker, R. Severin, A. Müller, C. Janowitz, R. Manzke, D. Voß, P. Krüger, A. Mazur, and J. Pollmann, “Band structure of MoS2 , MoSe2, and a-MoTe2: Angle-resolved photoelectron spectroscopy and ab initio calculations,” Phys. Rev. B 64, 235305 (2001).
- Jin et al. (2013) W. C. Jin, P. C. Yeh, N. Zaki, D. T. Zhang, J. T. Sadowski, A. Al-Mahboob, A. M. van der Zande, D. A. Chenet, J. I. Dadap, I. P. Herman, P. Sutter, J. Hone, and R. M. Osgood, “Direct Measurement of the Thickness-Dependent Electronic Band Structure of MoS2 using Angle-Resolved Photoemission Spectroscopy,” Phys. Rev. Lett. 111, 106801 (2013).
- Perdew and Zunger (1981) J. P. Perdew and A. Zunger, “Self-interaction correction to density-functional approximations for many-electron systems,” Phys. Rev. B 23, 5048–5079 (1981).
- Perdew et al. (1996) John P. Perdew, Kieron Burke, and Matthias Ernzerhof, “Generalized gradient approximation made simple,” Phys. Rev. Lett. 77, 3865–3868 (1996).
- Pantelides (1978) S. T. Pantelides, “The electronic structure of impurities and other point defects in semiconductors,” Rev. Mod. Phys. 50, 797–858 (1978).
- Lannoo and Bourgoin (1981) M. Lannoo and J. Bourgoin, Point Defects in Semiconductors I: Theoretical Aspects, edited by M. Carona, P. Fulde, and H.-J. Queisser, Springer Series in Solid-State Sciences, Vol. 22 (Springer, Berlin, 1981).
- Altarelli and Bassani (1982) M. Altarelli and F. Bassani, “Impurity states: Theoretical,” in Handbook on Semiconductors edited by T. S. Moss, Vol. 1, edited by W. Paul (North-Holland, Amsterdam, 1982) pp. 269–322.
- Smith et al. (2017) J. S. Smith, A. Budi, M. C. Per, N. Vogt, D. W. Drumm, L. C. L. Hollenberg, J. H. Cole, and S. P. Russo, “Ab initio calculation of energy levels for phosphorus donors in silicon,” Scientific Reports 7, 6010 (2017).
- Gunnarsson et al. (1974) O. Gunnarsson, B.I. Lundqvist, and J. W. Wilkins, “Contribution to the cohesive energy of simple metals: Spin-dependent effect,” Phys. Rev. B 10, 1319–1327 (1974).
- Aghajanian et al. (2018) Martik Aghajanian, Arash A. Mostofi, and Johannes Lischner, “Tuning electronic properties of transition-metal dichalcogenides via defect charge,” Scientific Reports 8, 13611 (2018).
- Yang et al. (1991) X. L. Yang, S. H. Guo, F. T. Chan, K. W. Wong, and W. Y. Ching, “Analytic solution of a two-dimensional hydrogen atom. I. Nonrelativistic theory,” Phys. Rev. A 43, 1186–1196 (1991).
- Laturia et al. (2018) Akash Laturia, Maarten L. Van de Put, and William G. Vandenberghe, “Dielectric properties of hexagonal boron nitride and transition metal dichalcogenides: from monolayer to bulk,” npj 2D Materials and Applications 2, 6 (2018).
- Yun et al. (2012) W. S. Yun, S. W. Han, S. C. Hong, I. G. Kim, and J. D. Lee, “Thickness and strain effects on electronic structures of transition metal dichalcogenides: 2H-MX2 semiconductors (M = Mo, W; X = S, Se, Te),” Phys. Rev. B 85, 033305 (2012).
- Gunnarsson and Lundqvist (1976) O. Gunnarsson and B.I. Lundqvist, “Exchange and correlation in atoms, molecules, and solids by the spin-density-functional formalism,” Phys. Rev. B 13, 4274–4298 (1976).
- Janak (1977) J. F. Janak, “Uniform susceptibilities of metallic elements,” Phys. Rev. B 16, 255–262 (1977).
- Dudarev et al. (1998) S. L. Dudarev, G. A. Botton, S. Y. Savrasov, C. J. Humphreys, and A. P. Sutton, “Electron-energy-loss spectra and the structural stability of nickel oxide: An LSDA+U study,” Phys. Rev. B 57, 1505–1509 (1998).
- Wu et al. (2018) Maokun Wu, Xiaolong Yao, Yuan Hao, Hong Dong, Yahui Cheng, Hui Liu, Feng Lu, Weichao Wang, Kyeongjae Cho, and Wei-Hua Wang, “Electronic structures, magnetic properties and band alignments of 3d transition metal atoms doped monolayer MoS2,” Phys. Lett. A 382, 111–115 (2018).
- Onsager (1944) L. Onsager, “Crystal Statistics. I. A Two-Dimensional Model with an Order-Disorder Transition,” Phys. Rev. 65, 117–149 (1944).
- Yang (1952) C. N. Yang, “The Spontaneous Magnetization of a Two-Dimensional Ising Model,” Phys. Rev. 85, 808–816 (1952).
- Mackintosh and Andersen (1980) A. R. Mackintosh and O. K. Andersen, “The electronic structure of transition metals,” in Electrons at the Fermi Surface, edited by M. Springford (Cambridge University Press, Cambridge, 1980) pp. 149–224.
- Heine (1980) V. Heine, “Electronic structure from the point of view of the local atomic environment,” in Solid State Physics, Vol. 35, edited by Henry Ehrenreich, Frederick Seitz, and David Turnbull (Academic Press, New York, 1980) pp. 1–123.
- Kohn and Sham (1965) W. Kohn and L. J. Sham, “Self-consistent equations including exchange and correlation effects,” Phys. Rev. 140, A1133–A1138 (1965).
- Daalderop et al. (1990) G. H. O. Daalderop, P. J. Kelly, and M. F. H. Schuurmans, “First-principles calculation of the magnetocrystalline anisotropy energy of iron, cobalt and nickel,” Phys. Rev. B 41, 11919–11937 (1990).
- Stiles et al. (2001) M. D. Stiles, S. V. Halilov, R. A. Hyman, and A. Zangwill, “Spin-other-orbit interaction and magnetocrystalline anisotropy,” Phys. Rev. B 64, 104430 (2001).
- Daalderop et al. (1994a) G. H. O. Daalderop, P. J. Kelly, and M. F. H. Schuurmans, “Magnetic anisotropy of a free-standing Co monolayer and of multilayers which contain Co monolayers,” Phys. Rev. B 50, 9989–10003 (1994a).
- Daalderop et al. (1994b) G. H. O. Daalderop, P. J. Kelly, and M. F. H. Schuurmans, “Magnetic anisotropy from first principles,” in Ultrathin Magnetic Structures I, edited by J. A. C. Bland and B. Heinrich (Springer-Verlag, Berlin Heidelberg, 1994) pp. 40–64.
- Zhu et al. (2011) Z. Y. Zhu, Y. C. Cheng, and U. Schwingenschlögl, “Giant spin-orbit-induced spin splitting in two-dimensional transition-metal dichalcogenide semiconductors,” Phys. Rev. B 84, 153402 (2011).
- Note (1) The vasp guide, https://cms.mpi.univie.ac.at/vasp/vasp.pdf.
- Daalderop et al. (1992) G. H. O. Daalderop, P. J. Kelly, and F. J. A. den Broeder, “Prediction and confirmation of perpendicular magnetic anisotropy in Co/Ni multilayers,” Phys. Rev. Lett. 68, 682–685 (1992).
- Blöchl et al. (1994) P. E. Blöchl, O. Jepsen, and O. K. Andersen, “Improved tetrahedron method for Brillouin-zone integrations,” Phys. Rev. B 49, 16223–16233 (1994).
- Xu et al. (2018) Cangsong Xu, Junsheng Feng, Hongjun Xiang, and Laurent Bellaiche, “Interplay between Kitaev interaction and single ion anisotropy in ferromagnetic CrI3 and CrGeTe3 monolayers,” npj Computational Materials 4, 57 (2018).
- Leonel et al. (2006) S. A. Leonel, Amanda Castro Oliveira, B. V. Costa, and Pablo Zimmermann Coura, “Comparative study between a two-dimensional anisotropic Heisenberg antiferromagnet with easy-axis single-ion anisotropy and one with easy-axis exchange anisotropy,” J. Magn. Magn. Mater. 305, 157–164 (2006).
- Binder (1981) K. Binder, “Finite size scaling analysis of Ising model block distribution functions,” Z. Phys. B 43, 119–140 (1981).
- Landau and Binder (2009) David P. Landau and Kurt Binder, A Guide to Monte Carlo Simulations in Statistical Physics, 3rd ed. (Cambridge University Press, Cambridge, U.K., 2009).
- Vanderbilt (1990) David Vanderbilt, “Soft self-consistent pseudopotentials in a generalized eigenvalue formalism,” Phys. Rev. B 41, 7892–7895 (1990).
- Troullier and Martins (1991) N. Troullier and José Luriaas Martins, “Efficient pseudopotentials for plane-wave calculations,” Phys. Rev. B 43, 1993–2006 (1991).
- Ceperley and Alder (1980) D. M. Ceperley and B. J. Alder, “Ground state of the electron gas by a stochastic method,” Phys. Rev. Lett. 45, 566–569 (1980).
- Heyd et al. (2003) J. Heyd, G. E. Scuseria, and M. Ernzerhof, “Hybrid functionals based on a screened coulomb potential,” J. Chem. Phys. 118, 8207–8215 (2003).
- Heyd et al. (2006) J. Heyd, G. E. Scuseria, and M. Ernzerhof, “Erratum: Hybrid functionals based on a screened coulomb potential,” J. Chem. Phys. 124, 219906 (2006).
- Giannozzi et al. (2009) P. Giannozzi, S. Baroni, N. Bonini, M. Calandra, R. Car, C. Cavazzoni, D. Ceresoli, G. L. Chiarotti, M. Cococcioni, I. Dabo, A. Dal Corso, S. Fabris, G. Fratesi, S. de Gironcoli, R. Gebauer, U. Gerstmann, C. Gougoussis, A. Kokalj, M. Lazzeri, L. Martin-Samos, N. Marzari, F. Mauri, R. Mazzarello, S. Paolini, A. Pasquarello, L. Paulatto, C. Sbraccia, S. Scandolo, G. Sclauzero, A. P. Seitsonen, A. Smogunov, P. Umari, and R. M. Wentzcovitch, “quantum espresso: a modular and open-source software project for quantum simulations of materials,” J. Phys.: Condens. Matter 21, 395502 (2009).
- Blaha et al. (2002) P. Blaha, K. Schwarz, and G. K. H. Madsen, “Electronic structure calculations of solids using the WIEN2k package for material sciences,” Comput. Phys. Commun. 147, 71–76 (2002).
- Soler et al. (2002) José M. Soler, Emilio Artacho, Julian D. Gale, Alberto García, Javier Junquera, Pablo Ordejón, and Daniel Sánchez-Portal, “The siesta method for ab initio order-n materials simulation,” J. Phys.: Condens. Matter 14, 2745–2779 (2002).
- Choi (2018) M. Choi, “Strain-enhanced doping in monolayer MoS2,” Phys. Rev. Appl. 9, 024009 (2018).
- (102) Seok Joon Yun, Dinh Loc Duong, Manh-Ha Doan, Kirandeep Singh, Thanh Luan Phan, Wooseon Choi, Young-Min Kim, and Young Hee Lee, “Room-temperature ferromagnetism in monolayer WSe2 semiconductor via vanadium dopant,” arXiv:1806.06479 .
- Guguchia et al. (2018) Z. Guguchia, A. Kerelsky, D. Edelberg, S. Banerjee, F. von Rohr, D. Scullion, M. Augustin, M. Scully, D. A. Rhodes, Z. Shermadini, H. Luetkens, A. Shengelaya, C. Baines, E. Morenzoni, A. Amato, J. C. Hone, R. Khasanov, S. J. L. Billinge, E. Santos, A. N. Pasupathy, and Y. J. Uemura, “Magnetism in semiconducting molybdenum dichalcogenides,” Science Advances 4, eeat3672 (2018).
- Coelho et al. (2019) Paula Mariel Coelho, Hannu-Pekka Komsa, Kinga Lasek, Vijaysankar Kalappattil, Jeyakumar Karthikeyan, Manh-Huong Phan, Arkady V. Krasheninnikov, and Matthias Batzill, “Room-temperature ferromagnetism in MoTe2 by post-growth incorporation of vanadium impurities,” Advanced Electronic Materials 5, 1900044 (2019).
- Yang et al. (2019) Li Yang, Hao Wu, Wenfeng Zhang, Xun Lou, Zijian Xie, Xu Yu, Yuan Liu, and Haixin Chang, “Ta Doping Enhanced Room-Temperature Ferromagnetism in 2D Semiconducting MoTe2 Nanosheets,” Advanced Electronic Materials , 1900552 (2019).
- Hu et al. (2019) M. L. Hu, Zhizhou Yu, K. W. Zhang, L. Z. Sun, and J. X. Zhong, “Synergetic Effect of Substitutional Dopants and Sulfur Vacancy in Modulating the Ferromagnetism of MoS2 Nanosheets,” ACS Applied Materials & Interfaces 11, 31155–31161 (2019).
- Ma et al. (2012) Yandong Ma, Ying Dai, Meng Guo, Chengwang Niu, Yingtao Zhu, and Baibiao Huang, “Evidence of the existence of magnetism in pristine VX2 monolayers (X = S, Se) and their strain-induced tunable magnetic properties,” ACS Nano 6, 1695–1701 (2012).
- Ataca et al. (2012) C. Ataca, H. Şahin, and S. Ciraci, “Stable, Single-Layer MX2 Transition-Metal Oxides and Dichalcogenides in a Honeycomb-Like Structure,” J. Phys. Chem. C 116, 8983–8999 (2012).
- Zhang et al. (2013) Hui Zhang, Li-Min Liu, and Woon-Ming Lau, “Dimension-dependent phase transition and magnetic properties of VS2,” Journal of Materials Chemistry A 1, 10821–10828 (2013).
- Gan et al. (2013) Li-Yong Gan, Qingyun Zhang, Yingchun Cheng, and U. Schwingenschlögl, “Two-dimensional ferromagnet/semiconductor transition metal dichalcogenide contacts: -type Schottky barrier and spin-injection control,” Phys. Rev. B 88, 235310 (2013).
- Kan et al. (2015) Min Kan, Bo Wang, Young Hee Lee, and Qiang Sun, “A density functional theory study of the tunable structure, magnetism and metal–insulator phase transition in VS2 monolayers induced by in-plane biaxial strain,” Nano Research 8, 1348–1356 (2015).
- Wasey et al. (2015) A. H. M. Abdul Wasey, Soubhik Chakrabarty, and G. P. Das, “Quantum size effects in layered VX2 (X=S, Se) materials: Manifestation of metal to semimetal or semiconductor transition,” J. Appl. Phys. 117, 064313 (2015).
- Zhuang and Hennig (2016) Houlong L. Zhuang and Richard G. Hennig, “Stability and magnetism of strongly correlated single-layer VS2,” Phys. Rev. B 93, 054429 (2016).