Superconductivity at the Pressure-Induced Ferromagnetic Critical Region in UCoGe
Abstract
The phase separation of the ferromagnetic (FM) and paramagnetic (PM) phases in the superconducting (SC) state of UCoGe at the FM critical region was investigated using 59Co nuclear quadrupole resonance (NQR) technique by taking advantage of its site-selective feature. The NQR measurements revealed that the first-order quantum phase transition occurs between the FM and the PM states. The nuclear spin-lattice relaxation rate exhibited a clear drop at the SC state in the PM phase, whereas it was not detected in the FM phase, which indicates that the superconductivity in the FM phase becomes weaker at the FM critical region due to the presence of the PM SC state. This result suggests that the SC condensation energy of the PM SC state is equal or larger than that of the FM SC state in this region. The pressure–temperature phase diagram of UCoGe was modified by taking the results from this study into account.
Uranium (U)-based ferromagnetic (FM) superconductors have attracted much attention since the discovery of superconductivity in UGe2 under pressure [1] and ambient-pressure superconductivity in URhGe [2] and UCoGe [3]. The spin-triplet superconductivity is expected in these systems and is attributed to FM spin fluctuations. The pairing glue is tuned by the external magnetic field; therefore, the superconducting (SC) phases of these compounds exhibit anomalous field–temperature phase diagrams including re-entrant superconductivity [4, 5, 6]. These U-based superconductors are the key materials for understanding the FM quantum criticality. The FM phase is tuned by the application of pressure and magnetic field. The SC phase exists only inside the FM phase in UGe2 [1], whereas it remains in the paramagnetic (PM) state in UCoGe [7, 8, 9]. The pressure phase diagram of UCoGe is similar to that of the materials exhibiting superconductivity near a quantum critical point. Some studies reveal that a tricritical point in the field–temperature diagram of URhGe plays an important role for the re-entrant superconductivity [10, 11]. The spin fluctuations in URhGe differ from the simple Ising-type ones as observed in UCoGe[12, 13] and UGe2 [14].
Recently, we reported an enhancement of the FM fluctuations in UCoGe caused by the suppression of the FM phase by the pressure, as revealed by the 59Co nuclear quadrupole resonance (NQR) measurement[15]. The strong fluctuations persist above the critical pressure, and they are related to the superconductivity in the PM state. This result supports the scenario that the FM fluctuations mediate the superconductivity in UCoGe[13, 16]. At the intermediate pressure, the phase separation of the FM and PM phases was observed even in the SC state. This result is indicative of a weak first-order FM transition, as expected from the theory of the itinerant ferromagnetism [17]. In the FM SC state of UCoGe at ambient pressure, the FM transition was observed in the entire sample volume, whereas the SC state was found to be inhomogeneous, as revealed by the two-component nuclear spin-lattice relaxation rate [18]. Such a behavior suggests the presence of the self-induced vortex state and the normal state at the grain boundary. On the contrary, a recent study indicates that the SC state in UCoGe is homogeneous when the FM phase is completely suppressed at the pressure of 0.67 GPa [15]. It is interesting to observe the emergence of superconductivity at the intermediate pressure values, where the FM and PM states coexist separately in the sample. Hence, it is important to determine the precise pressure phase diagram, namely, the FM transition line inside the SC state. In this paper, we focus our study on the 59Co NQR measurements of UCoGe in the critical pressure region and discuss the relationship between the two SC states occurring in the FM state and the PM state.
A single-crystalline UCoGe sample was used in this study. The details of the sample properties and the measurement setup have been previously reported elsewhere [15, 19]. Hydrostatic pressure was applied using a piston-cylinder-type cell with Daphne oil 7373 as a pressure medium. The applied pressure was 0.3 GPa, as determined by the SC transition temperature of Pb. The phase separation of the FM and PM phases persists in the SC state at this pressure. The FM and the SC transition temperatures of UCoGe at this pressure were K and K, respectively. was determined from the 59Co NQR measurements, and was obtained from the ac susceptibility measurement (Fig. 1) from an circuit using an NQR coil. A 3He-4He dilution refrigerator was used for cooling the pressure cell down to 0.15 K. The 59Co NQR () measurement was performed at zero external field. The rf pulse field was applied parallel to the axis. obtained from the 59Co NQR measurements detects the FM fluctuations along the axis because the nuclear quantization axis is close to the axis [12] and detects the magnetic fluctuations perpendicular to the quantized axis. Hence, this quantity enables us to study the temperature and pressure dependence of the FM fluctuations in details. Since the resonant frequency depends on the internal magnetic field, can be separately measured at the FM and the PM sites when the phase separation occurs. The values measured in UGe2 indicate that the SC transition occurs only in the FM state[20], which is an advantageous feature of the NQR method.
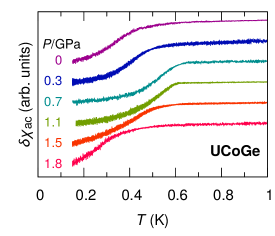
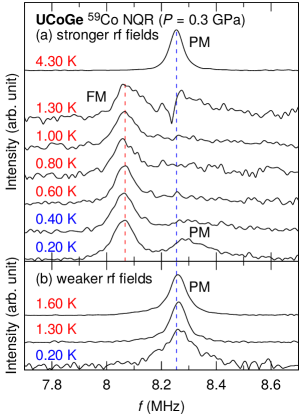
Figure 2 shows the temperature dependence of the 59Co NQR spectra around 8 MHz arising from the transitions at 0.3 GPa. The quadrupole parameters were determined as MHz and , which are slightly shifted compared with the ambient-pressure values of MHz and [18] owing to the shrinkage of the lattice under pressure. At lower temperatures, the spectral shape depended on the intensity of the applied NQR rf pulse field, and a stronger rf field was preferred for observing the FM signal, as shown in Fig. 2(a). This result clearly shows the phase separation of the FM and PM phases down to 0.20 K, as observed in our previous NQR study [15]. We confirmed that the SC anomaly is seen in the NQR spectra even with the stronger rf pulse field, as mentioned below; therefore, the effect of the rf heating is rather small. Although the measurement of the FM signal above 1.30 K was not possible owing to the weak NQR signal intensity, was estimated to be below 1.60 K at 0.3 GPa using values. The frequency of the FM signal did not shift with a change in the temperature, indicating that the internal magnetic field is almost temperature-independent below . Such a behavior was also observed at the ambient pressure[18], which is a characteristic of the first-order phase transition. The PM signal was not clearly visible in the temperature range of 0.6–1.0 K; however, it was again observed in the SC state (0.20 and 0.40 K). There are two possibilities of this recovery of the PM signal intensity in the SC state. One is the change in the power of the rf pulse field in the SC state as the PM signal is more distinct with the weaker rf pulse fields [Fig. 2(b)]. The rf power becomes weaker inside the sample below due to the SC diamagnetic shielding effect; hence, the PM signal becomes stronger in the SC state. Another possibility may be associated with the intrinsic effects due to an increase in the volume fraction of the PM state upon entering the SC state, which has larger thermodynamic stability compared with the FM SC state. We discuss the latter possibility in this article.
With the weaker rf pulse fields (typically with times of the intensity of the stronger ones), the FM signal was not observed, and the PM signal was dominant, as shown in Fig. 2(b). The signal intensity multiplied by temperature () at 0.20 K decreased to 6% compared with the value at 1.30 K, and a significant broadening of the spectrum was observed. is expected to be temperature-independent, if there are no phase transitions nor magnetic fluctuations present; therefore, the observed behavior is consistent with the presence of the strong FM fluctuations and the FM state. The rf-field dependence of the NQR spectra indicates that the optimal rf power differs at the PM and FM sites. Typically, a weaker NQR rf field is preferable when the system is close to the FM transition; hence, the rf-field dependence may arise from the different FM fluctuations in the FM and PM signals. The origin of such behavior is confirmed by the measurements, as shown in Fig. 3. of the FM and the PM phases were also measured with different power of the rf pulse fields. It is worth noting that the actual fraction of the PM and the FM phases cannot be determined from the NQR results.
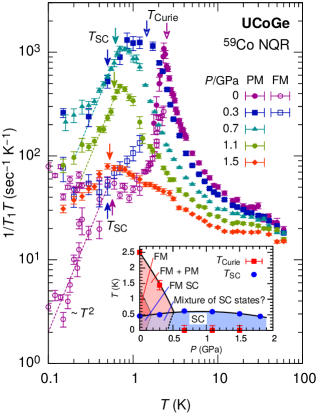
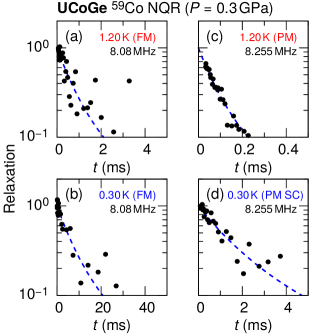
Figure 3 shows the temperature dependence of obtained by the 59Co NQR measurement divided by temperature at different pressures. The inset of Fig. 3 shows the pressure–temperature phase diagram of the UCoGe sample. was determined from the nuclear relaxation curve obtained by the NQR intensity at a time after applying an rf pulse field. Some relaxation curves at 0.3 GPa are shown in Fig. 4. The results of at 0.3 GPa below 4.2 K and 1.50 GPa were obtained in the present study, and the other data displayed in Fig. 3 are adapted from our previous studies[18, 15]. At ambient pressure, exhibited a peak at and turned to decrease below . This peak temperature shifted to lower as the pressure increases, and it is attributed to the suppression of the FM state. The peak at 0.3 GPa is broader compared with that at other pressure values, and the value of of the PM site decreased below at 0.3 GPa. The value of at is larger than that at the ambient pressure. The value of increased at 0.7 and 1.1 GPa compared with the ambient-pressure value, and a significant increase was also observed in at in these pressures. The FM transition was not detected at 0.7 GPa and above. At 1.5 GPa, decreases, and the value of at was also suppressed. These results are in good agreement with the scenario that the FM fluctuations are closely related to the enhancement of the superconductivity in UCoGe.
below of the FM and PM signals were measured at 0 and 0.3 GPa. At 0 GPa, values of the PM and FM signals were close to each other, whereas the at the PM site was nearly an order of magnitude faster than that at the FM state at 0.3 GPa. The PM site had a strong FM fluctuations even below , and it started to decrease at approximately 0.8 K at 0.3 GPa, which is lower than K and higher than K. The of the FM site exhibited rather conventional behavior below at 0.3 GPa.
At the FM site in the SC state at 0 GPa, two components were observed in the nuclear relaxation curves[18]. The longer component arises from the SC portion owing to the opening of the gap with a line-node-like structure (), whereas the shorter component exhibited a normal-metal-like behavior ( is constant). This inhomogeneous is ascribed to the coexistence of the FM and SC states [18]. On the other hand, the behavior of at 0.3 GPa in the SC state differs from that at 0 GPa. A clear SC anomaly was observed in the PM signal and was determined with a single component, which is indicative of the homogeneous SC state, as shown in Fig. 4(d). The temperature dependence of at 0.3 GPa in the SC state exhibited a residual density of states (DOS) behavior. The behavior observed for the PM signal in this study is similar to that of the higher-pressure PM state without the FM state[15]. On the contrary, a clear SC anomaly was not detected at the FM site even at , and the nuclear relaxation curves could be fitted with a single component. The longer component (ascribed to the SC state) was not observed at this pressure, as shown in Fig. 4(b). The exhibited a normal-metal-like behavior down to 0.15 K at the FM site, and this behavior is similar to the fast component in the FM SC state at 0 GPa. There is a possibility that a small fraction of the SC component exists in the FM state at 0.3 GPa; however, the fraction of superconductivity in the FM state is smaller at 0.3 GPa than at 0 GPa.
The result of the measurement in the SC state at the PM signal at 0.3 GPa suggests that the PM SC state is homogeneous. This result implies that the phase separation between the FM SC and PM SC states does not affect the PM SC phase. The small SC fraction (if any) in the FM state may be associated with the transition of a portion of the FM SC phase into the PM SC state at . The coexistence of the FM and SC states may cost an additional energy owing to the Meissner effect, and the fraction of the FM state may decrease below . The reinforcement of the PM signal intensity in the SC state in Fig. 2(a) can be interpreted as a result of this re-distribution of the PM and FM states, although the change in the FM fluctuations is also important for discussion of the intensity of the NQR spectra. If the re-distribution occurs, the FM transition line inside the SC state (the dashed line in the inset of Fig. 3) is expected to have a positive slope, which is in agreement with the theoretical prediction[21]. Hence, precise measurements are required to determine the volume fraction of each phase and this phase transition line. Furthermore, it is necessary to verify the mechanism responsible for the reduction of the fraction of the SC state inside the FM state.
Interestingly, of the PM SC state is faster than that of the “broken” normal state at the FM site at 0.3 GPa. Based on the scenario that the FM fluctuations are the pairing glue for the Cooper pairs in UCoGe, this difference in may lead to different values of the PM and FM phases in the phase separation region. This scenario also leads to the re-distribution of the FM and the PM states below of the PM state owing to the different SC condensation energies. To increase the condensation energy, some portion of the FM phase transitions into the PM SC phase below , which results in the lower of the remaining FM state. Although the smooth values across the FM transition line have been reported in the previous studies [7, 8, 9], a small jump of may exist owing to the weak first-order FM transition.
Another interesting phenomenon observed in the NQR in UCoGe is the reduction of the value at the PM site below . Naively, the values at the PM site are expected to increase monotonically as the temperature decreases because the local at the PM site is always lower than the measurement temperature, and the FM fluctuations are stronger as the temperature is close to . The reduction of is clearly observed at 0 GPa and is rather ambiguous at 0.3 GPa (Fig. 3). When the FM transition occurs, a phase separation also occurs between the PM and the FM states. Our results indicate that the PM site may be affected by the FM site, in contrast to the behavior below . It is a future task to resolve the origin of this unusual behavior.
In conclusion, we performed 59Co NQR measurements on a single-crystalline UCoGe under 0.3 GPa to investigate the SC state in the phase-separation region of the FM and PM phases from the microscopic point of view. The intensity of the NQR spectra of the PM site increased in the SC state compared with the FM signal. This phenomenon can be interpreted as a result of the re-distribution of the PM and the FM states in the SC state, and is consistent with a positive slope of the FM transition line inside the SC state in the pressure–temperature phase diagram. of the PM signal was homogeneous in the SC state and exhibited a clear drop owing to the opening of the SC gap at 0.3 GPa. On the contrary, of the FM site did not exhibit a clear SC anomaly below . This suggests that the SC state in the FM phase is weaker than that in the PM phase owing to the Meissner effect in the FM state.
The authors would like to thank H. Kotegawa, H. Tou, Y. Tokunaga, T. Hattori, D. Aoki, Y. Maeno, S. Yonezawa, A. Daido, Y. Yanase, J.-P. Brison, D. Braithwaite, A. Pourret, C. Berthier, A. de Visser, J. Flouquet, and V. P. Mineev for their valuable discussions. One of the authors (MM) is a Research Fellow of Japan Society for the Promotion of Science (JSPS). This work was supported by the Kyoto University LTM Center, Grants-in-Aid for Scientific Research (No. JP15H05745 and No. JP17K14339), Grants-in-Aid for Scientific Research on Innovative Areas “J-Physics” (No. JP15H05882, No. JP15H05884, and No. JP15K21732), and Grants-in-Aid for JSPS Research Fellows (No. JP17J05509 and No. JP19J00336) from JSPS.
References
- [1] S. S. Saxena, P. Agarwal, K. Ahilan, F. M. Grosche, R. K. W. Haselwimmer, M. J. Steiner, E. Pugh, I. R. Walker, S. R. Julian, P. Monthoux, G. G. Lonzarich, A. Huxley, I. Sheikin, D. Braithwaite, and J. Flouquet: Nature (London) 406 (2000) 587.
- [2] D. Aoki, A. Huxley, E. Ressouche, D. Braithwaite, J. Flouquet, J.-P. Brison, E. Lhotel, and C. Paulsen: Nature (London) 413 (2001) 613.
- [3] N. T. Huy, A. Gasparini, D. E. de Nijs, Y. Huang, J. C. P. Klaasse, T. Gortenmulder, A. de Visser, A. Hamann, T. Görlach, and H. v. Löhneysen: Phys. Rev. Lett. 99 (2007) 067006.
- [4] I. Sheikin, A. Huxley, D. Braithwaite, J. P. Brison, S. Watanabe, K. Miyake, and J. Flouquet: Phys. Rev. B 64 (2001) 220503.
- [5] F. Lévy, I. Sheikin, B. Grenier, and A. D. Huxley: Science 309 (2005) 1343.
- [6] D. Aoki, T. D. Matsuda, V. Taufour, E. Hassinger, G. Knebel, and J. Flouquet: J. Phys. Soc. Jpn. 78 (2009) 113709.
- [7] E. Hassinger, D. Aoki, G. Knebel, and J. Flouquet: J. Phys. Soc. Jpn. 77 (2008) 073703.
- [8] E. Slooten, T. Naka, A. Gasparini, Y. K. Huang, and A. de Visser: Phys. Rev. Lett. 103 (2009) 097003.
- [9] G. Bastien, D. Braithwaite, D. Aoki, G. Knebel, and J. Flouquet: Phys. Rev. B 94 (2016) 125110.
- [10] Y. Tokunaga, D. Aoki, H. Mayaffre, S. Krämer, M.-H. Julien, C. Berthier, M. Horvatić, H. Sakai, S. Kambe, and S. Araki: Phys. Rev. Lett. 114 (2015) 216401.
- [11] Y. Tokunaga, D. Aoki, H. Mayaffre, S. Krämer, M.-H. Julien, C. Berthier, M. Horvatić, H. Sakai, T. Hattori, S. Kambe, and S. Araki: Phys. Rev. B 93 (2016) 201112.
- [12] Y. Ihara, T. Hattori, K. Ishida, Y. Nakai, E. Osaki, K. Deguchi, N. K. Sato, and I. Satoh: Phys. Rev. Lett. 105 (2010) 206403.
- [13] T. Hattori, Y. Ihara, Y. Nakai, K. Ishida, Y. Tada, S. Fujimoto, N. Kawakami, E. Osaki, K. Deguchi, N. K. Sato, and I. Satoh: Phys. Rev. Lett. 108 (2012) 066403.
- [14] Y. Noma, H. Kotegawa, T. Kubo, H. Tou, H. Harima, Y. Haga, E. Yamamoto, Y. Ōnuki, K. M. Itoh, E. E. Haller, A. Nakamura, Y. Homma, F. Honda, and D. Aoki: J. Phys. Soc. Jpn. 87 (2018) 033704.
- [15] M. Manago, S. Kitagawa, K. Ishida, K. Deguchi, N. K. Sato, and T. Yamamura: Phys. Rev. B 99 (2019) 020506.
- [16] B. Wu, G. Bastien, M. Taupin, C. Paulsen, L. Howald, D. Aoki, and J.-P. Brison: Nat. Commun. 8 (2017) 14480.
- [17] M. Brando, D. Belitz, F. M. Grosche, and T. R. Kirkpatrick: Rev. Mod. Phys. 88 (2016) 025006.
- [18] T. Ohta, T. Hattori, K. Ishida, Y. Nakai, E. Osaki, K. Deguchi, N. K. Sato, and I. Satoh: J. Phys. Soc. Jpn. 79 (2010) 023707.
- [19] M. Manago, S. Kitagawa, K. Ishida, K. Deguchi, N. K. Sato, and T. Yamamura: Phys. Rev. B 100 (2019) 035203.
- [20] A. Harada, S. Kawasaki, H. Kotegawa, Y. Kitaoka, Y. Haga, E. Yamamoto, Y. Ōnuki, K. M. Itoh, E. E. Haller, and H. Harima: J. Phys. Soc. Jpn. 74 (2005) 2675.
- [21] H. Kusunose and Y. Kimoto: J. Phys. Soc. Jpn. 82 (2013) 094711.