Probing primordial 3He from hyperfine line afterglows around supercritical black holes
Abstract
We consider the possibility of the detection of 3HeII hyperfine line (rest frequency, ) emission from ionized zones around accreting black holes (BHs) formed at high redshifts, . We show that the brightness temperature in 8.67GHz line increases and reaches a peak value after the accretion onto the BH exhausts and HeIII recombines into HeII. This period of brightening last up to 40 million years. We find that during this period the maximum brightness temperature reaches K, depending on the epoch when such a black hole starts growing. The maximum angular size of the region emitting in the hyperfine line is around . The flux from such a region () is too small to be detected by SKA1-MID. The RMS of the collective flux from many emitting regions from a volume bounded by the synthesized beam and the band-width of SKA1-MID might reach 100 nJy, which is potentially detectable by SKA1-MID.
keywords:
cosmology: theory — early universe — line: formation — radio lines: general1 Introduction
The primordial Nucleosynthesis (BBN) is one of the pillars of the hot big bang model. While the initial success of this proposal was based on the formation of 4He, the detection of these elements in their primordial settings continues to be a challenge, which is particularly severe for the small amounts of trace elements—2D, 3He and 7Li—produced during the BBN.
The detection of line absorption in the spectra of distant quasars has long been recognized to be a powerful tool for probing the chemical evolution of the universe across the Hubble time (see review in Prochaska, 2017). In this series the direct observation of deuterium Ly-series line absorption from redshifts plays an exceptionally important role as a unique probe of the Big-Bang nucleosynthesis (BBN – see for recent discussion in Balashev et al. , 2016; Cooke et al. , 2018; Zavarygin et al. , 2018). Such observations though are biased towards damped Ly- absorption systems (DLA) with matter partly processed by stellar nucleosynthesis, and hence the necessity to reach deeply pristine conditions urge search of rare DLA systems in the lowest end of metallicities like reported by Cooke et al. (2018) with [O/H]=-2.769. Among other complications, the rareness of such systems can make conclusions elusive (e.g. Cyburt et al. , 2016; Draine, 2006). The primordial abundance of 7Li and 4He has also not been determined unambiguously (Fields, 2011; Izotov et al. , 2014; Aver et al. , 2015; Cooke, 2015).
The focus of the current paper is 3He, with BBN abundance of nearly . One possible approach to measure the primordial abundance of 3He is through the simultaneous measurement of deuterium abundance and the isotope ratio 3He/4He from metal-poor HII regions. This would require using future optical and near-infrared observational facilities of 30m class telescopes (Cooke, 2015). An alternative option to measure the BBN abundance of 3He is to detect the absorption owing to the hyperfine 3HeII line (Townes, 1957; Sunyaev, 1966; Goldwire & Goss, 1967; Rood et al. , 1979) in the quasar spectra at (McQuinn & Switzer, 2009). The 3HeII hyperfine line has been detected from local HII regions and planetary nebulae using both single-dish radio telescopes (e.g. GBT) and radio interferometers (e.g. VLA) (e.g. Balser & Bania, 2018; Bania et al., 2010; Balser et al., 2006).
More recently Takeuchi et al. (2014) studied the possibility of detecting the hyperfine line in emission from the intergalactic low-overdensity gas exposed to the cumulative ionizing background at (see also Bell, 2000; Bagla & Loeb, 2009). In this paper, we study the emission of this line from ionized regions surrounding growing black holes in the redshift range and investigate its detectebility using the upcoming radio interferometer SKA1-MID.
Throughout this paper, we assume the spatially-flat CDM model with the following parameters: , , and , with the overall normalization corresponding to (Planck Collaboration, et al. , 2016). The helium abundance is .
2 THE GROWTH OF BH
A black hole (BH) is assumed to grow with the Bondi-Hoyle rate (Bondi & Hoyle, 1944; Bondi, 1952; Shima et al. , 1985):
| (1) |
where is the density of the gas at the center of the gaseous disks in host halos. 111 The “host halo” refers to a virialized object with the overdensity with respect to the background density at that redshift, with baryon-to-dark matter ratio (Barkana & Loeb, 2001). The bolometric luminosity equals
| (2) |
where is assumed as usual; it corresponds to the case of radiation from a thin disk around the BH (Shakura & Sunyaev, 1973). Note that the radiative efficiency may vary during the accretion history in different models, which mimic the effect of photon trapping. Depending on ambient gas parameters and the BH mass its luminosity may vary from slightly subcritical to highly supercritical
| (3) |
and can reach up to hundreds of (see e.g. Inayoshi et al. , 2016; Sakurai, Inayoshi & Haiman, 2016).
3 The 3HeII hyperfine transition
The 3HeII hyperfine transition () is excited by collisions with atoms and electrons and photon scattering (Field, 1958; Wouthuysen, 1952)
| (4) |
where is the collisional coupling efficiency of the two states of hyperfine splitting, is the rate of spin exchange between 3HeII and electrons (McQuinn & Switzer, 2009), , the rate of spontaneous decay of the hyperfine state, is the energy of the hyperfine splitting; denotes the efficiency of Wouthuysen-Field coupling by photons of wavelength, , corresponding to the Lyman- transition energy for singly ionized helium (Eq. 17 in Takeuchi et al. , 2014), is the Bohr radius. In this paper, the number density of these photons at the point of scattering is computed from the spectrum of BH emission (for more details see in Vasiliev et al. , 2018b).
The differential brightness temperature of 3HeII line can be estimated as follows:
| (5) |
where is the primordial abundance of the helium-3 isotope, is the fraction of singly ionized helium-4 isotope; as the chemical properties of both the isotopes are nearly the same222They differ only owing to the slightly different reduced masses of the atoms formed with these nuclei., is also the fraction of singly ionized helium-3.
4 The ionized IGM around BH
The accretion onto a BH is expected to be a source of UV/X-ray photons. The spectrum of the ionizing radiation emitted during the accretion is assumed a power-law , where , which is taken as a fiducial value here. This ionizing radiation is attenuated inside the halo by average total column density of HI, , in the host galaxy. After escaping the halo the radiation can ionize the intergalactic medium. We neglect the complications of the transition layer between minihalo and surrounding gas and match the minihalo directly to the expanding IGM. We assume this gas to have homogeneous distribution of density and temperature decreasing due to cosmological expansion: and , until the ionizing radiation from a BH changes its thermodynamics. We consider the evolution of gas enclosed in the concentric static spheres with a BH in the center. In each sphere we solve thermal and ionization evolution of hydrogen, neutral helium and singly ionized helium. We consider all major processes for primordial plasma (Cen, 1992). We include the influence of secondary electrons as described in (Shull & van Steenberg, 1985; Ricotti et al. , 2002). In the equation of the thermal evolution of IGM we include the cooling term due to the Hubble expansion, in order to correctly describe the evolution on time scales greater than the local age of the universe. The initial gas temperature and HII fraction for a given redshift are obtained by using the RECFAST code (Seager et al. , 2000), while helium in the initial state is assumed to be neutral. The detailed description of our model can be found in (Vasiliev et al. , 2018b).
Based on that we consider BH hosted in halos at redshifts with the BH seeds being the final product of the evolution of Population III stars with (see e.g., Woosley et al. , 2002), is adopted as a fiducial value for a BH seed.
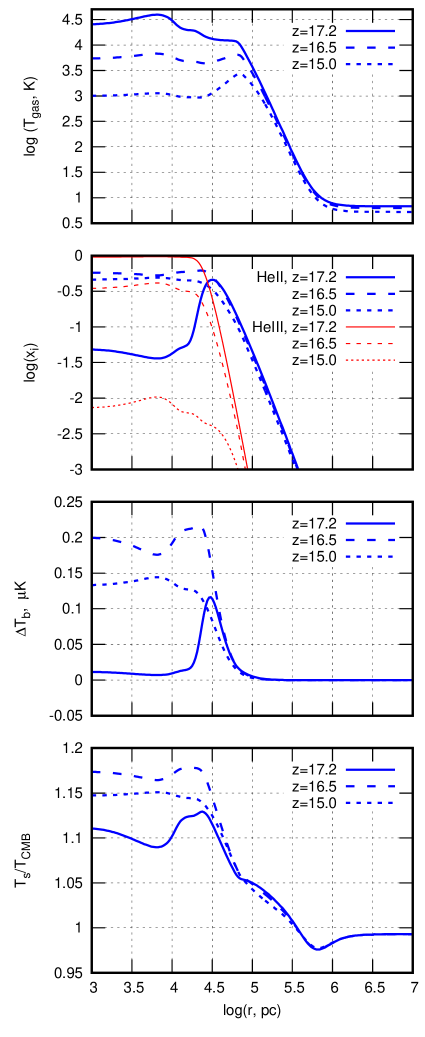
In order to illustrate the results we show several models with a black hole of initial mass which starts growing at and increases its mass by a factor of 1000 until . Figure 1 presents the radial profiles of the kinetic temperature, HeII and HeIII fractions, 3HeII brightness temperature around such a growing BH for several redshifts: (solid, dashed and dotted lines, respectively). The BH grows through a single accretion episode completed at . The disk around BH has number density cm-3 and temperature K (see Eq. 1). At the end of the accretion episode, , the IGM around BH is heated up to K within a sphere of radius kpc (the upper panel of Figure 1). The IGM is exposed to the far-UV/X-ray ionizing radiation emitted by accreted gas and almost all the helium is in the doubly ionized state, HeIII, up to distances kpc (red solid line in middle panel). At larger distances, kpc, there is a spherical layer, in which the singly ionized helium, HeII, reaches a relatively high fraction (, see blue solid line in middle panel). This layer emits in the 3HeII hyperfine structure line: the brightness temperature reaches 0.1 K (see solid line in lower panel). The brightness temperature of the 3HeII line in the inner part of the ionized sphere is less than 0.01 K. The lowest panel displays the ratio of which shows that the maximum value of this ratio is around 1.15. It should be noted that when the gas cools the hyperfine spin temperature increases because the collisional coupling, , gets stronger. Therefore, as soon as the cooling time of the ionized gas s is shorter than the Hubble time s, which occurs immediately after the completion of the accretion phase, we notice an increase in the hyperfine spin temperature . The collisional coupling scales with , the redshift corresponding to the exhaustion of accretion on to growing massive BH, as . As a consequence, the resulting brightness temperature is higher for larger .
It follows from Eq. (4) that when either or , which denote Lyman- or collisional couplings, the spin temperature would approach the matter temperature which is generally much larger than in the regions that emit in the hyperfine line. The collisional coupling depends on the number density of electrons in the IGM which is not high enough to drive to a value above unity. The Lyman- depends on the number density of photons in the IGM. In our study, we consider the BH to be the source of these photons. Most of these photons are strongly absorbed in the halo of HI column density surrounding the BH, which diminishes their number in the IGM. As is a parameter in our model, we studied many cases where it is smaller. For , a much larger number of these photons escape into the IGM, greatly increasing . However, this scenario also results in the escape of photons which can ionize the singly ionized helium, which diminished the hyperfine line signal. We find the net impact of changing to be negligible on the observable signal. In sum: neither the collisional nor the Lyman- coupling are very efficient in coupling the spin temperature to matter temperature which results in a decrement in the observed brightness temperature (Eq. (5)).
After the accretion onto BH has been switched off, the doubly ionized helium begins to recombine (see dashed lines in middle panel), and the brightness temperature of 3HeII line grows: it reaches around 0.2 K and has an almost flat distribution within kpc. At lower redshifts, the gas temperature decreases and the brightness temperature of 3HeII also drops, but it remains higher than that during the accretion phase (dotted line in lower panel). The duration of this luminous ’afterglow’ phase is Myr (). It is comparable to the accretion period (). This 40 Myr period is indicative of the recombination time of HeIII. This period ends when the recombination of HeII becomes important, resulting in a drop in the brightness temperature of the hyperfine line.
It is worth noting that the physical size of the brightest part of the luminous sphere in the IGM slowly diminishes with the velocity
| (6) |
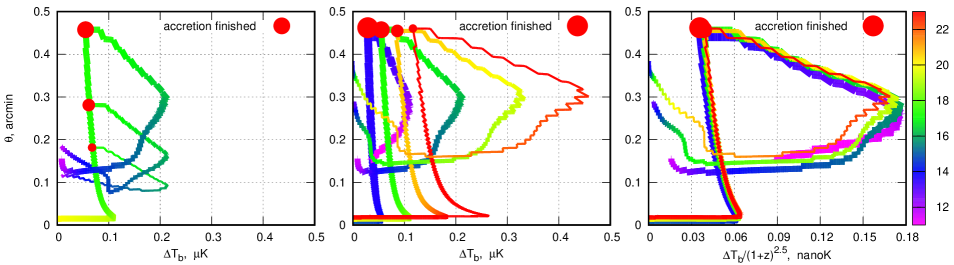
where subscript ‘i’ stands for ‘ionized’, is characteristic temperature in the ionized region, the derivative is taken at the edge of the ionization zone. In Fig. 1 pc and is the recombination time of HeIII at . For temperature at the “edge” approximated as one has . At the end of HeIII recombination when the brightness temperature peaks, the initial size of the ionization region decreases by a factor , where is the photon luminosity with photons energy eV, is the recombination coefficient of HeII (HeIII) ions, the number density of electrons, and the subscript ‘0’ corresponds to the end of the accretion period. It follows then that independent of the initial size of the ionized bubble, after completing the accretion episode, the region decreases by the same factor at the end of HeIII recombination phase(as readily seen in Fig. 2). An important point is that if the BH’s mass grows by a factor the region is proportionally larger, whereas the brightness temperature reaches comparable values.
Then, it appears to be useful to understand how 3HeII brightness temperature relates to size of emitting sphere. Strictly speaking, we should compare the maximum of and the size of the sphere at which the value reaches maximum. However, because of the non-monotonic radial profiles (see e.g. dotted line in the lower panel of Figure 1) we may underestimate the size of the sphere: for the profile at the maximum is 8 kpc, whereas the profile is almost flat up to 20 kpc. So we use in the figure and find the outer radius at which the value of is reached.
Figure 2 presents the evolutionary tracks for 3HeII brightness temperature and angular size of the emitting sphere, . The small saw-tooth fluctuations seen in the figure are owing to the spatial resolution which is determined by the number of concentric shells in our calculation. The disk around BH has number density cm-3 and temperature K (see eq. 1). The evolution starts at the bottom left corner of the figure. A sharp increase of the brightness temperature is caused by HeII ionization during the formation of ionized bubble in the IGM around the growing BH. In the inner part of the bubble the helium is ionized to HeIII, causing the to fall. This value reaches a maximum close to the outer radius of the HeII ionized sphere (Figure 1). The ionization zone continues to expand and the angular size of HeII zone increases. When the accretion is completed (this moment is marked by the red point in Figure 2), the helium ionization stops, and the luminous sphere in the 3HeII line is stalled at its maximum size. At this time, the doubly ionized helium starts to recombine. Due to the decrease of gas temperature and growth of HeII fraction the brightness temperature begins to increase, which leads an afterglow emission of the IGM in the 3HeII hyperfine line. But as the gas cools further, the brightness temperature falls again because HeII begins to recombine.
The duration of this phase is determined by HeIII/HeII recombination kinetics and appears to be several tens of Myrs. It is close to the accretion time for values of and adopted here. In the case of more rapid accretion rate the luminous phase becomes longer than accretion time. Moreover, the increase of accretion rate, for instance, due to the increase of from to cm-3, leads to higher : it rises from 0.2 to 0.25 K. In this case the accretion episode completes earlier, , while the 3HeII afteglow lasts longer than the accretion time. The angular size of the luminous sphere is the same. On the contrary, a decrease in the accretion rate, e.g. for cm-3, produces a lower signal of around 0.15 K.
The BHs that start growing at higher redshifts produce a stronger signal because of higher background density. For example, the maximum signal for a BH that started its growth at is about a factor 2 higher than that for a BH starting at (see Figure 2, right panel). One can see that this maximum is reached at a higher redshift: for as compared to for .
After the accretion on to a BH turns off helium begins to recombine not only in the intergalactic medium, but also inside the host halo, where the gas can be highly ionized. We note that the and within a radius of nearly 300 pc during this phase and this region contains a substantial fraction of the halo’s mass. As the gas density in the halo is nearly two orders of magnitude higher than the background density (the ’top-hat’ model), collisional coupling is efficient inside the halo ( in Eq. (4)) which means or , which is unlike the situation in the IGM (the lowest panel of Figure 1); this results in an enhancement of the signal (Eq. (5)). For a halo of total mass with the background baryon to dark matter ratio, the peak flux is . This is smaller than the flux from the IGM and therefore can be neglected.
Thus, a BH that formed and started growing at high redshift can give rise to a source of 3HeII hyperfine line emission with a brightness temperature around K and a size of roughly an arc-minute (Figure 2); in addition the line width, given by expansion across the observable region, is . The flux from such a source is , here is the solid angle subtended by the source and . Assuming, (we consider the model for ), we get and the flux . Even though lies within the range of SKA1-MID, the flux is too small to be detectable by the deep SKA1-MID surveys in the line mode.
It is worth emphasizing the robustness of the resulting brightness temperature to different scenarios of BH growth. Fig. 2 (right panel) shows that the brightness temperature with only weakly dependence on the parameters of BH growth. This scaling stems from the thermodynamics of the gas in the ionized bubble. After ionization by the growing central BH gas, the temperature increases up to K nearly independent of the model of BH accretion, and when the accretion exhausts the gas begins to cool radiatively with the rate . With gas density temperature falls as
| (7) |
where is the matter density parameter. One can further infer approximately , with being the redshift when the gas started to cool. When this dependence is substituted into in Eq. (4), we get . This redshift dependence mostly determines the brightness temperature , which explains the vs scaling seen in Fig. 2.
We next consider whether a radio interferometer such as SKA1-MID can detect the flux owing to a collection of such 3HeII hyperfine line emitting regions. We consider the parameters of SKA1-MID for our analysis. In continuum observation, we assume a bandwidth and a range of synthesized beams, arc-seconds, for which the flux sensitivity of SKA1-MID is the highest and nearly the same in the frequency range of interest. The volume bounded by the solid angle of the systhesized beam and the bandwidth is . The number density of haloes in the mass range contribute principally to the signal. The (comoving) number density of such haloes can be computed from Press-Schcheter formalism: at . The total number of 3HeII hyperfine line emitting regions in the volume are , where is the fraction of haloes that host BHs. The total flux from all the sources in the volume and its fluctuation, assuming randomly spatial distribution of sources, is . Being an interferometer, SKA1-MID can only detect the fluctuation of the signal. We get:
| (8) | |||
For the parameters used above, SKA1-MID deep continuum survey can reach an RMS of nearly 150 nJy in 1000 hours of integration333https://www.skatelescope.org/wp-content/uploads/2014/03/SKA-TEL_SCI-SKO-SRQ-001-1_Level_0_Requirements-1.pdf, which suggests that the 3HeII signal is in the range of SKA1-MID but it would be a challenge to detect it.
In the foregoing, we considered a single accretion episode. It is possible the BH could undergo many such episodes. We note that multiple episodes of BH growth with accretion periods shorter than HeIII recombination time would diminish the brightness temperature in the hyperfine line, while increasing the angular size of the emitting region. In such a case, the evolutionary tracks on the angular size–brightness temperature plane (Figure 2) would consist of multiple loops of increasing but diminishing brightness temperature.
In the foregoing we assumed that the only source of ionization and heating of the circumgalactic and intergalactic medium is radiation produced by a hot super-critical accretion disk of the growing central BH. In this regard the other energy source – stellar activity in the host galaxy is worth mentioning. The most powerful energy reservoir associated with stellar population, particularly at the early epochs , are high-mass X-ray binaries. For large X-ray luminosity erg s-1, and star formation rate follow a relation (Grimm et al. , 2003; Gilfanov et al. , 2004) :
| (9) |
In the cases we study, an accreting BH with the initial mass grows by a factor of 1000 by , which causes its bolometric luminosity to increase from to erg s-1, as follows from Eq. (3). It is seen that the star formation may compete with the accreting BH in the generation of X-ray photons only for an exceptionally high SFRyr-1. It allows us to conclude that the contribution of stellar sources to the X-ray radiation in the IGM surrounding a grow BH is expected to be negligible (for details on the contribution of stellar sources see Vasiliev et al., 2018a).
We could also address the following question: what is the impact of distant sources on the ionization state of Helium surrounding an accreting BH. It can readily be shown that photons of energy less than a few hundred eV are locally absorbed which we have taken into account in our modelling. Photons for much larger energy (e.g. soft x-ray) can penetrate regions far away from their source of origin. It has been shown by Shull & van Steenberg (1985) that these photons make a negligible contribution to the ionized state of Helium especially if the ionization level is already high, as is our case where the hydrogen is almost fully ionized. Most of this energy goes into heating the medium to a temperature which is generally smaller than , the temperature of the gas in our case. This means such photons will have negligible impact of either ionization or the thermal state of the gas. This is in agreement with the detection of singly ionized helium at in the IGM, which shows that the second ionization of the helium was delayed with respect to the ionization of hydrogen and the first ionization of the helium (e.g. Worseck et al., 2019; Jakobsen et al., 1994).
In our study we assume that the CMB is the only radio source at high redshifts. This allows us to reach the conclusion that the hyperfine line from 3HeII is detectable in emission when the spin temperature exceeds the CMB temperature. This is also an important difference between our case and the local detection of the hyperfine line (e.g. Balser & Bania, 2018; Bania et al., 2010; Balser et al., 2006). We note that if there are additional radio sources much brighter than the CMB at redshifts of interest to us in this paper, the signal could also be seen in absorption.
5 Conclusions
In this paper, we explore the possibility of measuring the BBN 3He abundance by the detection of 3HeII hyperfine line 8.67 GHz emission from ionized zones around accreting black holes that form at high redshifts, . We model the ionization and thermal evolution of both the halo surrounding the BH and the expanding IGM surrounding the halo.
We compute the brightness temperature and the angular extent of regions emitting in the 3HeII hyperfine in the IGM. We also estimate the flux in the line from the halo. The 3HeII hyperfine line emission from the IGM reaches a maximum after the accretion onto the BH is finished. After this phase, the HeIII zones around the BH begin to recombine and produce higher HeII fraction, which reaches up to of the total He abundunce. This luminous ’afterglow’ phase lasts over 40 million years if the accretion ends at . Its duration is longer if the redshift at which the accretion ends is lower.
We find that the maximum brightness temperature is K to 0.5 K, depending on the epoch when such a black hole starts growing, and the maximum angular size is around . The flux from such a region is . The flux from the halo hosting the BH is an order of magnitude smaller. We investigate the detection of this signal using SKA1-MID. While the flux from a single region is too small to be detected, we estimate the expected flux from collection of such regions for a volume bounded by the synthesized beam and the bandwidth of SKA1-MID. The RMS of this quantity is detectable by SKA1-MID. We find that while it would still be a challenge to detect this signal, it is within the range of expected sensitivity of SKA1-MID.
6 Acknowledgements
This work is supported by the joint RFBR-DST project (RFBR 17-52-45063, DST P-276). EV is grateful to the Ministry for Education and Science of the Russian Federation (grant 3.858.2017/4.6). The work by YS is done under partial support from the joint RFBR-DST project (17-52-45053), by the project 01-2018 “New Scientific Groups LPI”, and the Program of the Presidium of RAS (project code 28).
References
- Aver et al. (2015) Aver, E., Olive, K. A., Skillman, E. D., 2015, JCAP, 7, 011
- Bagla & Loeb (2009) Bagla, J.S. & Loeb, A., 2009, arXiv0905.1698
- Balashev et al. (2016) Balashev, S., et al. 2016, MNRAS, 458, 2188
- Balser & Bania (2018) Balser, D. S., & Bania, T. M. 2018, AJ, 156, 280
- Balser et al. (2006) Balser, D. S., Goss, W. M., Bania, T. M., & Rood, R. T. 2006, ApJ, 640, 360
- Bania et al. (2010) Bania, T. M., Rood, R. T., & Balser, D. S. 2010, Light Elements in the Universe, 268, 81
- Barkana & Loeb (2001) Barkana, R., Loeb, A., 2001, PhR, 349, 125
- Bell (2000) Bell, M. B., 2000, ApJ, 531, 820
- Bondi (1952) Bondi, H., 1952, MNRAS, 112, 195
- Bondi & Hoyle (1944) Bondi, H., & Hoyle, F., 1944, MNRAS, 104, 273
- Cen (1992) Cen, R., 1992, ApJ, 78, 341
- Cooke (2015) Cooke, R. J., 2015, ApJ, 812, L12
- Cooke et al. (2018) Cooke, R. J., Pettini, M., Steidel, C. C., 2018, ApJ, 855, 102
- Cyburt et al. (2016) Cyburt, R. H., et al. , 2016, RvMP, 88, 015004
- Draine (2006) Draine, B. T., 2016, ASPC, 348, 58
- Fields (2011) Fields, B. D. 2011, Annual Review of Nuclear and Particle Science, 61, 47
- Field (1958) Field, G. B., 1958, Proc. IRE, 46, 240
- Goldwire & Goss (1967) Goldwire, H. C., Jr & Goss, W. M., 1967, ApJ, 149, 15
- Gilfanov et al. (2004) Gilfanov, M., Grimm, H.-J., Sunyaev, R., 2004, MNRAS, 347, L57
- Grimm et al. (2003) Grimm, H.-J., Gilfanov, M., Sunyaev, R., 2003, MNRAS, 339, 793
- Inayoshi et al. (2016) Inayoshi, K., Haiman, Z., Ostriker, J. P., 2016, MNRAS, 459, 3738
- Izotov et al. (2014) Izotov, Yu. I., et al. , 2014, MNRAS, 445, 778
- Jakobsen et al. (1994) Jakobsen, P., Boksenberg, A., Deharveng, J. M., et al. 1994, Nature, 370, 35
- Li et al. (2011) Li, Y.-R., Ho, L. C., Wang, J.-M., 2011, ApJ, 742, 33
- McQuinn & Switzer (2009) McQuinn, M., Switzer, E. R., 2009, PhRvD, 80, 063010
- Planck Collaboration, et al. (2016) Planck Collaboration, et al. , 2016, A&A, 594, A13
- Prochaska (2017) Prochaska, J. X., 2017, A&C, 19, 27
- Ricotti et al. (2002) Ricotti, M., Gnedin, N.Y., Shull, J.M., 2002, ApJ, 575, 33
- Rood et al. (1979) Rood, R. T., Wilson, T. L., Steigman, G., 1979, ApJ, 227, L97
- Sakurai, Inayoshi & Haiman (2016) Sakurai, Y., Inayoshi, K., Haiman, Z., 2016, MNRAS, 461, 4496
- Seager et al. (2000) Seager, S., Sasselov, D. & Scott, D., 2000, ApJS, 128, 407
- Shakura & Sunyaev (1973) Shakura, N. I. & Sunyaev, R. A., 1973, A&A, 24, 337
- Shima et al. (1985) Shima, E., Matsuda, T., Takeda, H., Sawada, K., 1985, MNRAS, 217, 367
- Shull & van Steenberg (1985) Shull, J.M., van Steenberg, M.E., 1985, ApJ, 298,
- Sunyaev (1966) Sunyaev, R.A., 1966, Astron. Zh., 43, 1237
- Takeuchi et al. (2014) Takeuchi, Y., Zaroubi, S., Sugiyama, N., 2014, MNRAS, 444, 2236
- Townes (1957) Townes, C. H., 1957, in van de Hulst H. C., ed., Proc. IAU Symp. 4, Radio Astronomy. Cambridge Univ. Press, Cambridge, p. 92
- Vasiliev et al. (2018a) Vasiliev, E. O., Ryabova, M. V., Shchekinov, Y. A., & Sethi, S. K. 2018a, Astrophysical Bulletin, 73, 401
- Vasiliev et al. (2018b) Vasiliev, E.O., Sethi, S.K., Shchekinov, Yu.A., 2018b, ApJ, 865, 130
- Volonteri & Rees (2005) Volonteri, M., & Rees, M.J., 2005, ApJ, 633, 624
- Volonteri & Rees (2006) Volonteri, M., & Rees, M.J., 2006, ApJ, 650, 669
- Woosley et al. (2002) Woosley, S.E., Heger, A., Weaver, T.A., 2002, Rev. Mod. Phys., 74, 1015
- Worseck et al. (2019) Worseck, G., Davies, F. B., Hennawi, J. F., & Prochaska, J. X. 2019, ApJ, 875, 111
- Wouthuysen (1952) Wouthuysen, S. 1952, AJ, 57, 31
- Zavarygin et al. (2018) Zavarygin, E. O., Webb, J. K., Dumont, V., Riemer-Sørensen, S., 2018, MNRAS, 477, 5536