Magnetic order and single-ion anisotropy in Tb3Ga5O12
Abstract
Terbium gallium garnet (TGG), Tb3Ga5O12, is well known for its applications in laser optics, but also exhibits complex low-temperature magnetism that is not yet fully understood. Its low-temperature magnetic order is determined by means of time-of-flight neutron powder diffraction. It is found to be a multiaxial antiferromagnet with magnetic Tb3+ ions forming six sublattices of magnetic moments aligned parallel and anti-parallel to the crystallographic directions of the cubic unit cell. The structure displays strong easy-axis anisotropy with respect to a two-fold axis of symmetry in the local orthorhombic environment of the Tb3+ sites. The crystal-field splitting within the single-ion ground-state manifold is investigated by inelastic neutron scattering on powder samples. A strong temperature dependence of the quasidoublet ground-state is observed and revised parameters of the crystal-field Hamiltonian are given. The results of bulk magnetic susceptibility and magnetisation measurements are in good agreement with values based on the crystal-field model down to 20 K, where the onset of magnetic correlations is observed.
I Introduction
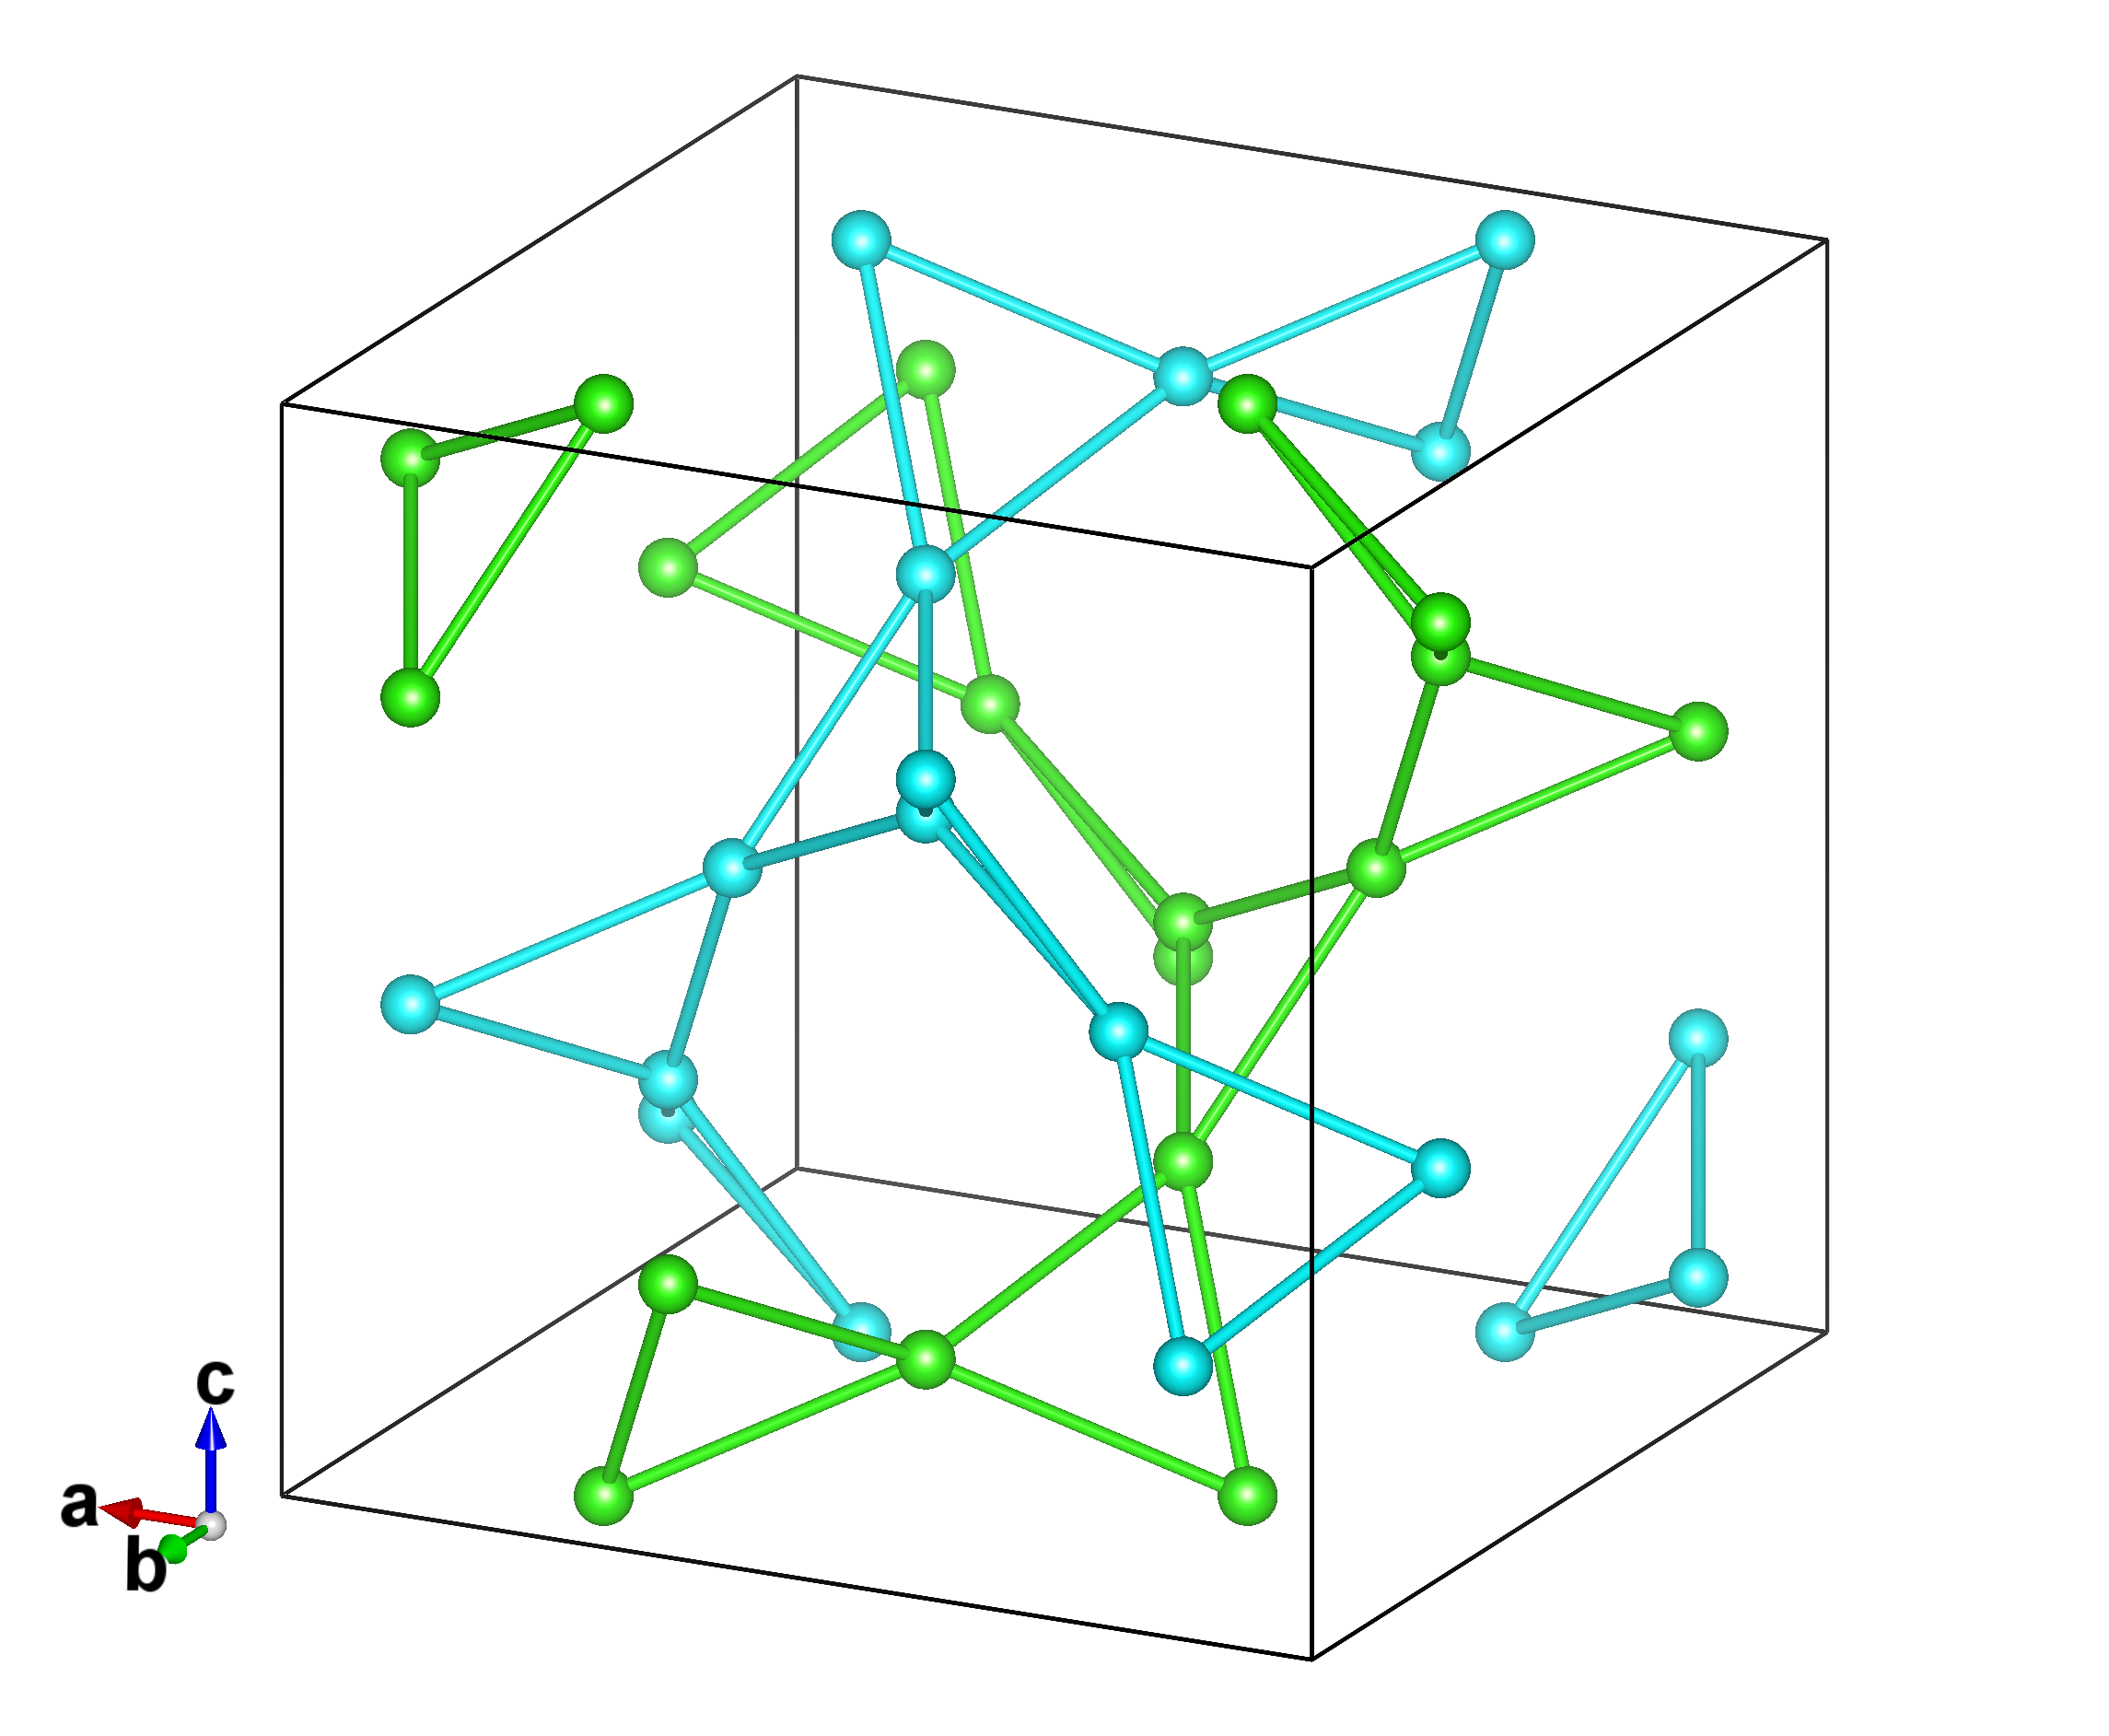
Many current studies of the garnet family focus on technological applications of Y3Al5O12 and Y3Fe5O12 (in optoelectronics Choudhary et al. (2015) and magnonics Serga et al. (2010); Collet et al. (2016); Flebus et al. (2017) respectively), but the garnet structure also contains two inter-penetrating half-garnet lattices (Fig. 1) - twisting spatial arrangements of corner-sharing triangles - which are of considerable interest for highly frustrated magnetism. An individual half-garnet or hyperkagome lattice, along with the pyrochlore lattice, are candidates for the construction of three dimensional Coulomb phases Henley (2010). There are two series of rare earth garnets, Al5O12 and Ga5O12 (where is a trivalent rare earth ion), and, as in rare earth pyrochlores Gardner et al. (2010), competition between exchange and dipolar interactionsBall et al. (1963); Felsteiner and Misra (1981) and crystal field anisotropy produces contrasting properties throughout the series, often with highly anisotropic magnetic order at low temperature Ball et al. (1961); Hastings et al. (1965); Hammann (1968a, b, 1969); Hammann and Ocio (1975, 1977). Gd3Ga5O12 (GGG) Hov et al. (1980) is the only fully frustrated garnet in which no long-range magnetic order has been observed to the lowest temperature Hastings et al. (1965); Hammann (1969); Quilliam et al. (2013), and recent investigations discovered cooperative magnetic multipolar degrees of freedom underlying the spin correlations of the low temperature phase of GGG Paddison et al. (2015).
In TGG, the non-Kramers ion Tb3+, has a quasidoublet ground state composed of two closely spaced singlets as a result of the orthorhombic crystal electric field (CEF)Guillot and Marchand (1985). Thus the magnetic properties of TGG are strongly anisotropic, and long range order is expected to be of the induced-moment type. Highly anisotropic magnetic properties, including step-like magnetisation curves, demonstrate the importance of single-ion crystal field effects Guillot and Marchand (1985); Kamazawa et al. (2008); Araki et al. (2008). Rare earth garnets with non-collinear Ising anisotropy and dominant dipolar interactions are expected to order with a magnetic structure formed of interpenetrating antiferromagnetic chains running along the directions Ball et al. (1963); Hastings et al. (1965); Hammann (1969). TGG orders with this structure at K Hamman and Manneville (1973), but it has been suggested that hyperfine interactions must be incorporated to explain the observed Hamman and Manneville (1973); Hammann and Ocio (1975, 1977). The existence of a correlated phase for has not been examined.
Moreover, at higher temperatures, in addition to its well-known large Verdet constant and transparency, which make it a suitable material for Faraday rotators and optical isolatorsDentz et al. (1974); Villaverde et al. (1978); Barnes and Petway (1992), TGG also exhibits an acoustic Faraday effect Thalmeier (2009); Sytcheva et al. (2010) Cotton-Mouton Löw et al. (2014) and a thermal Hall effect Strohm et al. (2005); Inyushkin and Taldenkov (2007) (for which it is the prototypical system), suggestive of important spin-lattice interactions. Despite several attempts Sheng et al. (2006); Kagan and Maksimov (2008); Mori et al. (2014), the thermal Hall effect lacks an unequivocal microscopic description. Detailed knowledge of the magnetic interactions and crystal field wavefunctions in TGG plays a crucial role as a starting point required to understand any frustrated phase and the ordering mechanism that terminates it, as well as an eventual understanding of the magnetoelastic and magnetothermal effects.
Here, results of our studies on powder samples of TGG are presented. Neutron and x-ray diffraction were used to determine details of the crystalline and magnetic structures (Sec. III.1) that are fundamental for any further considerations. Inelastic neutron scattering (INS) was employed to observe crystal electric field transitions (Sec.III.2) and this information was used to refine the parameters of the CEF Hamiltonian. The results of bulk magnetisation measurements are compared to the calculated forms determined by the CEF model (Sec. III.3). Discussion of the results is followed by remarks as to the outlook for future single crystal studies.
II Methods
II.1 Sample preparation
A single crystal in the form of a cylindrical rod (⌀= mm and mm) cut out of an ingot grown by the Czochralski method was acquired from FEE (Idar-Oberstein, Germany) and crushed to a fine powder in an agate pestle and mortar.
II.2 Synchrotron x-ray powder diffraction
For a precise determination of structural parameters, a high-resolution synchroton x-ray powder diffraction (SXRPD) experiment was performed on the Materials Science Beamline at the Swiss Light Source (Paul Scherrer Institute, Villigen, Switzerland). The powder sample was loaded in a borosilicate glass capillary and a diffraction pattern was taken at room temperature ( K). The ⌀= mm diameter of the capillary in combination with photon energy keV ( Å) were chosen to minimise the sample absorption.
II.3 Neutron time-of-flight powder diffraction
Neutron diffraction patterns were collected on the WISH time-of-flight diffractometer at ISIS neutron and muon facility (Rutherford-Appleton Laboratory, Harwell, UK). A dilution refrigerator insert was used to cool the sample below . For this procedure g of powder was compacted in a mm copper can. In order to enable faster thermalisation of the sample, the can was indium sealed and equipped with a capillary which allowed for the introduction of 4He exchange gas during the cooling process. This is particularly important given the low thermal conductivity of garnets at K Inyushkin and Taldenkov (2010), the slow thermalisation of their magnetic structures, and the low of TGG. The sample was held at base temperature, K for hours before diffraction measurements commenced. During initial runs, the solid methane moderator was above its intended operating temperature, which modifies the wavelength spectrum and reduces the neutron flux of the instrument, but subsequently diffraction patterns were recorded at base temperature ( K), , , and K. The appearance of magnetic Bragg reflections indicated the thermalisation of at least part of the sample below , but a significant decrease in the intensity of the magnetic peaks with concurrent development of diffuse scattering around the Bragg positions, was observed during the collection of the base temperature diffraction patterns once the moderator reached full performance. Since the changes occurred only concurrently with the exposure of the sample to the neutron beam, they were attributed to beam heating. This implies that the measured low temperature data are an average over a range of temperatures, and the full low temperature ordered moment cannot be accurately determined. The collected patterns were analysed by the Rietveld and the LeBail refinement methods with use of the FULLPROF suite Rodr guez-Carvajal (1993).
II.4 Inelastic neutron scattering
Time-of-flight neutron spectroscopy experiments were conducted on the MARI (direct geometry) and IRIS (indirect geometry) time-of-flight spectrometers at ISIS (Rutherford-Appleton Laboratory, Harwell, UK). For MARI, g of powder was wrapped in an aluminium foil sachet and placed in a mm Al can. Spectra with and meV were recorded at K and K, using a Fermi chopper with a gadolinium coated slit package. The best energy resolution at energy transfer meV was obtained with meV, where meV. For IRIS, the same amount of sample, also wrapped in an Al sachet, was placed in a mm can. Datasets were collected with the PG(002) and PG(004) analyser setups. The former allows for measurement within an almost symmetric, narrow dynamical range ( meV) and its excellent resolution of eV at the elastic line was used to investigate the components of the ground-state quasidoublet. The latter setup expands the dynamical window on the neutron energy loss side ( meV), providing a eV resolution at the elastic line, thus enabling observations of CEF excitations at higher energies. The measurements were conducted at temperatures in range K.
II.5 Magnetization
Magnetic susceptibility data were collected on a small portion of the same powder sample ( mg), in an applied magnetic field of T, using a Quantum Design MPMS XL-7 superconducting quantum interference device (SQUID) magnetometer. Using the same device, the magnetisation was measured with a smaller sample ( mg) fo fields up to T and temperature range K.
III Results
III.1 Crystalline and ordered magnetic structure
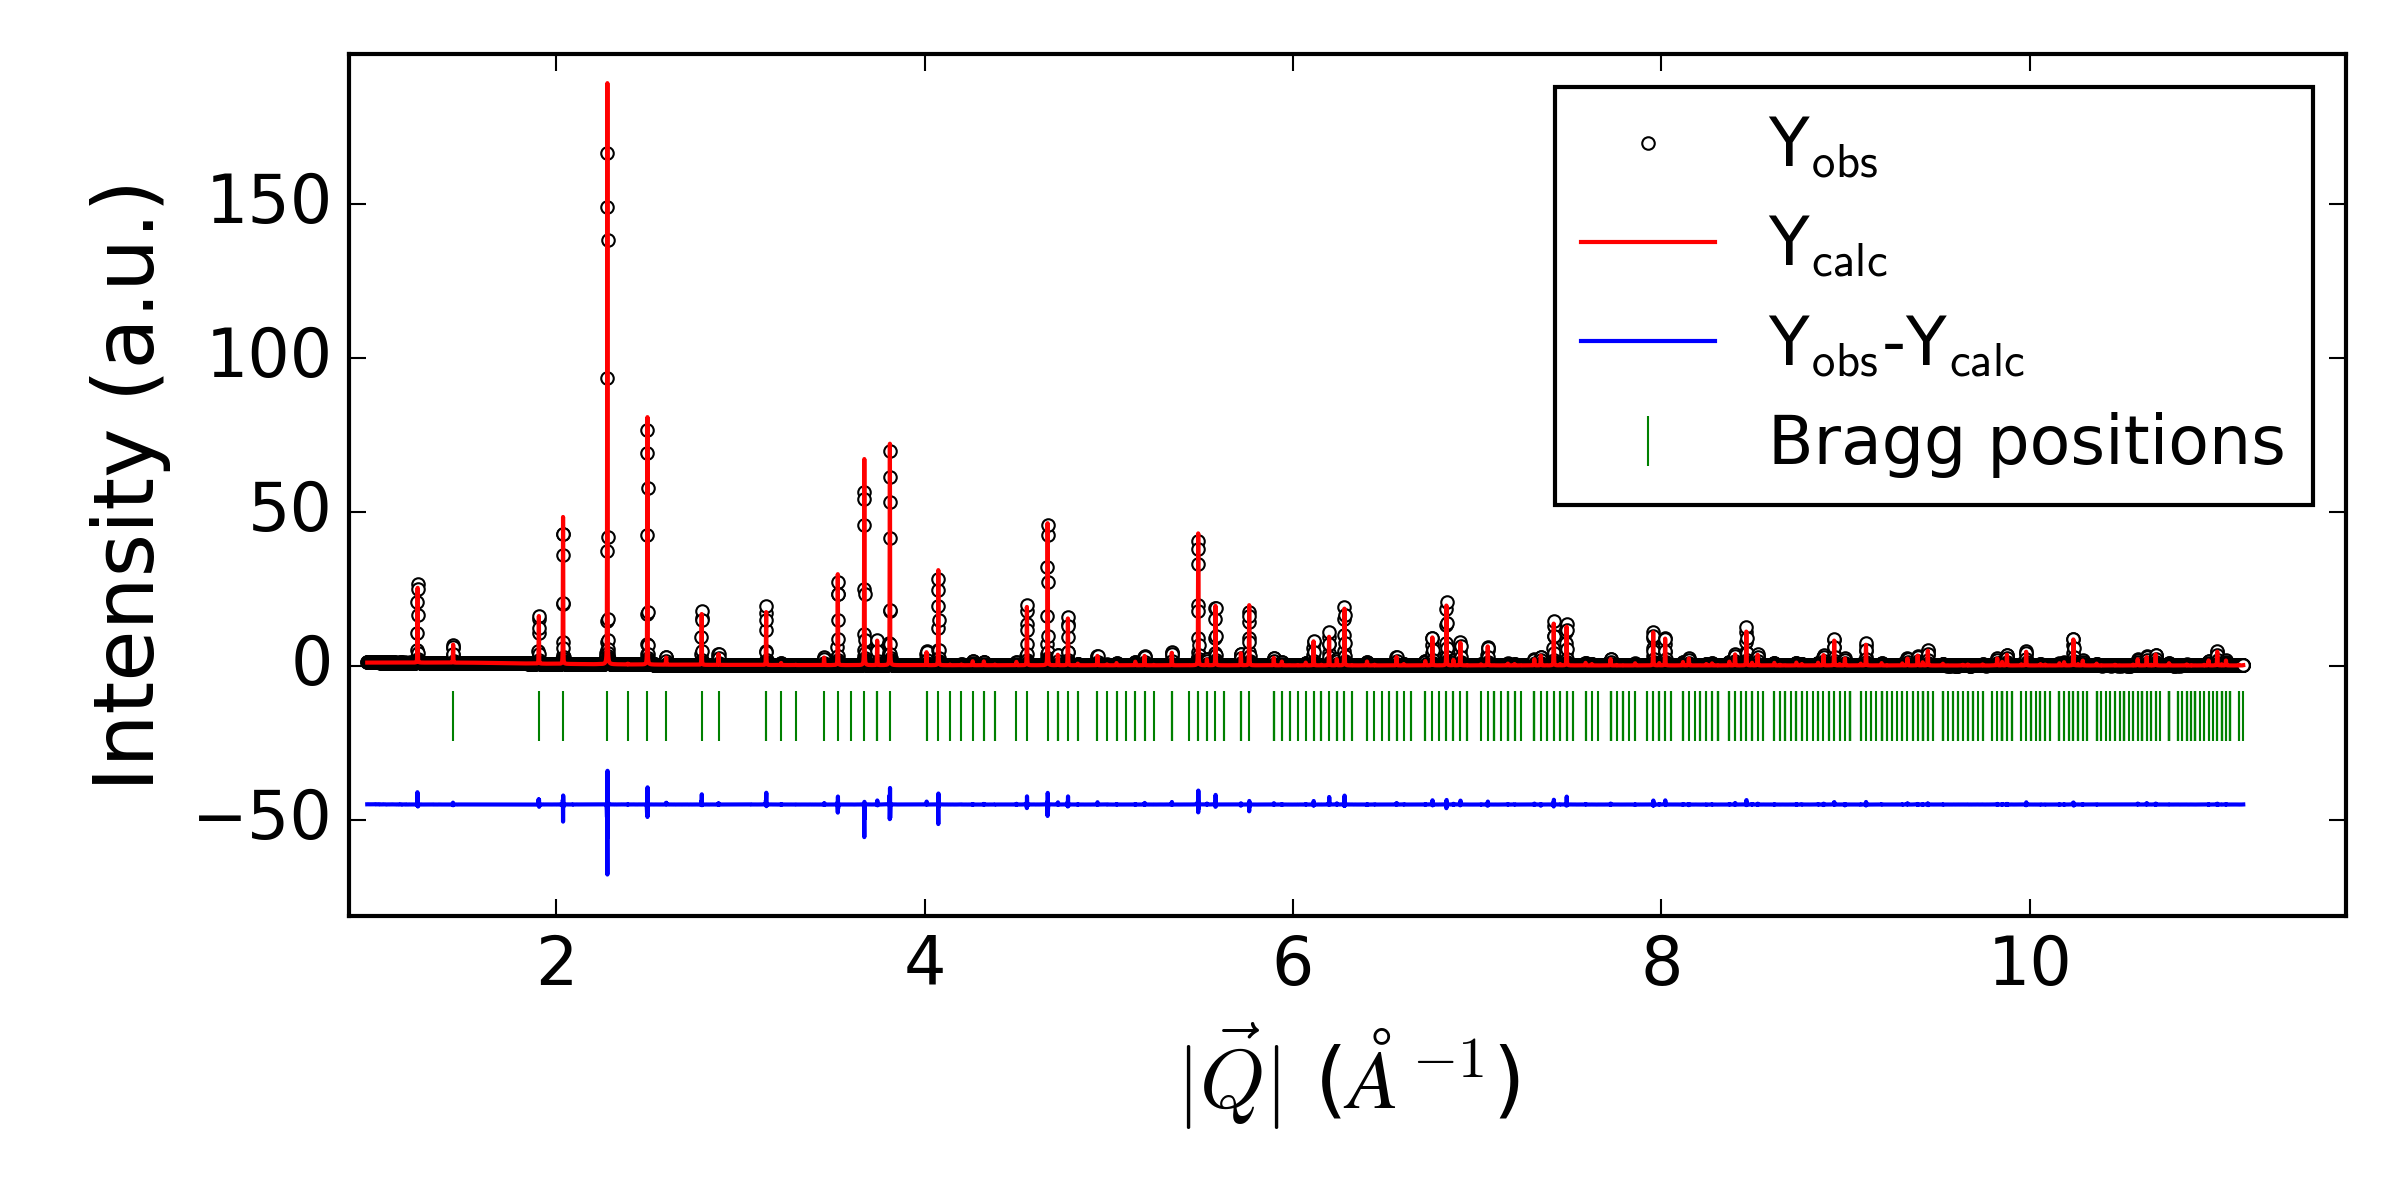
TGG crystallises in the body-centred cubic space-group (No. 230). The Tb3+ ions occupy the 24 Wyckoff positions (with point group or ), forming two half-garnet sub-lattices (Fig. 1). The lattice constant of TGG at room temperature, determined from a Rietveld refinement of the x-ray diffraction pattern is Å. The presence of superstoichiometric Tb3+ ions in Czochralski-grown TGG has been discussed in the literature Mori et al. (2014). Because of the large contrast between Ga3+ and Tb3+ in x-ray diffraction, Rietveld refinement enabled a precise determination of the stoichiometry of our sample, which was found to be Tb3.031(3)Ga4.969(3)O12. (The small difference between the coherent neutron scattering lengths of Tb and Ga does not allow for cross-verification by neutron diffraction Not (a)). Superstoichiometric Tb3+ ions were found exclusively at the octahedral Ga site (with trigonal point group or ). Attempts to refine a population of terbium ions on other sites led to non-physical negative values of the site occupancy. The rest of the refined crystal structure parameters are presented in Table 1 and the Rietveld refinement is presented in Fig. 2.
| Atom | Wyckoff position | Occupancy | (Å2) | |||
|---|---|---|---|---|---|---|
| Ga1 | 0 | 0 | 0 | 1.969(3) | 0.217(5) | |
| Tb2* | 0 | 0 | 0 | 0.031(3) | 0.217(5) | |
| Tb | 1/8 | 0 | 1/4 | 3 | 0.239(1) | |
| Ga2 | 3/8 | 0 | 1/4 | 3 | 0.283(3) | |
| O | 0.286(1) | 0.0566(1) | 0.6500(1) | 12 | 0.23(2) |
The magnetic intensity in the neutron diffraction data was separated by subtracting the 15 K dataset from the one measured at . A flat background was added to remove negative intensity resulting from the presence of diffuse scattering in the vicinity of magnetic Bragg positions at higher temperatures. This procedure allowed for the observation of five magnetic reflections (Fig. 3), two of them appearing at nuclear allowed positions and ). All of the magnetic Bragg peaks can be indexed by the propagation vector .
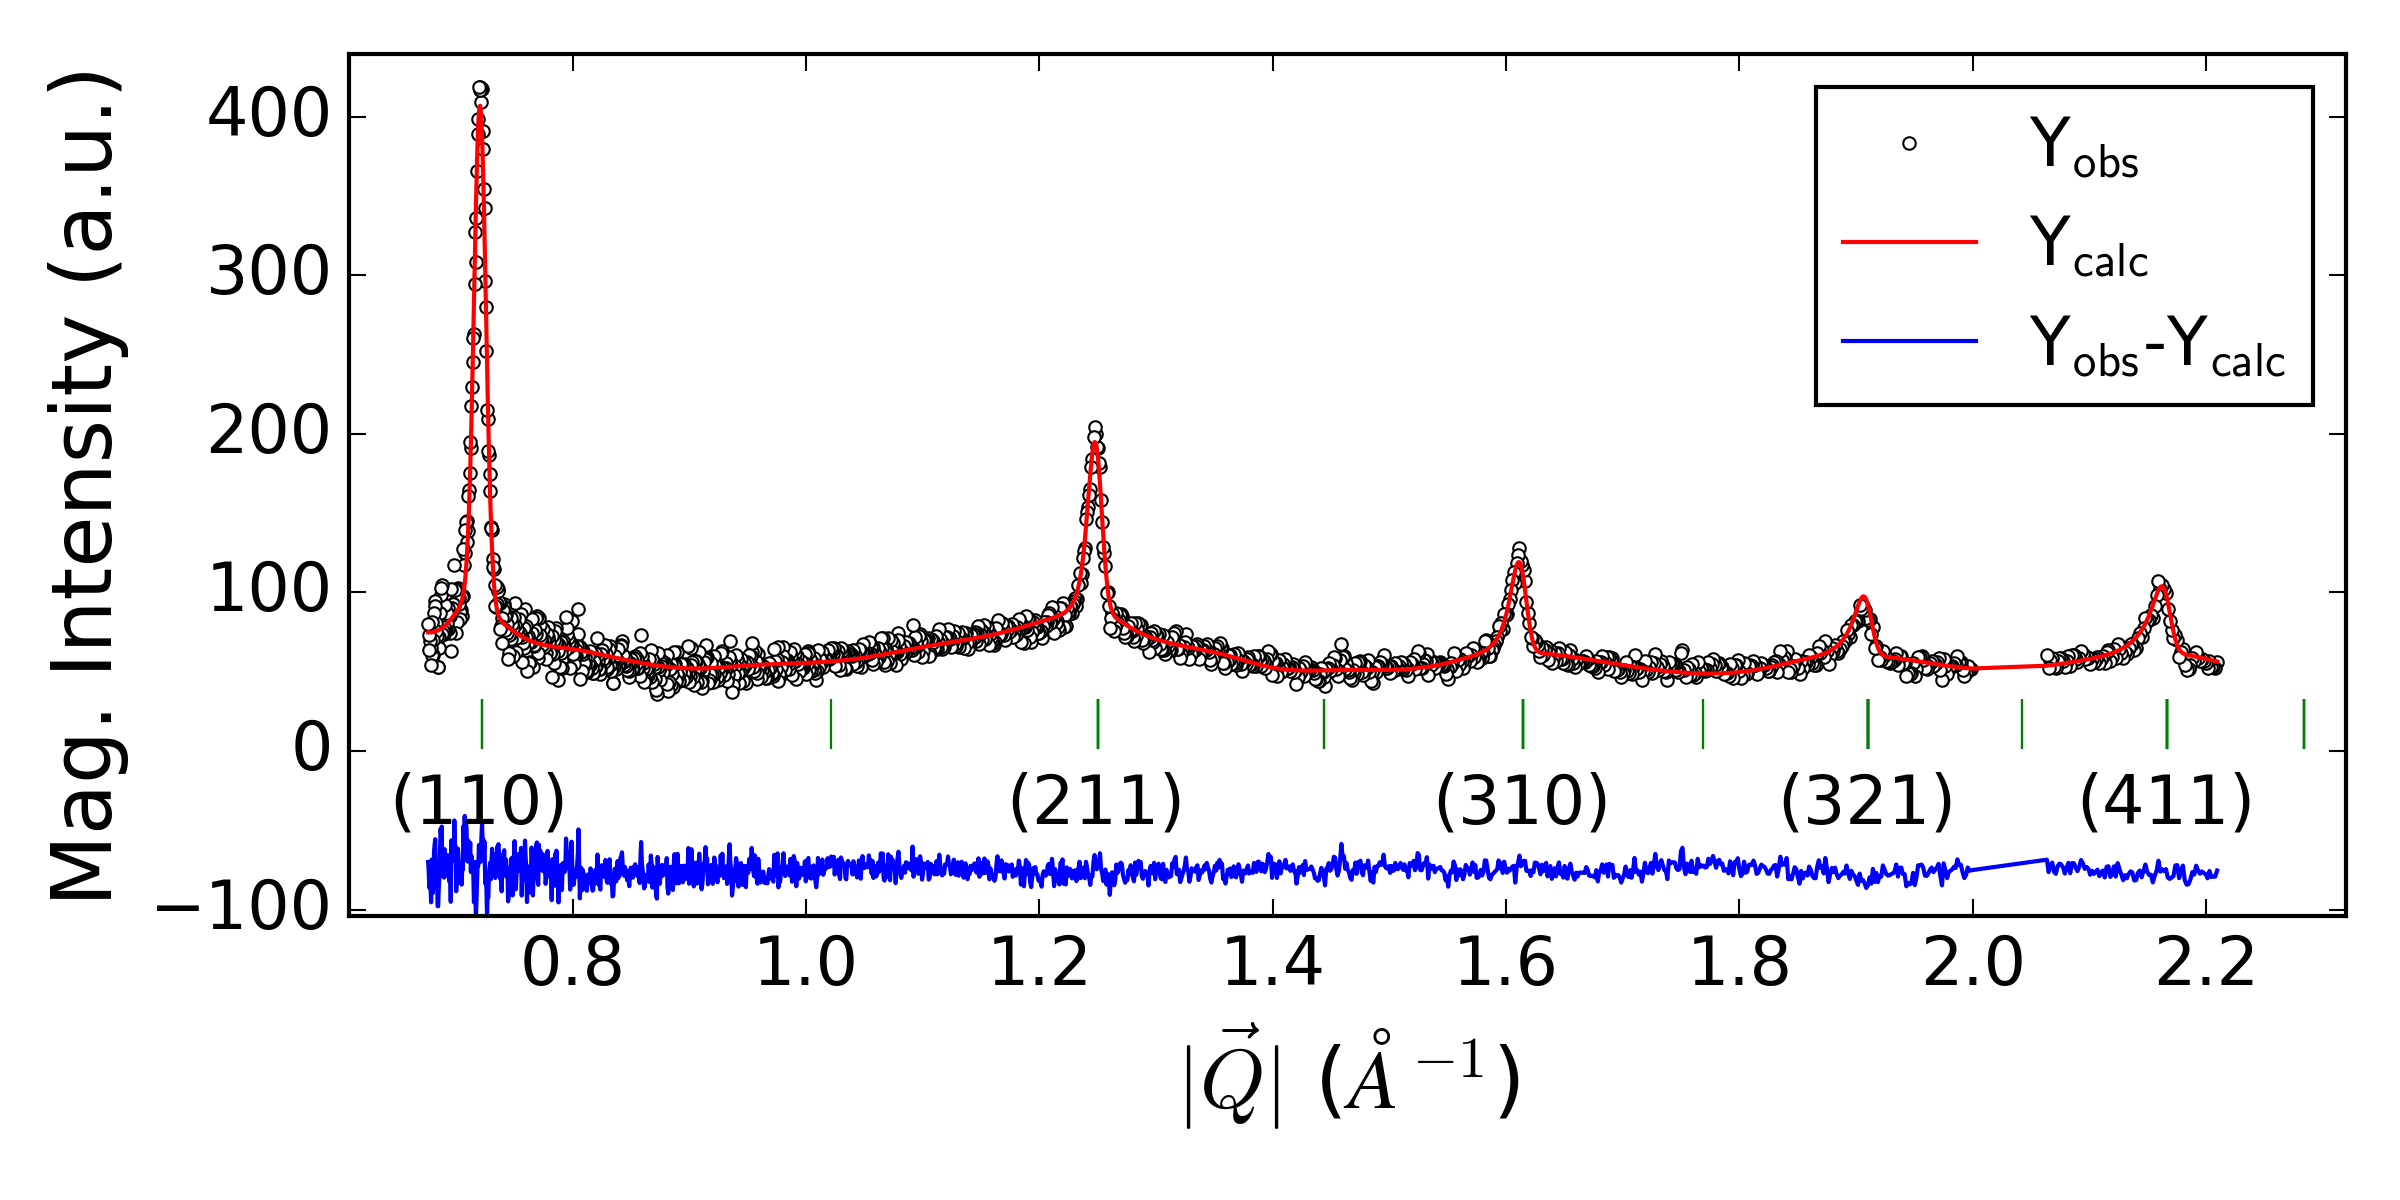
Using the ISOTROPY package Stokes et al. , 8 irreducible representations of the space-group and the propagation vector were found kpo (-dimensional: , ; -dimensional: , ; -dimensional: , , and ; in Miller-Love notation). Their magnetic moment basis functions were projected out and combined with corresponding order parameter directions. These generated 14 possible sets of basis vector directions. 11 sets were immediately excluded as they are incompatible with the presence or absence of certain magnetic Bragg peaks in the experimental diffraction pattern, i.e. the diffraction data show the presence of antiferromagnetic and absence of ferromagnetic reflections (Fig. 3). Rietveld refinement of the remaining possibilities, and examination of the relative intensities of the observed reflections, allowed us to unambiguously assign the 1-dimensional irreducible representation to the observed pattern (Fig. 3). This structure has the magnetic space-group . The scale factor of the Rietveld refinements was set by refining the room temperature structural model obtained from the x-ray experiment against the data measured at K (not shown, no unexpected changes of parameters or misfits occur). In the course of the magnetic intensity refinement, the wavelength-dependent absorption correction parameters were re-refined to provide a better match in the low- region. These adjustments permitted an excellent correspondence of the observed and calculated magnetic intensities in this limited -range. The strength of the ordered magnetic moment was determined to be (where with being the angular momentum operators and the Bohr magneton). Such value is significantly smaller than that previously reported for terbium garnets Hamman and Manneville (1973); Hammann and Ocio (1975) but consistent with the heating of the sample toward by the neutron beam (the initial measurement with partially thermalised moderator and inferior refinement gives ).
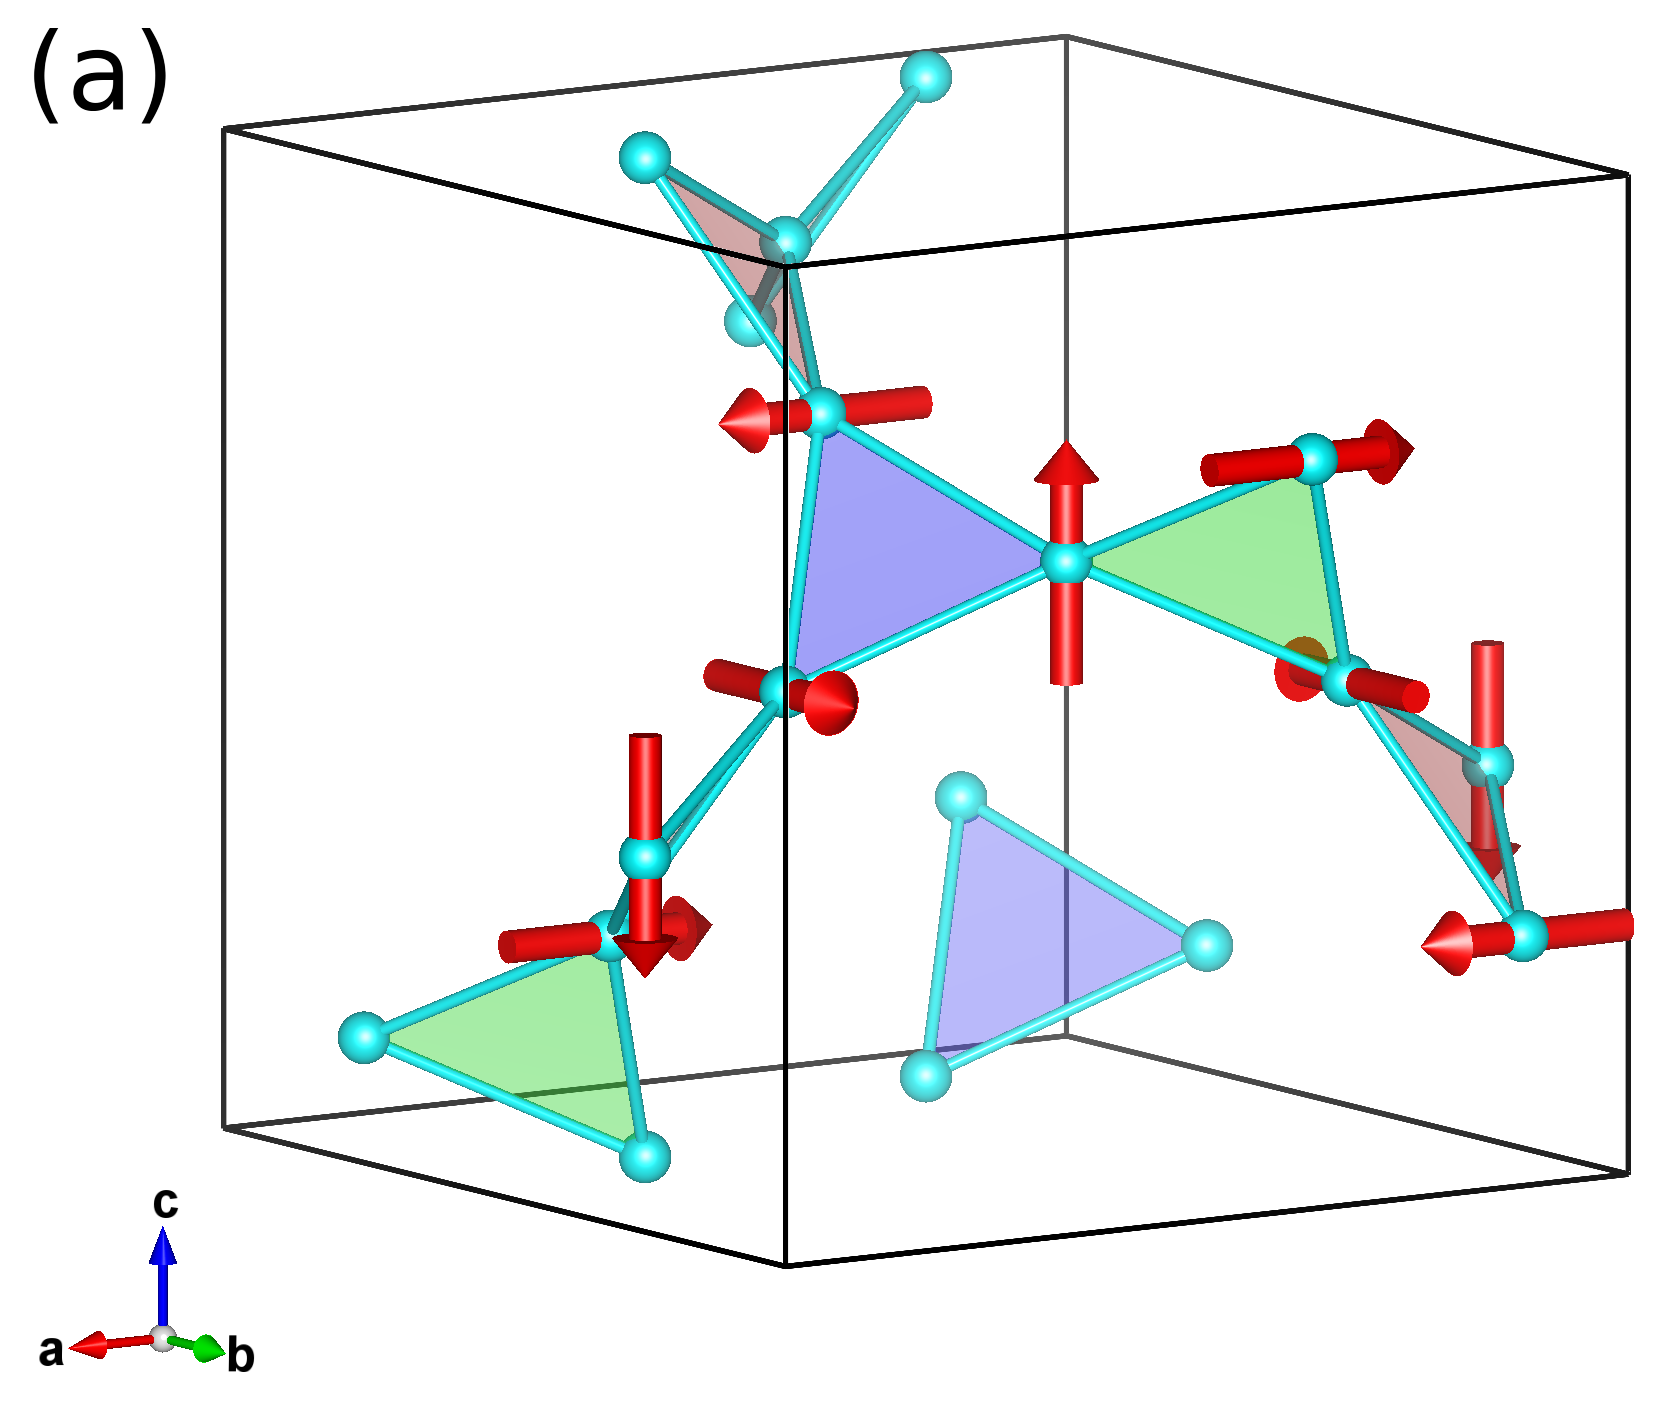
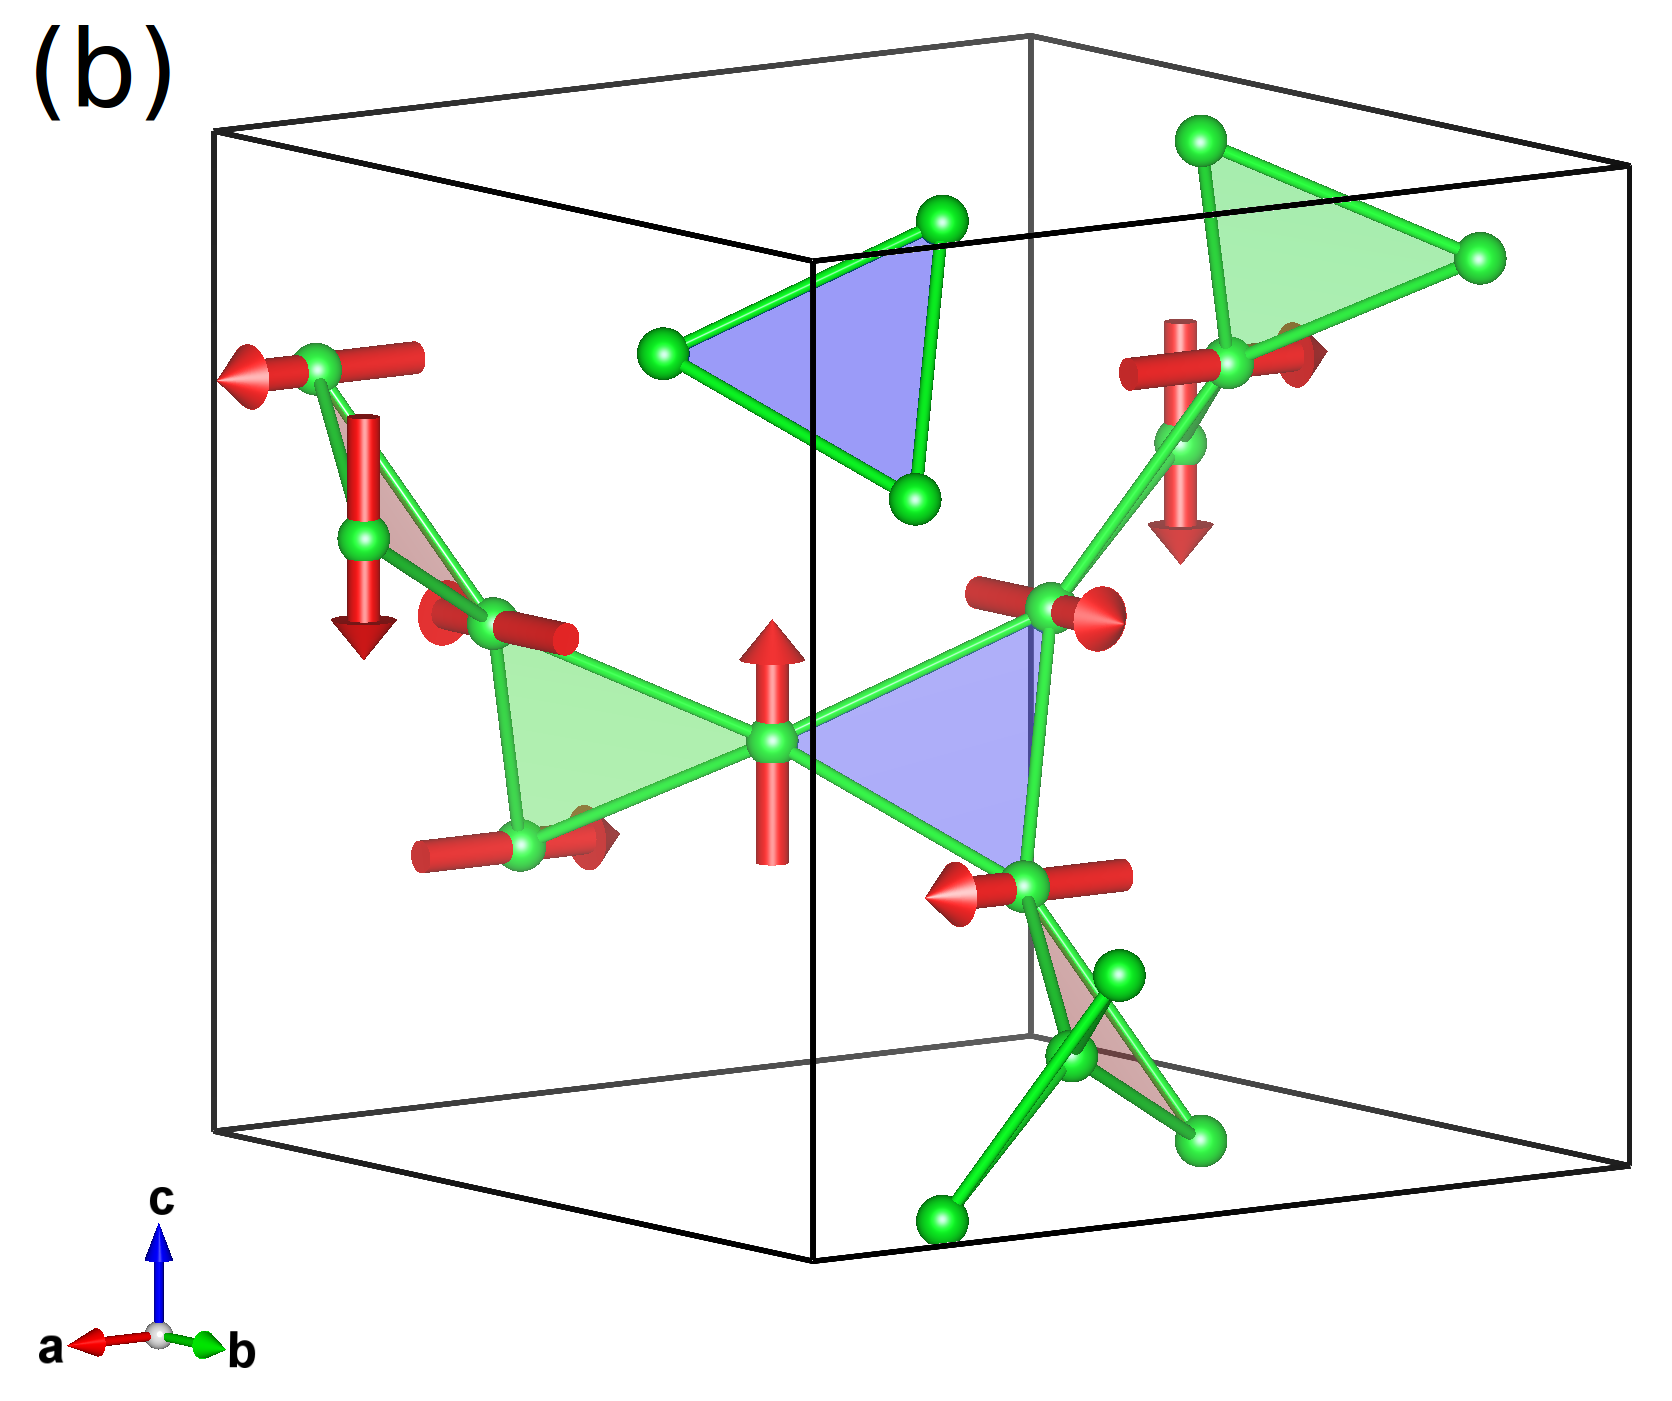
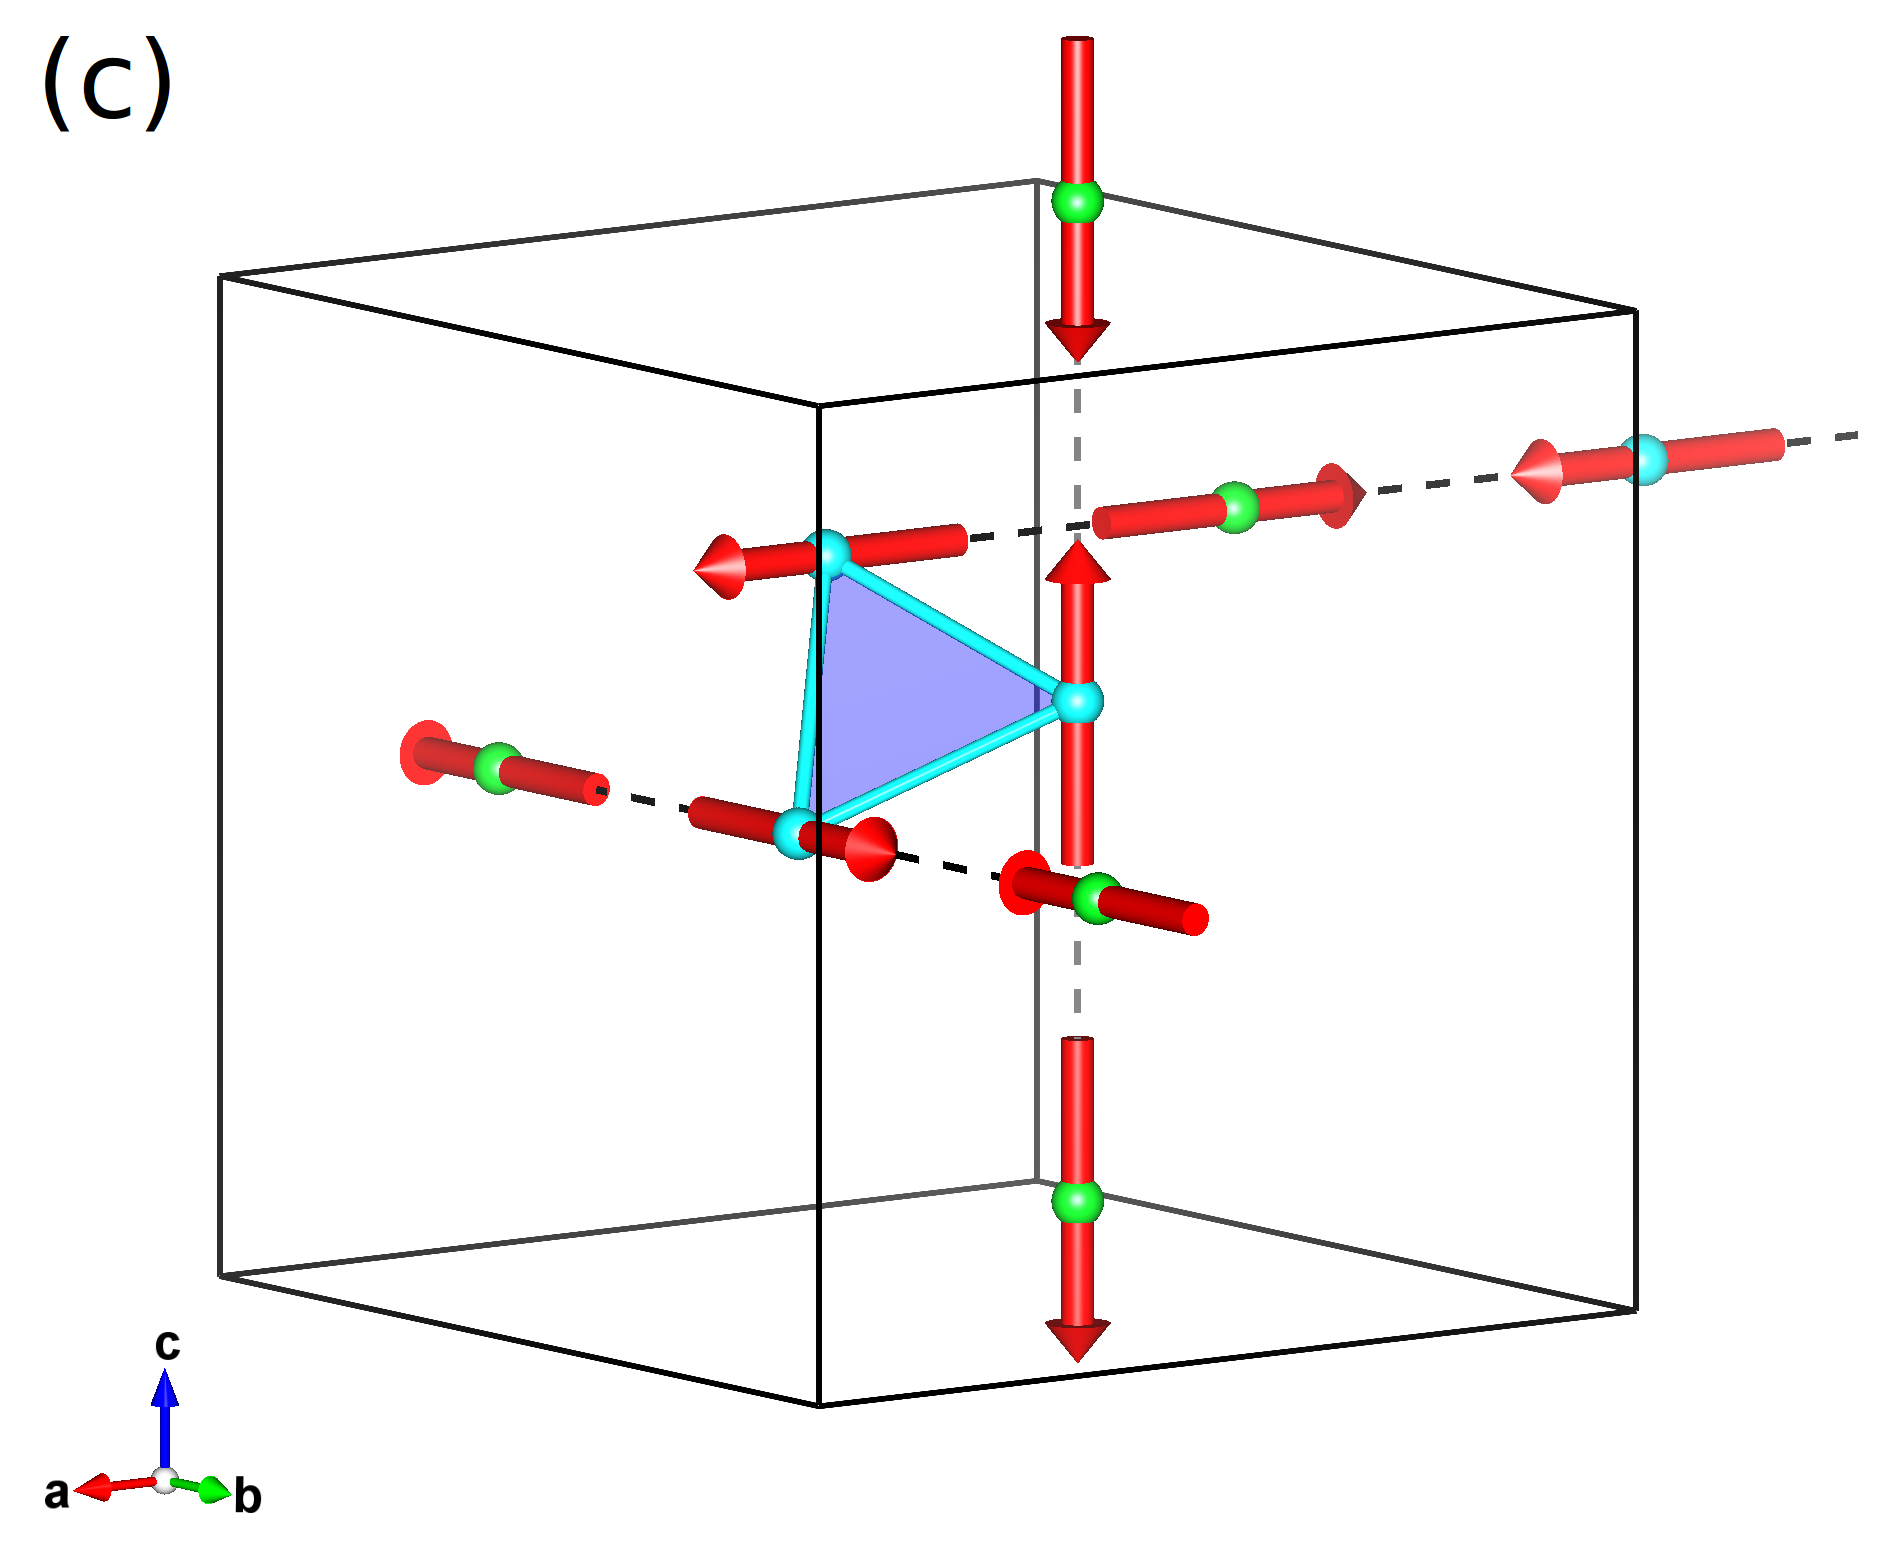
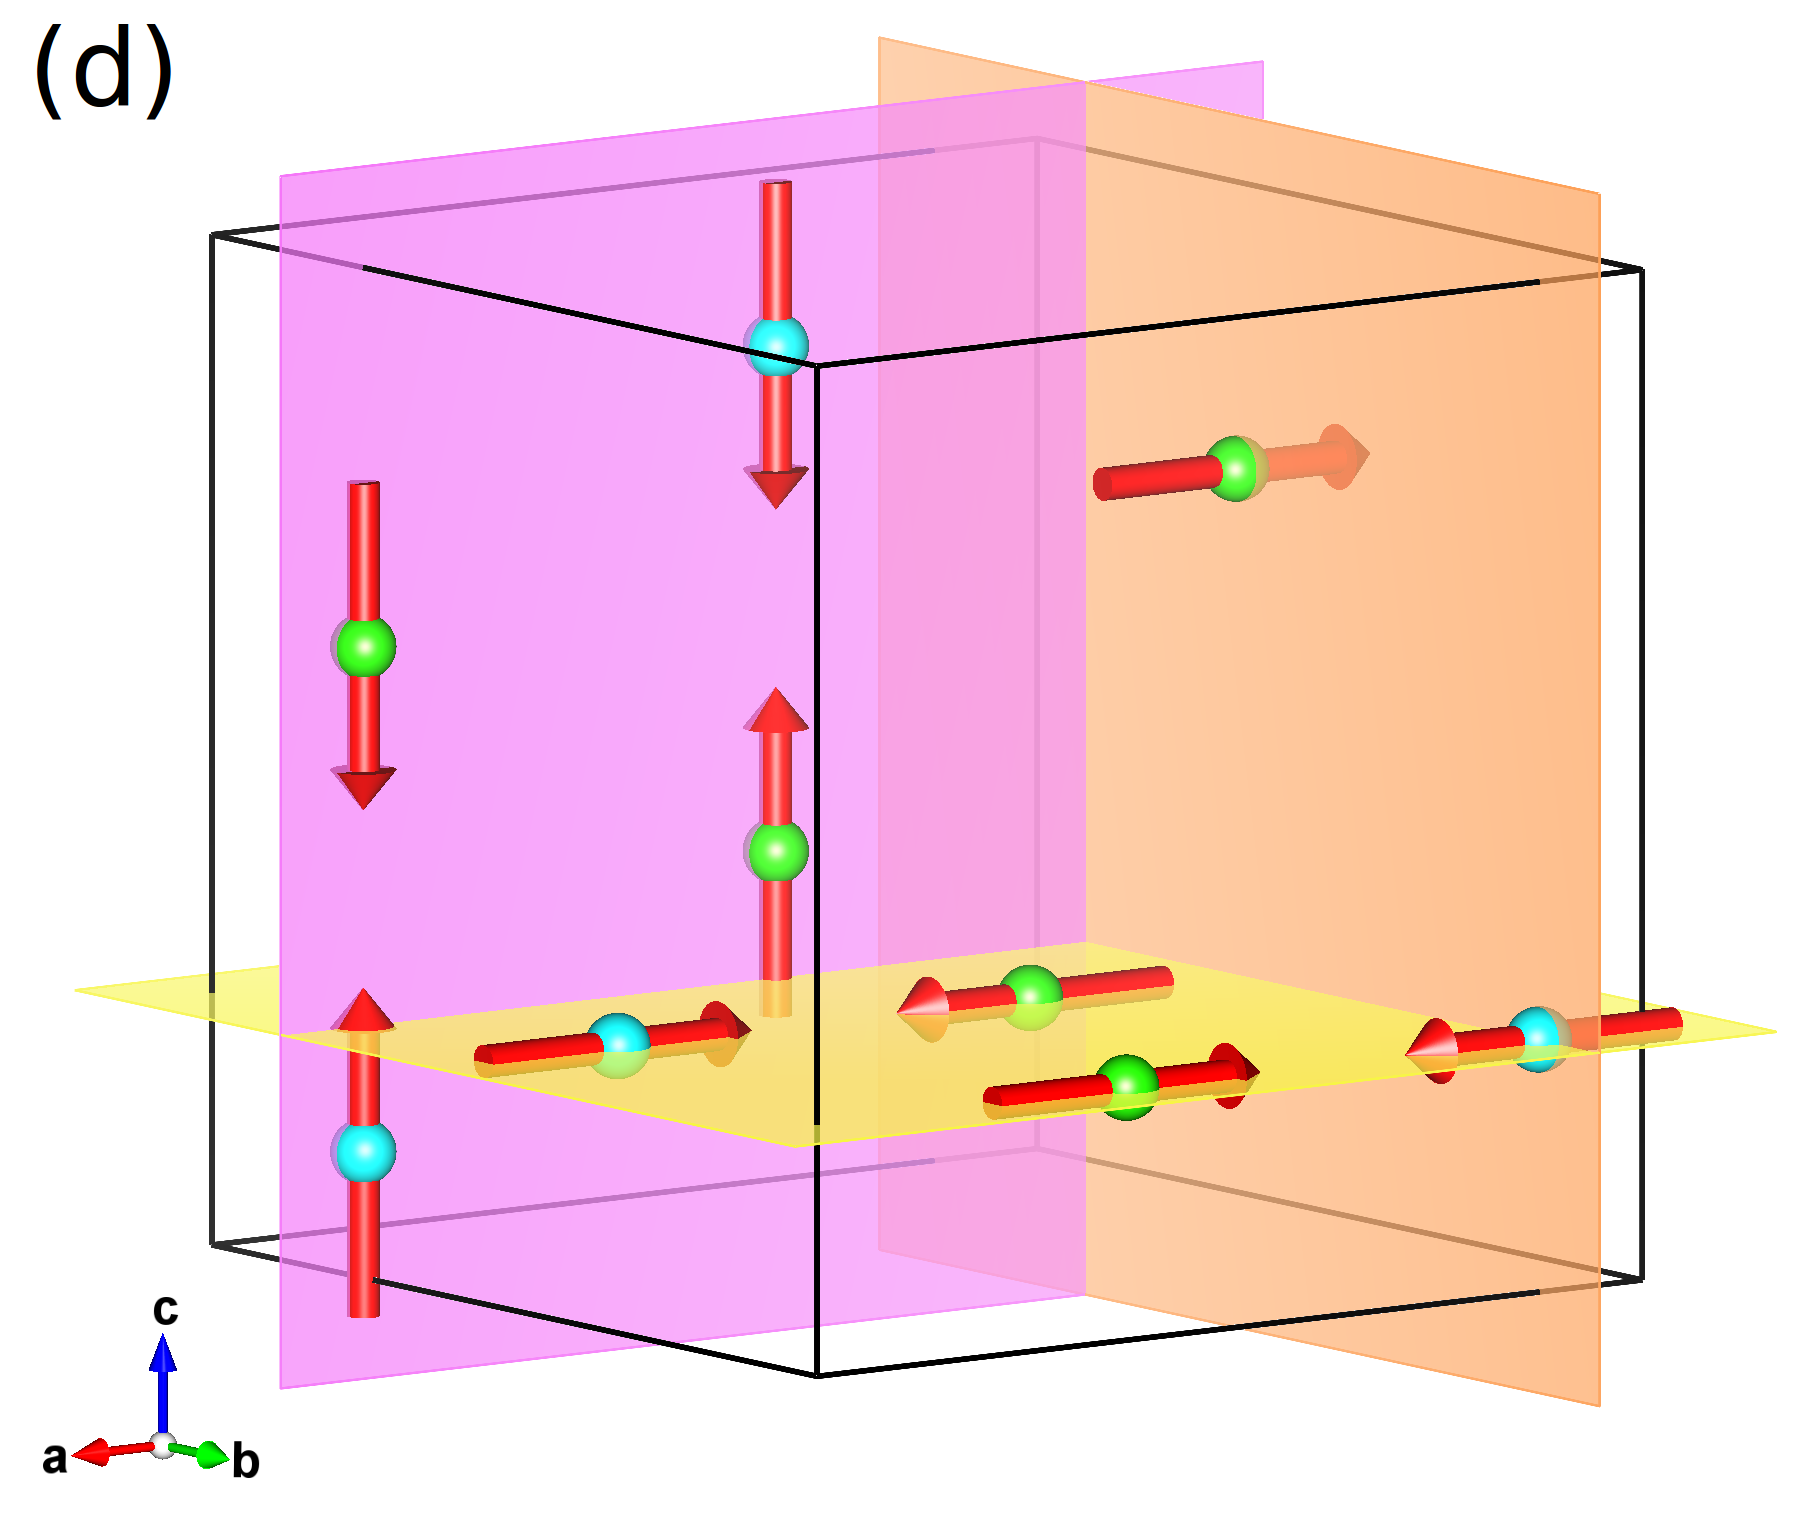
One of the three magnetic moments at the sites forming a single triangle in the half-garnet lattices points along each of the the crystal axes, so that they are mutually perpendicular. The selected at a particular site corresponds to a 2-fold axis of the point group (the other two of which point along perpendicular -type directions). The full magnetic structure consists of interpenetrating planes perpendicular to the crystal axes, populated with collinear magnetic moments. Co-planar triangles in the half-garnet network connected by the inversion center have identical spin configurations but both types of moments appear on each half-garnet lattice, making them individually antiferromagnetic. In total there are six sublattices hosting ions carrying moments pointing along one of the -type directions. Different visualisations of the structure are presented in Fig. 4.
III.2 Crystal electric fields in TGG
III.2.1 Inelastic Neutron Scattering Results
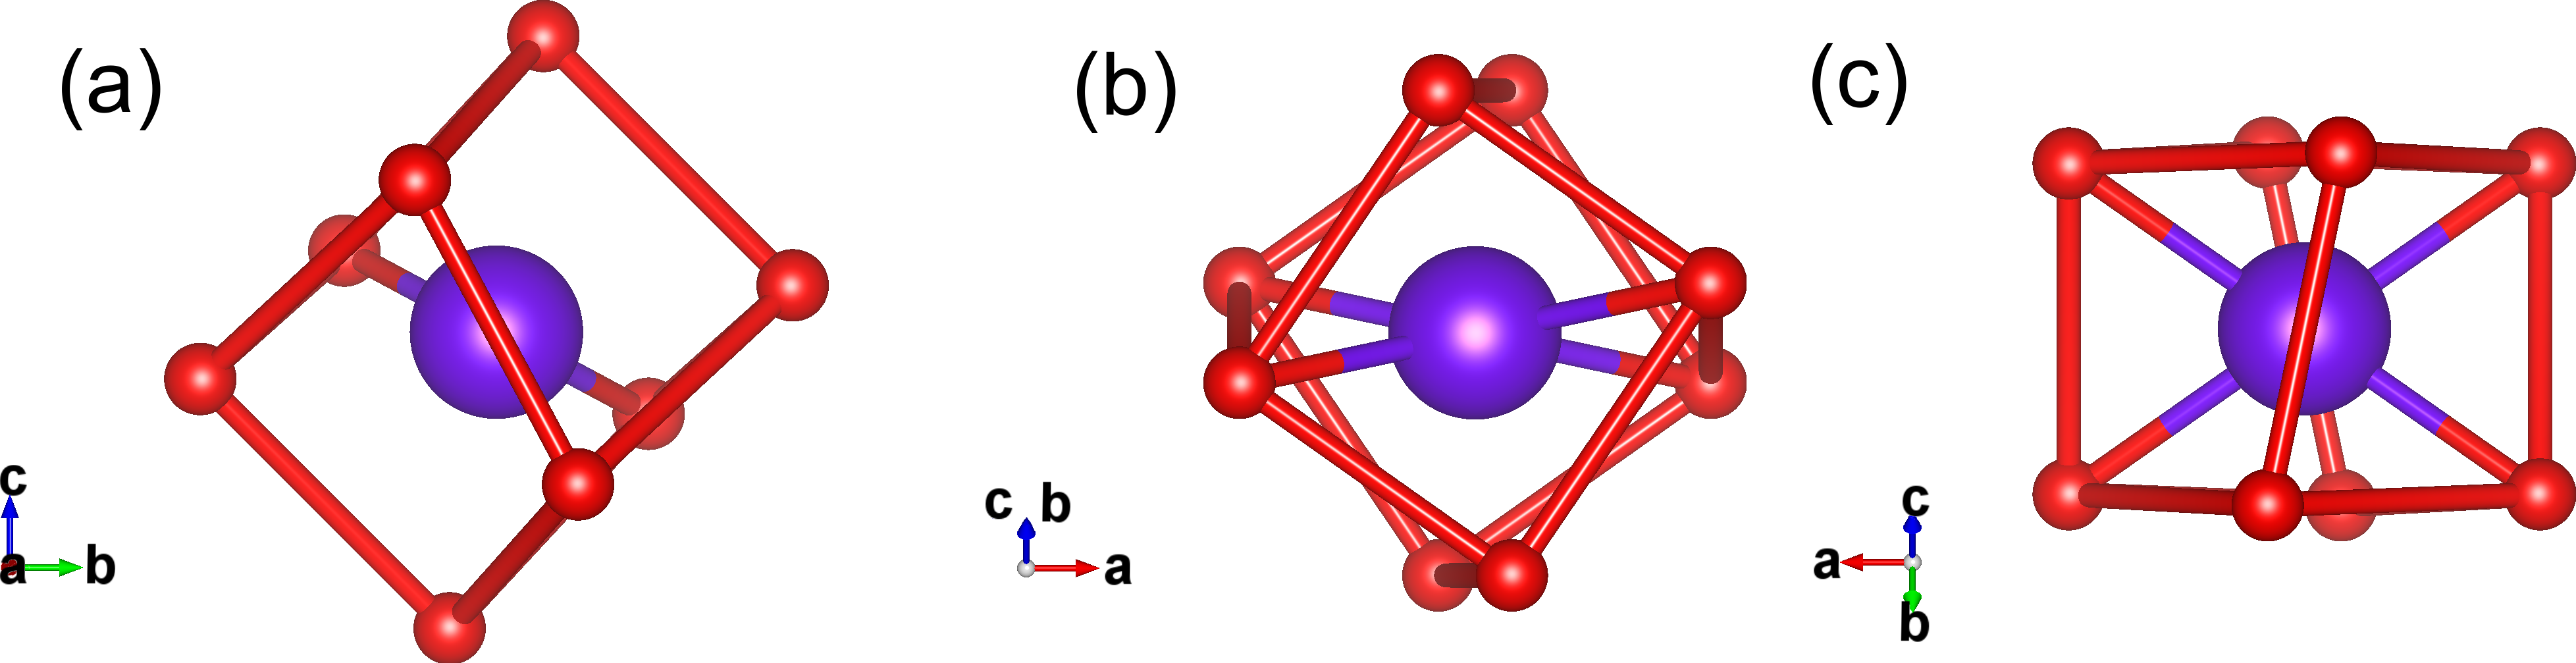
In TGG, each Tb3+ ion (at the Wyckoff positions) sits at the centre of a distorted cubic cage of eight oxygens, as illustrated in Fig. 5. The orthorhombic point-symmetry ( or ) predicts the complete lifting of the degeneracy, i.e. the ground-state () term splits into 13 singlets with the symmetry decomposition (, with , are the irreducible representations of the point-group). In our inelastic neutron scattering data we can identify eleven of the twelve transitions between the ground-state and excited states.
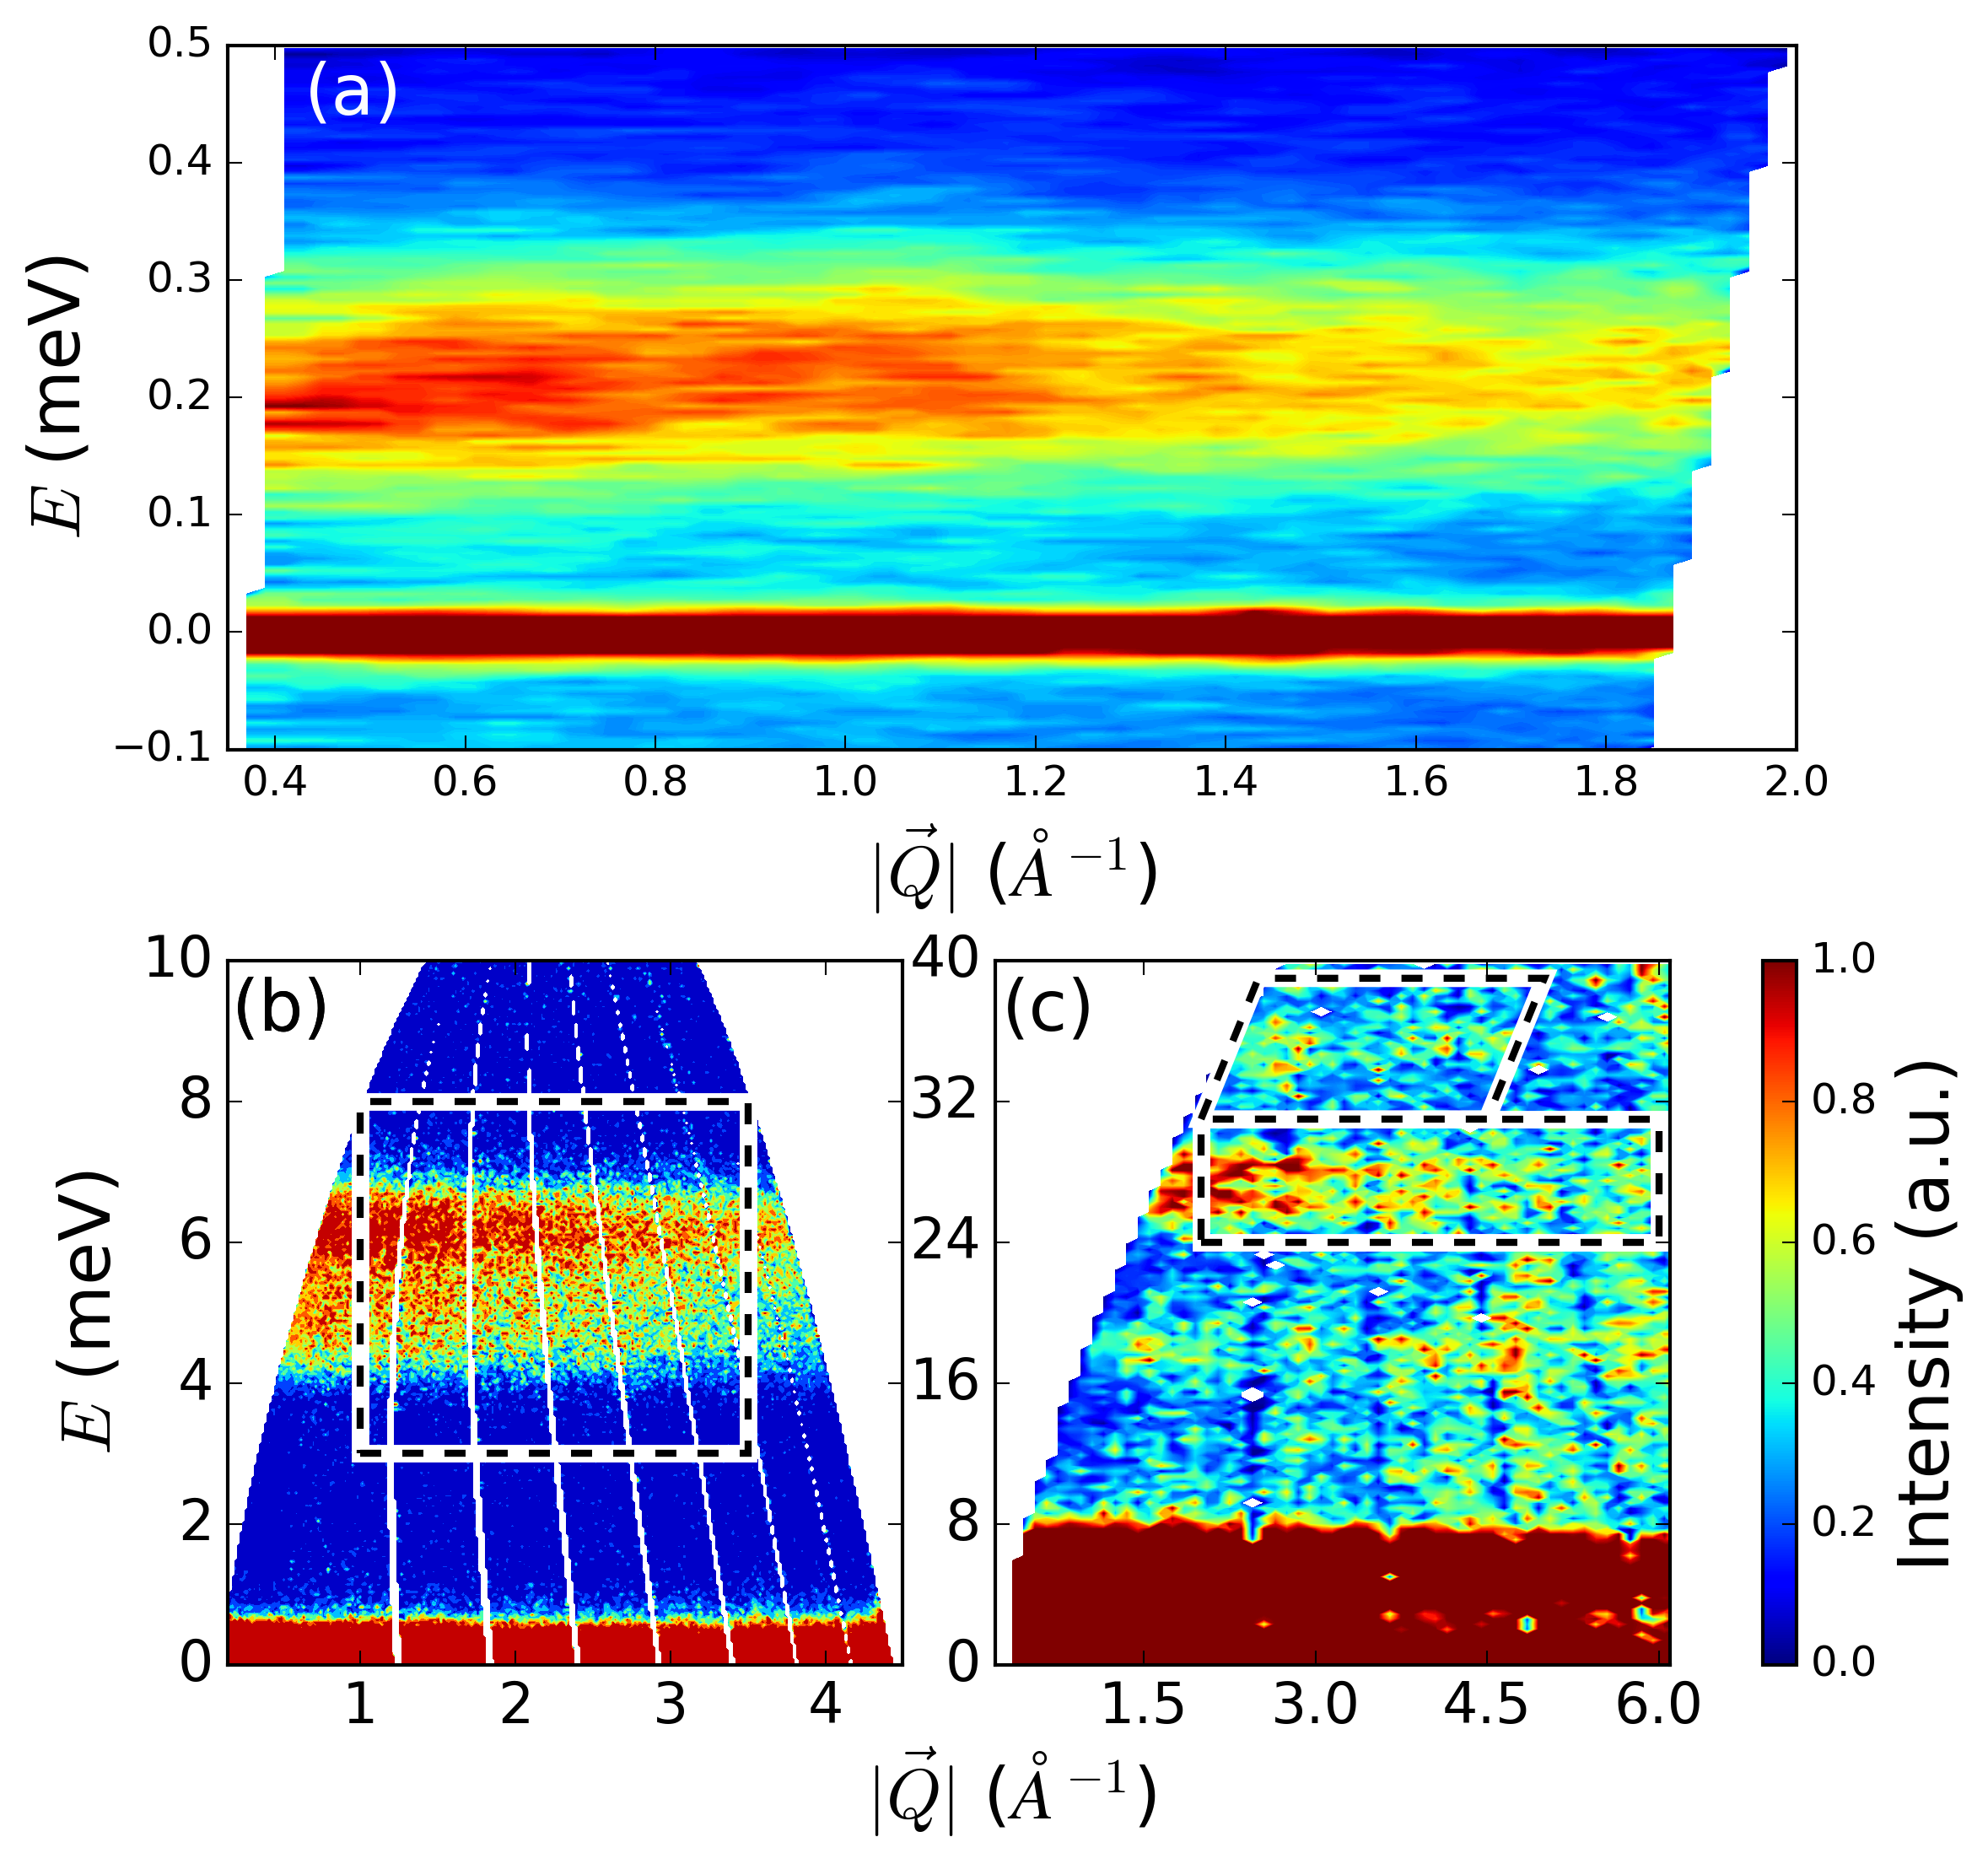
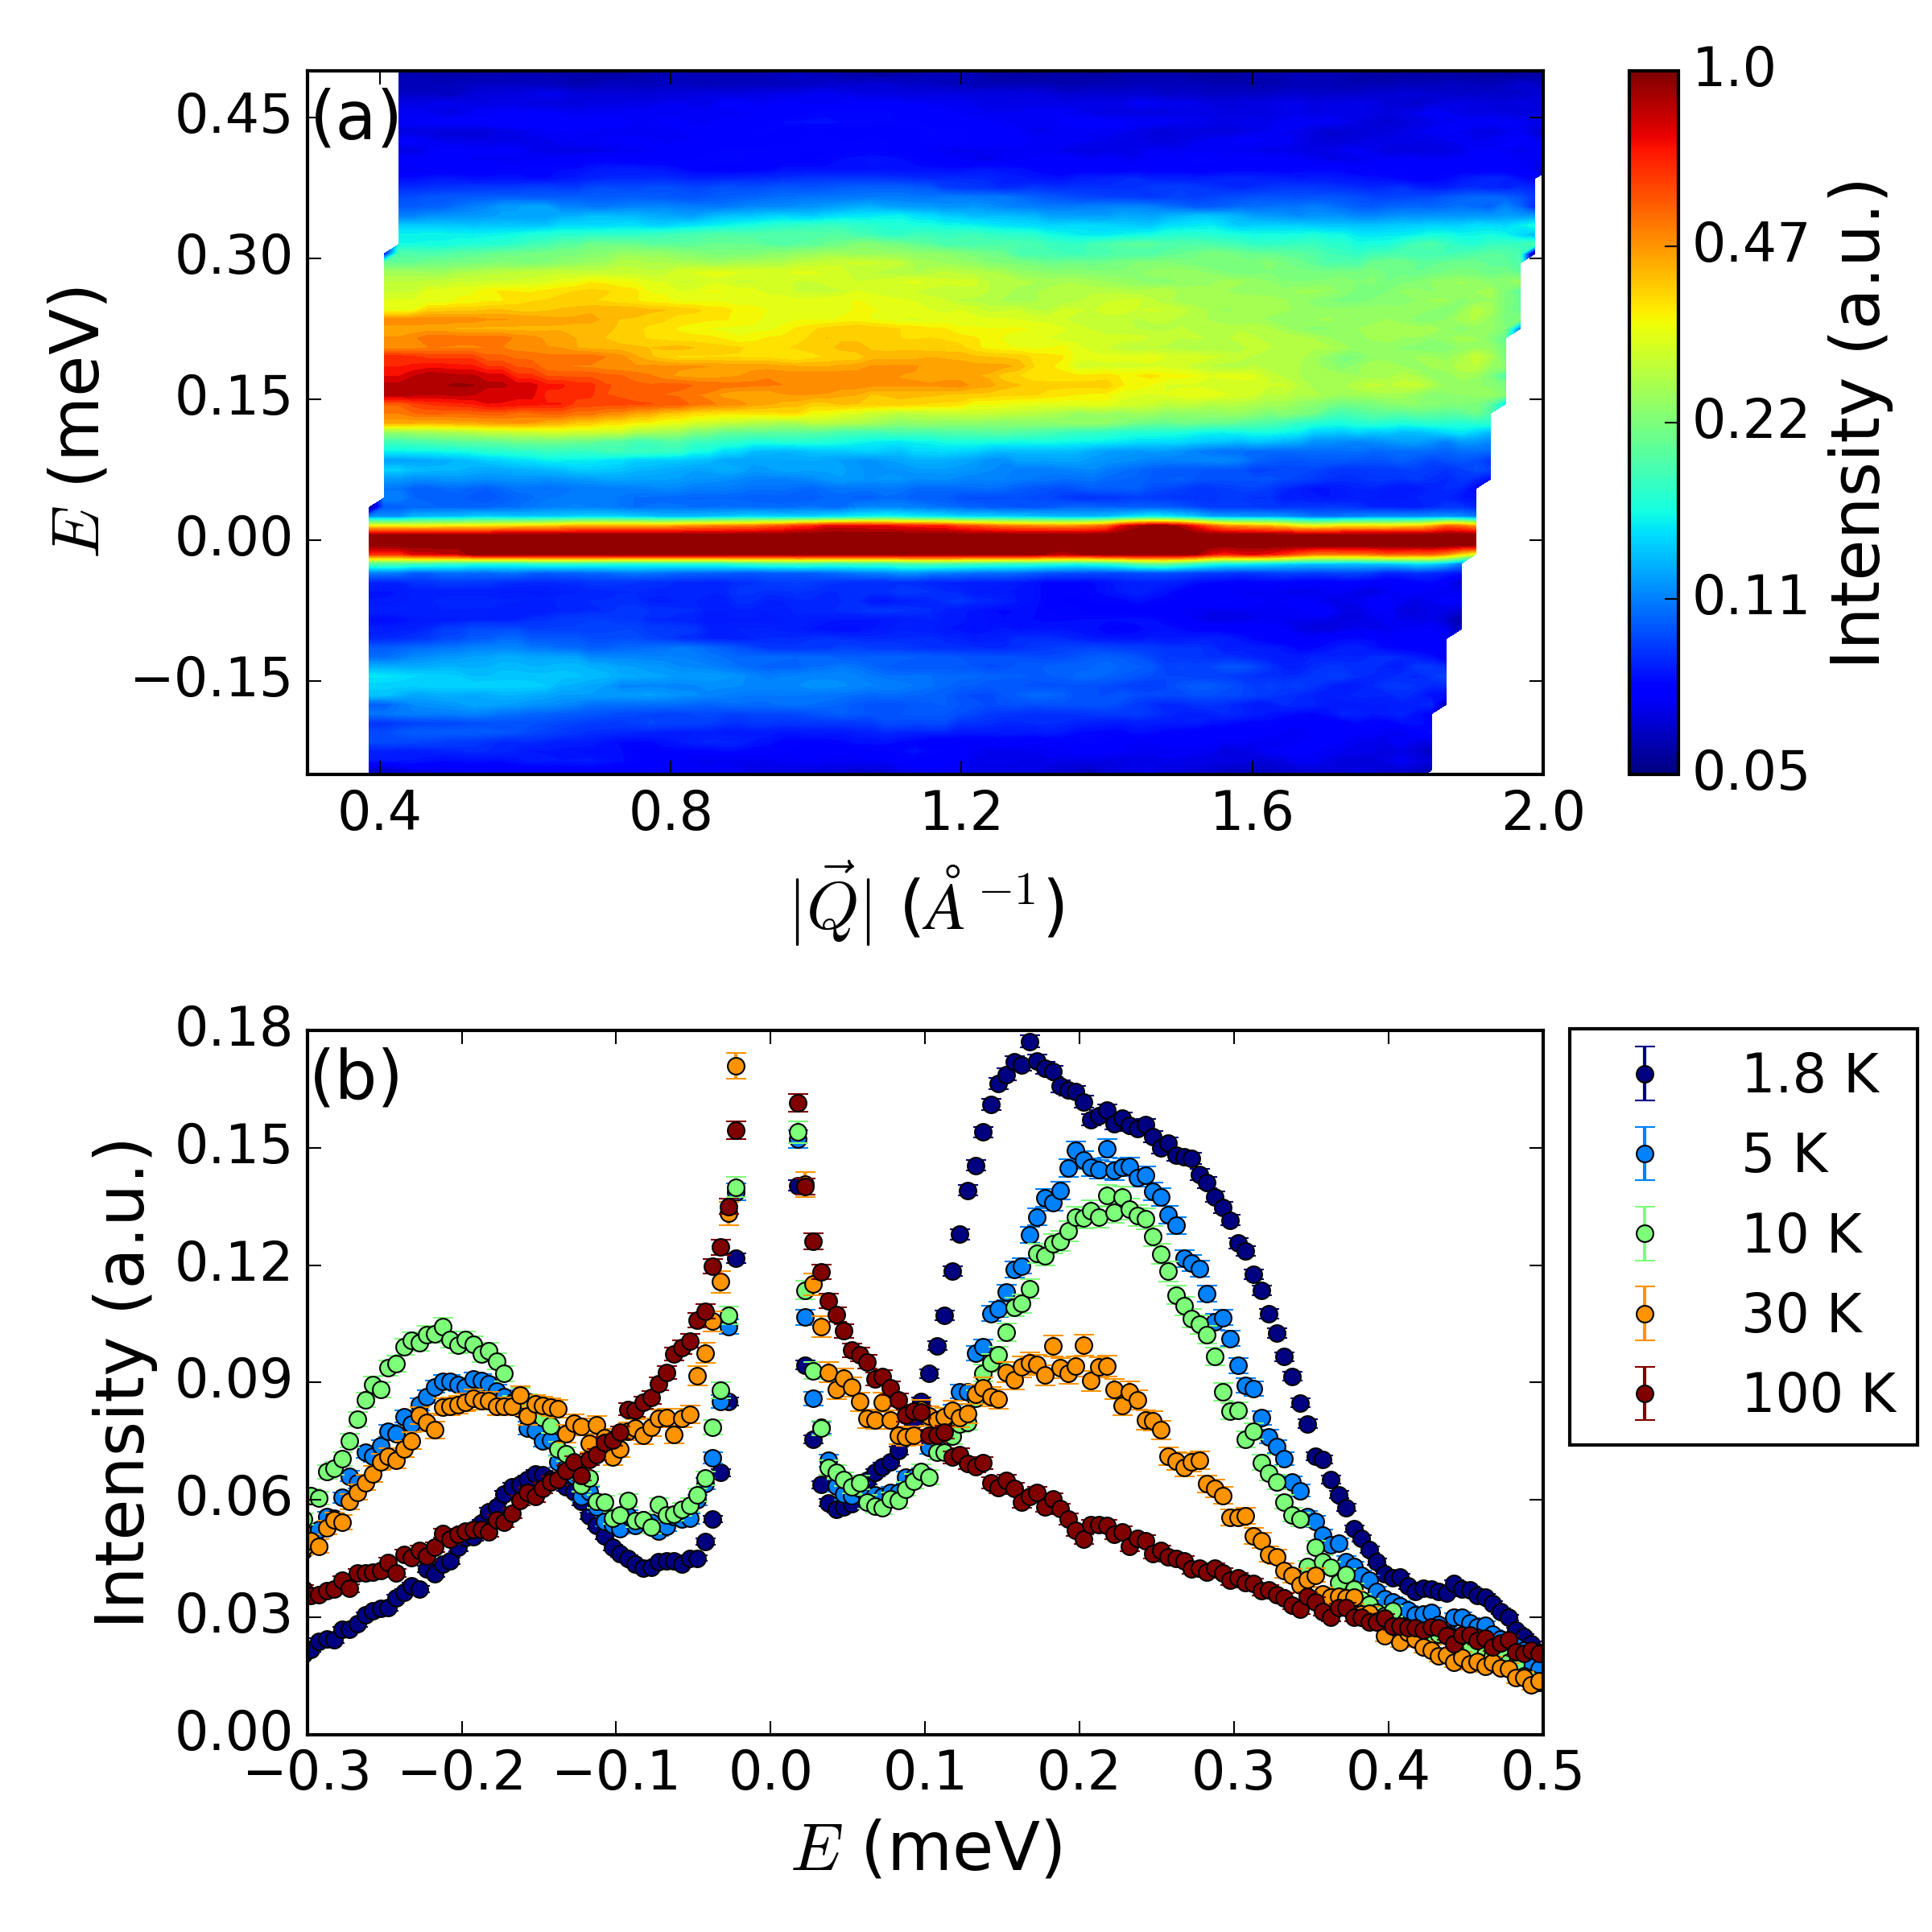
The single ion ground-state of TGG is suggested to be a quasidoublet Leask et al. (1994); Nandi et al. (2008). The low energy part of the spectrum was investigated using IRIS, and at K, a single excitation at meV can be seen (Fig. 6 (a)). However, it is much broader than the instrumental resolution and has a strongly temperature dependent line shape that we will discuss further below. The first group of crystal field levels above the quasidoublet appears at meV, but individual levels cannot be resolved using either MARI with the best available resolution, or IRIS. The next features in the neutron spectrum are much weaker: at meV there are two distinct peaks; a few meV above is another group at meV. An overview of all these features is shown in Fig. 6 (b) and (c).
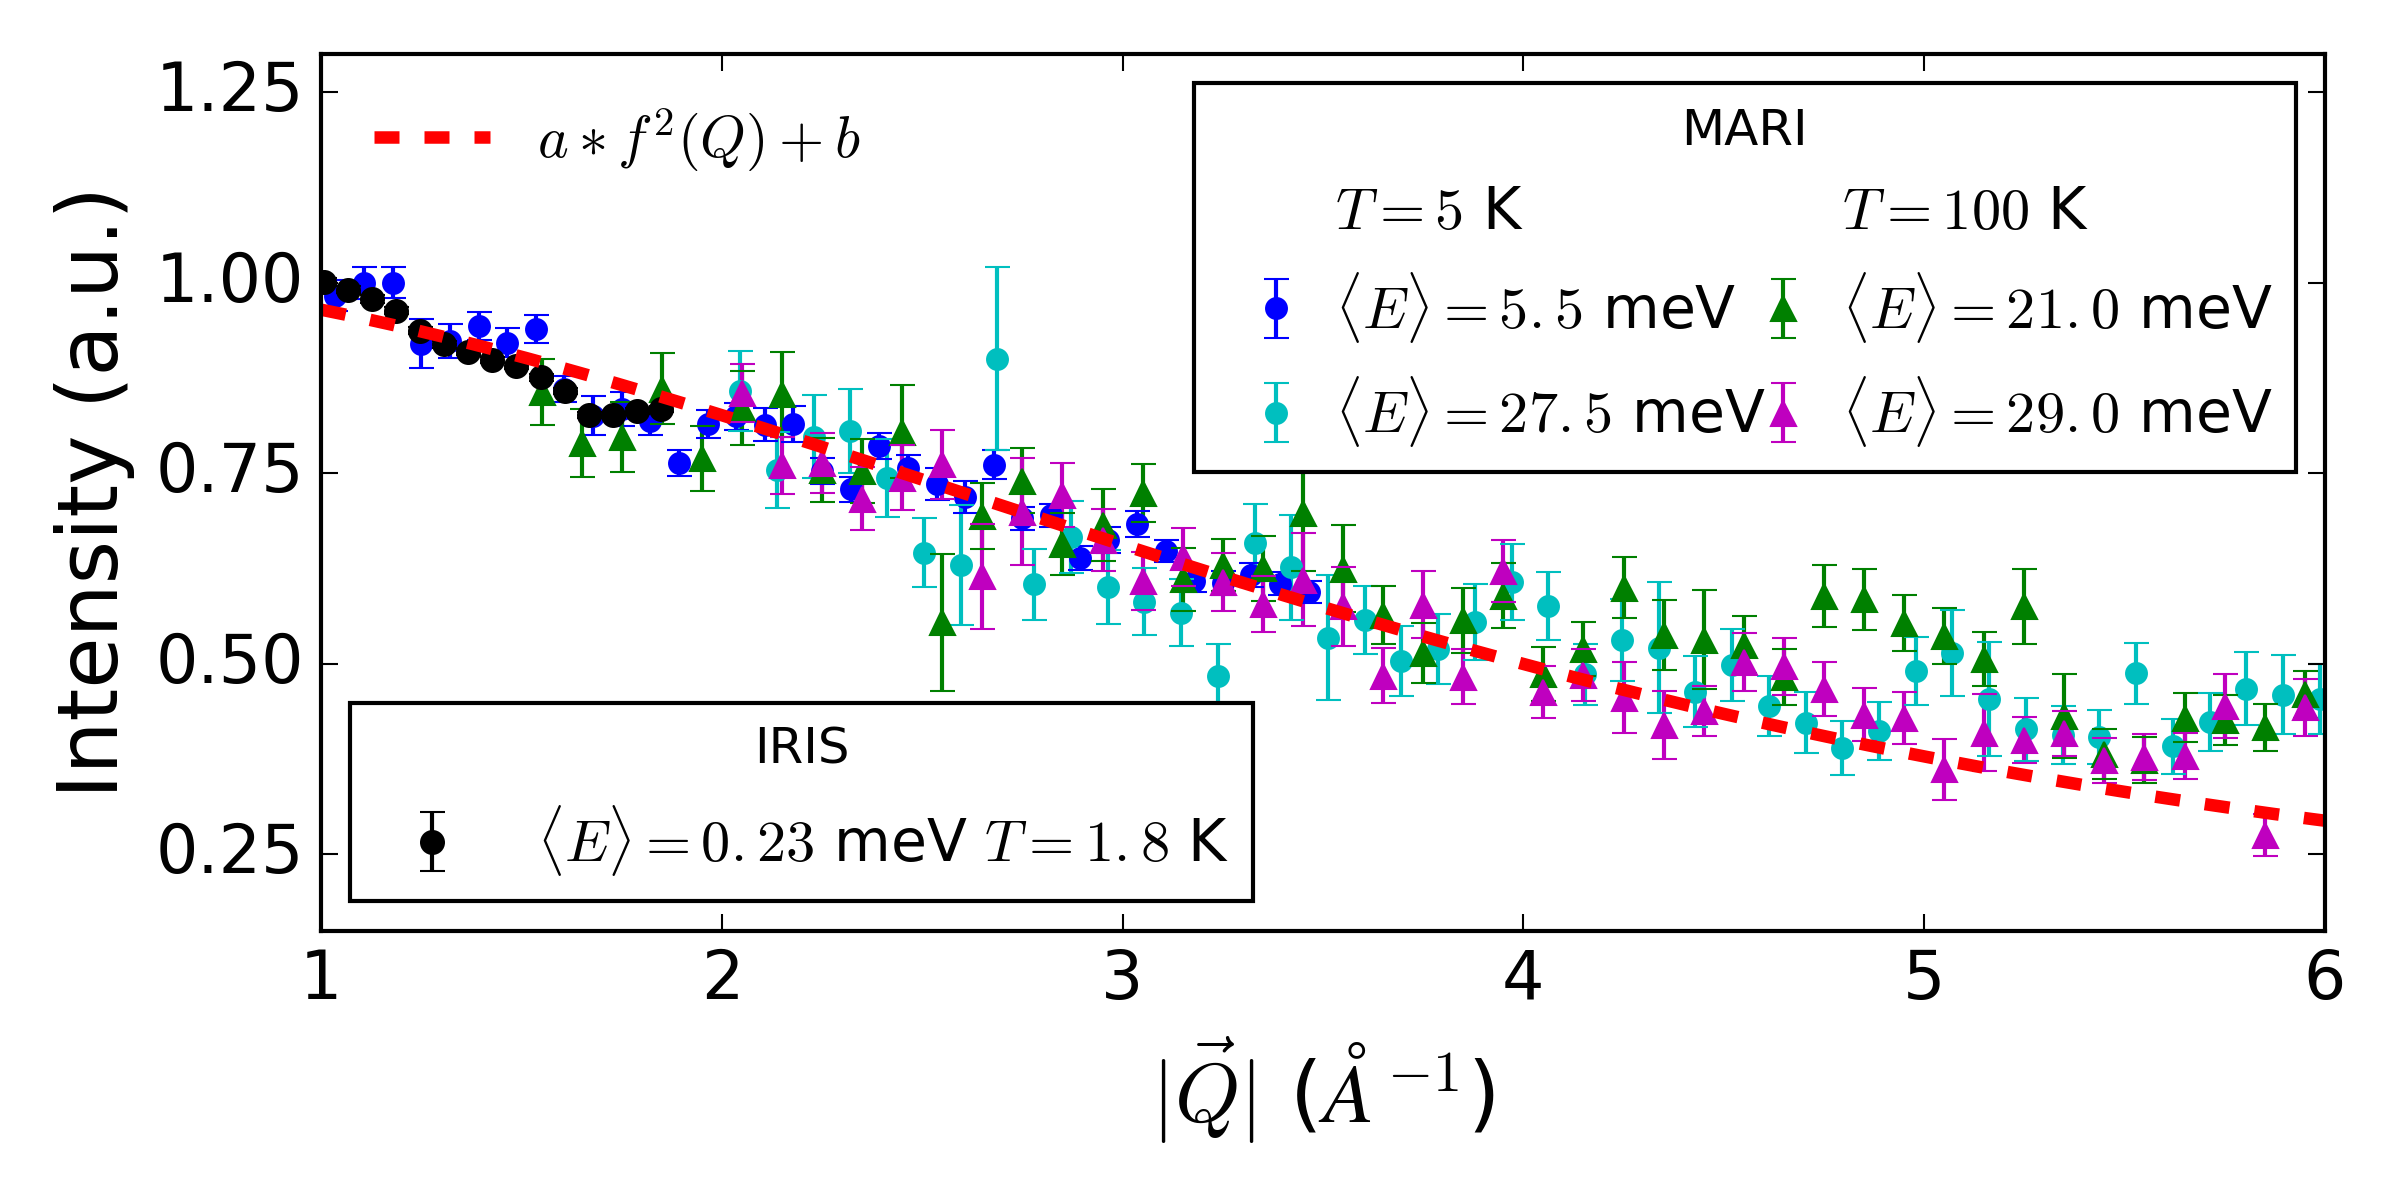
To ensure that all of the excitations we consider in our fitting are indeed crystal field excitations, their -dependence was analysed. The energy-integrated intensity of the quasidoublet and the first two groups above it (i.e. meV) closely follow the dipole magnetic form factor of Tb3+ ion Brown (2006), as shown in Fig. 7. Phonon contributions make the resemblance to the calculated form factor less good in the high- region of the data. Retrieving a similar dependence from the meV feature shown in Fig. 6(c) was not possible due to the presence of an optical phonon branch at meV, but excited state transitions to these levels that follow the magnetic form factor were observed in the high temperature spectra, confirming their CEF nature and energies. The excitation that can be seen at meV in Fig. 6(c) was found to follow the -dependence expected of a phonon branch.
To refine the parameters of the crystal field Hamiltonian, we require the energies of the crystal field excitations. Extracting these quantities is complicated when the separation of the excitations is close to the instrumental resolution, especially when the excitations are broadened beyond the resolution limit, and because of the close spacing of the two members of the quasidoublet. The energy difference of meV between the two states of the quasidoublet means both levels are similarly populated at K (), and contributions to the spectra by excitations from both levels could be comparable.
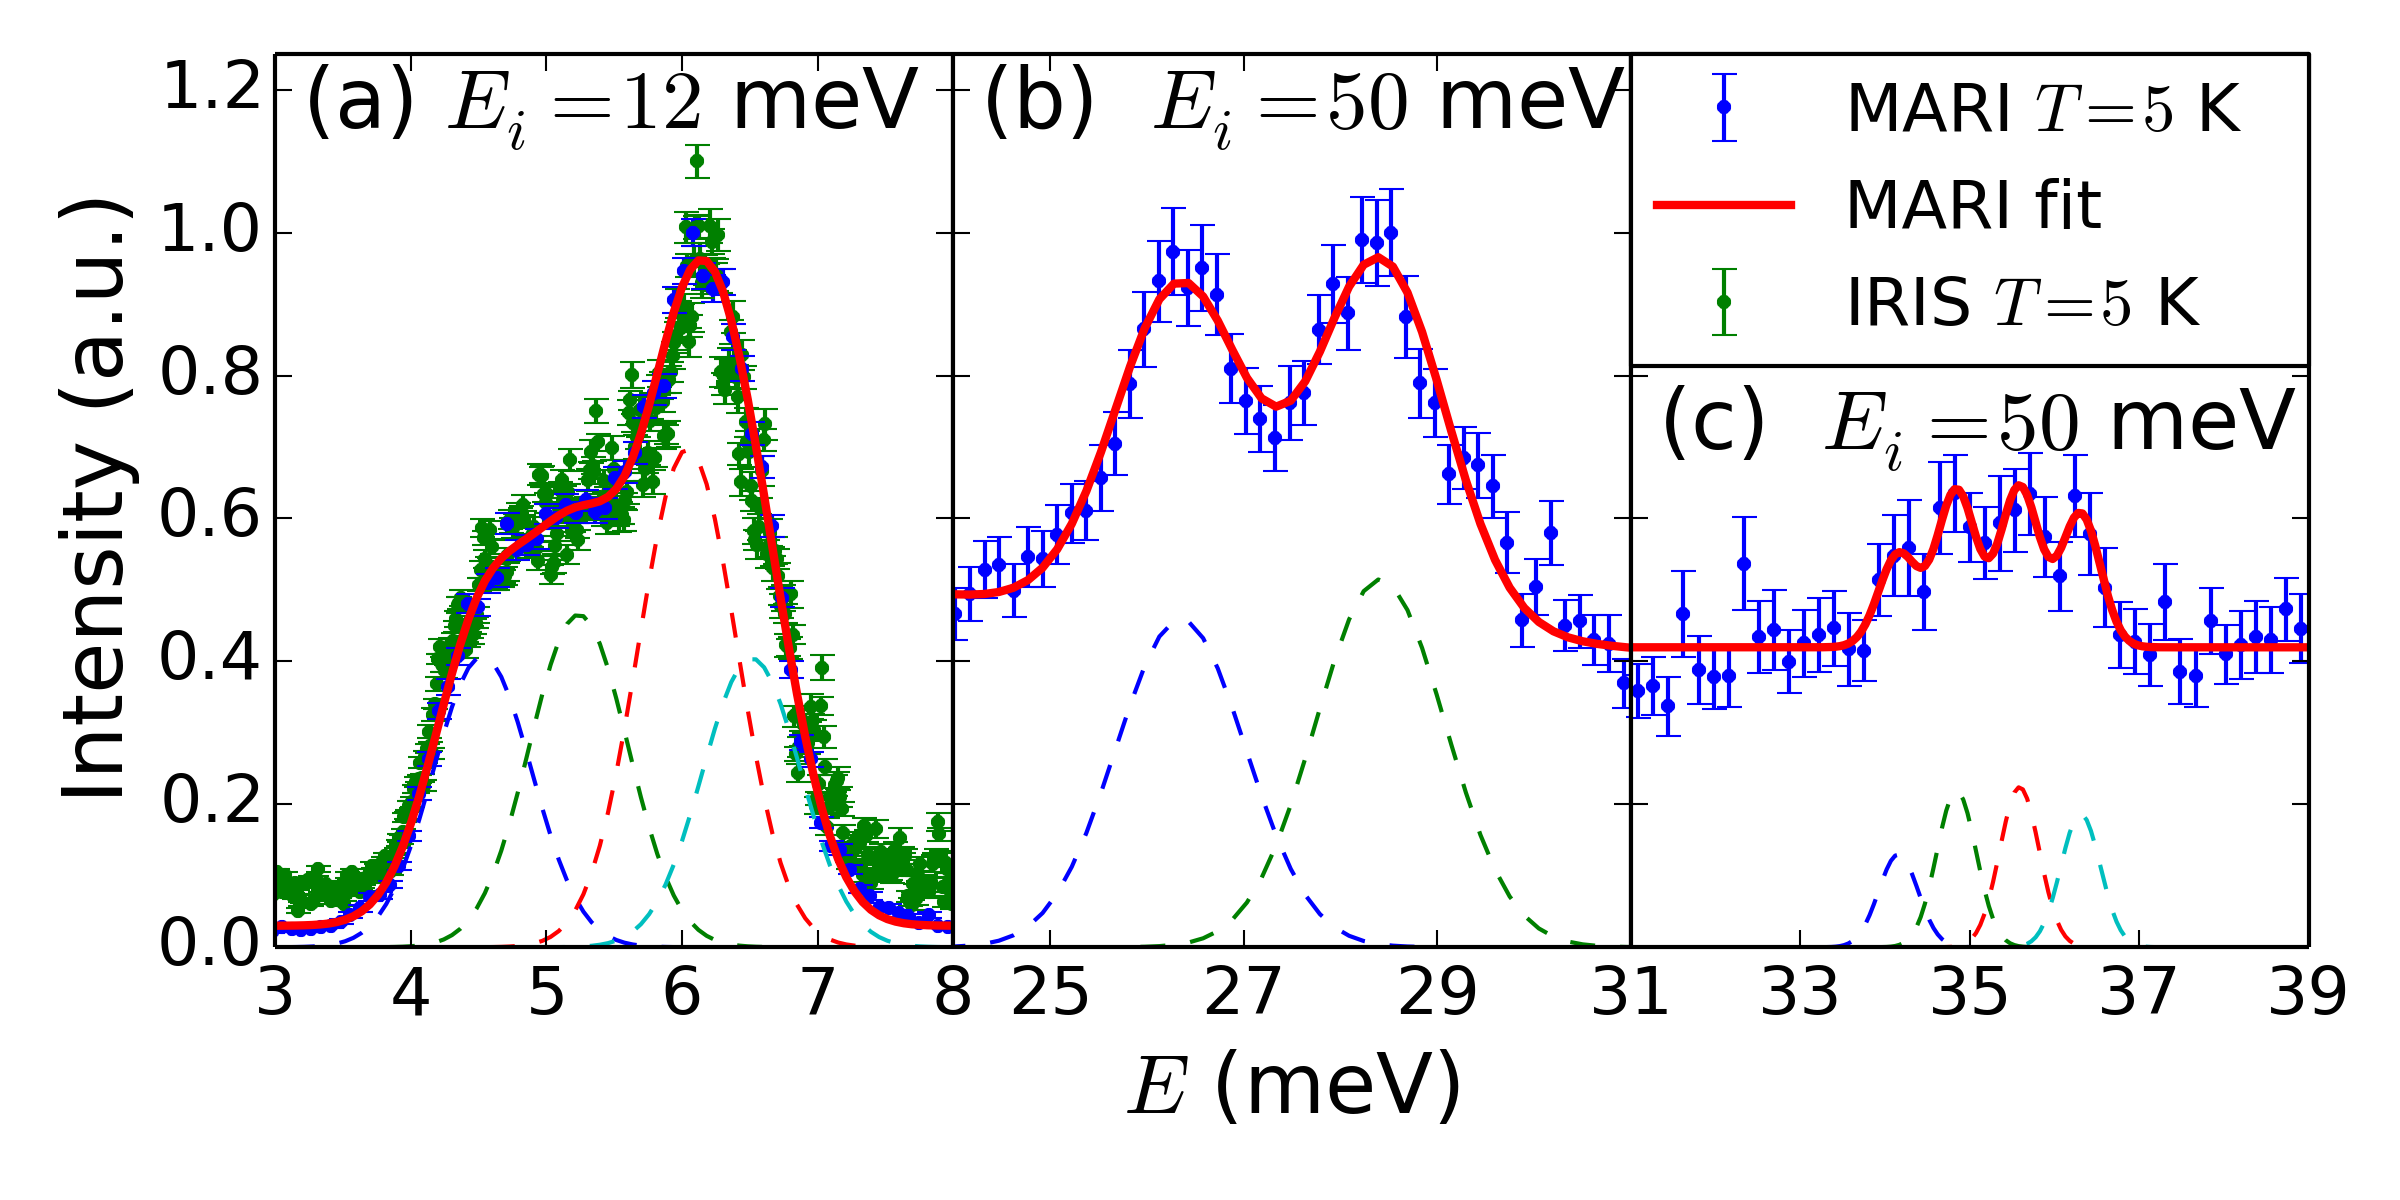
We integrated the data in ranges indicated in Fig. 6, using simple boxes for the levels at meV, and a parallelogram for the levels at meV. The resulting spectra are shown in Fig. 8. For the feature at meV (Fig. 8(a)), positions of single transition lines cannot be resolved using either spectrometer. Previous investigations of the TGG crystal field spectrum using Raman scattering Koningstein and Kane-Maguire (1974) identified this feature as containing 4 excitations from the ground-state. We therefore fitted 4 Gaussian peaks constrained to have a common width ( meV). A comparison between the reported transition energies Koningstein and Kane-Maguire (1974) and the values deduced from the fits is made in Table 2, and shows good agreement between both datasets. At meV (Fig. 8(b)) two distinct peaks are observed, with a separation well exceeding the splitting of the ground-state singlets, suggesting they are separate levels. Both peaks were fitted with Gaussian peaks ( meV). The group at meV (Fig. 8(c)) was fitted with four more Gaussians with meV, the minimum number of peaks required to obtain a good fit to this feature. We note that the widths of the measured features are considerably broader than the instrumental resolution, with the exception of the members of the group lying around meV.
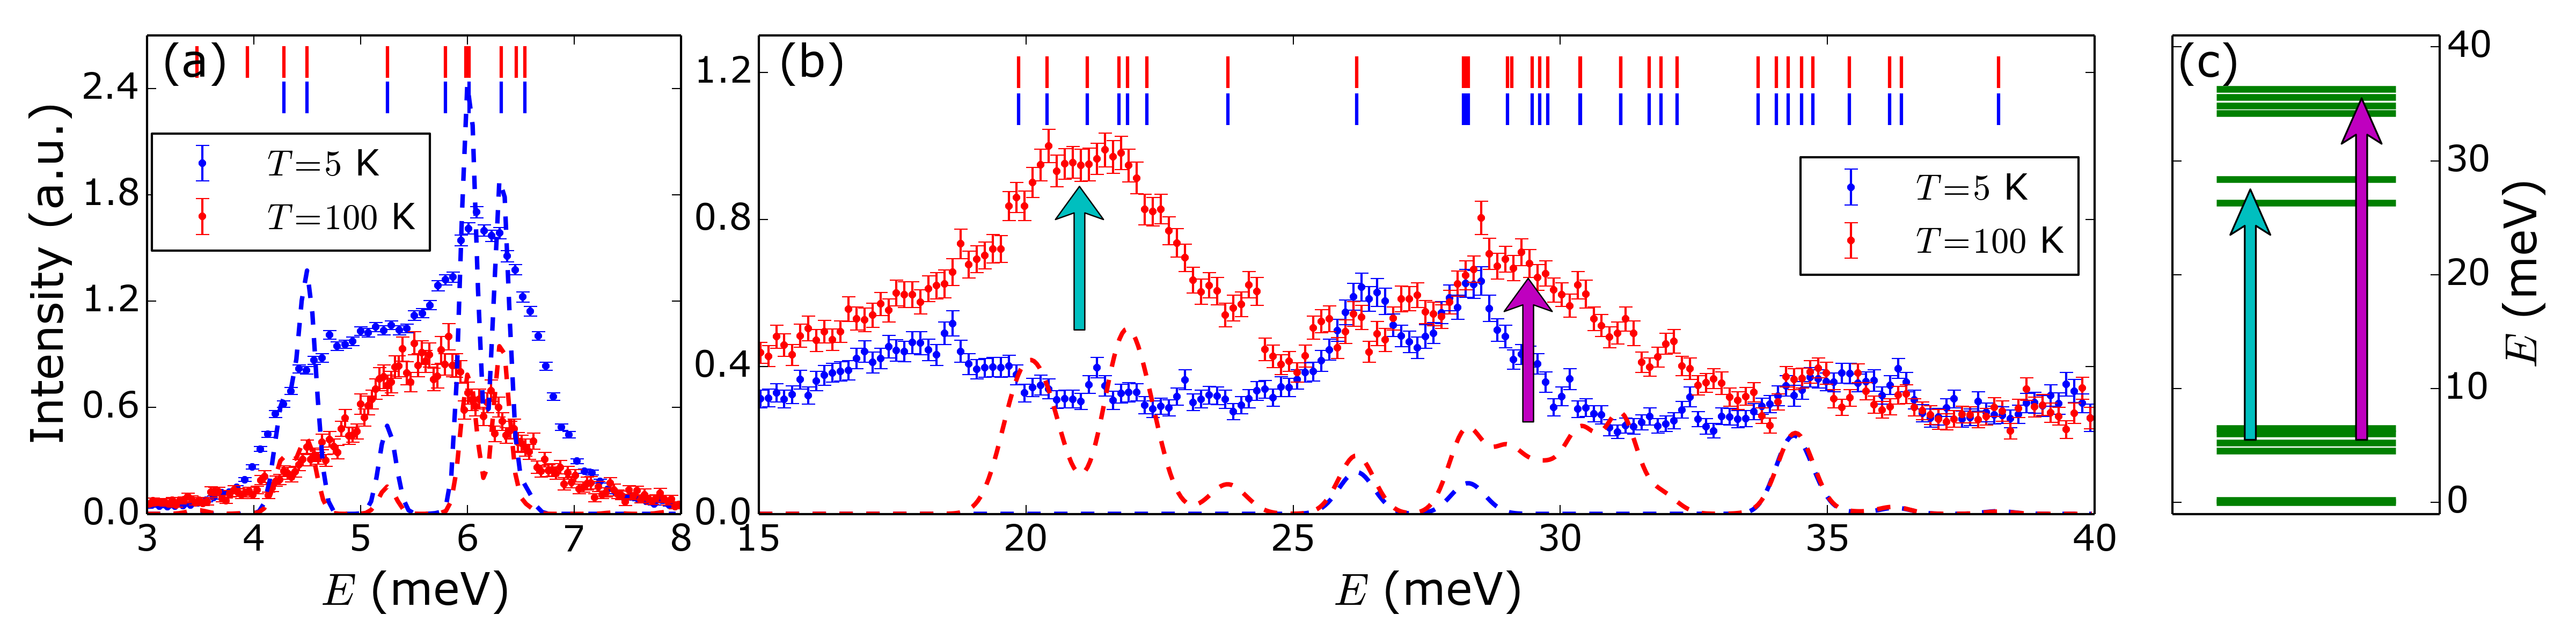
Changes in the measured spectra between K and K are shown in Fig. 9(a) and (b). The most striking difference is the appearance of strong intensities at meV, which follow the magnetic form factor of Tb3+ (Fig. 7), and can therefore be identified as transitions from thermally populated levels at meV (9(c)), consistent with the assignment of excitations at meV, whose form factor could not be verified, as a crystal field excitation.
| Koningstein and Kane-Maguire (1974) | Guillot and Marchand (1985) | ||
|---|---|---|---|
| - | 0.4 | 0.219(1) | 0.22 |
| 4.2 | 4.8 | 4.52(2) | 4.50 |
| 5.3 | 5.0 | 5.23(3) | 5.25 |
| 6.2 | 5.3 | 6.04(4) | 6.01 |
| 6.6 | 6.1 | 6.51(3) | 6.54 |
| - | 36.6 | 26.30(4) | 26.40 |
| - | 38.6 | 28.38(5) | 28.27 |
| - | 44.6 | 34.16(8) | 34.26 |
| - | 46.7 | 34.85(5) | 34.73 |
| - | 49.9 | 35.59(5) | 35.63 |
| - | 50.7 | 36.31(5) | 36.38 |
| - | 55.4 | - | 38.20 |
III.2.2 Crystal Electric Field Hamiltonian
The crystal-field Hamiltonian for point-group symmetry is given by
| (1) |
where are the (cosine) Stevens operators . The crystal-field coefficients can be found in standard literature about the Stevens’ equivalent method Hutchings et al. (1964); Abragam and Bleaney (1970); Jensen and Mackintosh (1991).
We can summarise the general expressions of the CEF eigenstates as
| (2) |
where all coefficients are real, and the are eigenstates of the operator. The generic states are labelled according to their irreducible representation , which we deduce by comparison with character tables.
Previous analyses of isostructural Tb3Al5O12 (TAG) have attempted to simplify the CEF scheme by retaining cubic or tetragonal symmetries (reducing the number of operators to 4 or 5 respectively), with the orthorhombic terms expected to produce only a small modification of the parameters. We find that such approaches cannot describe our experimental data, and so we use the orthorhombic Hamiltonian throughout the following. This is in contrast to other RE garnets (see for example Refs. [Gavignet-Tillard et al., 1973; Reid and Newman, 2000]) where the use of higher symmetries has been successful.
Refinement of the 9 crystal-field parameters of Eq. 1 was attempted with the use of the SPECTRE software Boothroyd (1990). The refined quantity was the transition energies (and not the intensities), retrieved from fitting to the INS spectra. Refinement of values previously published for TGG Guillot and Marchand (1985), from the results of Raman spectroscopy measurements of a small number of levels (see Table 2) and single crystal magnetisation, did not lead to satisfactory results. Several other sets of initial parameters were tested (Dy Crosswhite and Moos (1967), Er Orlich and H fner (1969), Eu Boal et al. (1973) and Nd Antic-Fidancev et al. (1986) gallium garnets scaled accordingly to the differences between radial momenta of RE3+ and Tb3+ ions, and parameters for Tb ions in YAG Morrison et al. (1976)). We have made attempts of refinement with sets of basis functions limited to the ground-state multiplet (-coupling), () states lying between and meV Bayerer et al. (1986) (intermediate coupling), and including all higher terms. Although good agreement between calculated and observed energies was found in the two latter cases (twofold reduction of goodness of fit parameter when going beyond coupling and without any further improvement when expanding the basis more), a proper convergence of this multi-parameter refinement was not achieved. The previously listed initial sets of parameters together with some of the best final sets refined with SPECTRE were introduced into a custom least-squares fitting routine refining the eigenvalues of the Stevens Hamiltonian (Eq. 1) (i.e. restricted to -coupling). The algorithm reached convergence and the results ranged from good to excellent agreement with the measured values. The optimal solution was chosen by investigating the neutron spectra calculated using the refined parameters and comparing them with INS data (Fig. 9) and the set giving the closet distribution of calculated intensities with respect to the observed one was chosen (based on the result of the initial EuGG refinement with SPECTRE). This result was also characterised by the best value of the goodness of fit parameter . The contributions to the wavefunctions in the basis in Table 5 is given in Appendix B.
| Parameter | Ref. [Guillot and Marchand, 1985] (meV) | This work (meV) |
|---|---|---|
The neutron scattering intensities calculated within the dipole approximation using refined CEF parameters for K and K are plotted along with experimental results in Fig. 9(a) and (b). The calculated positions of the excitations are in good agreement with measured intensities. The shapes of the features at higher energies are reasonably reproduced by the calculations. In addition, the almost non-existent scattering intensity calculated for the transition between the ground-state and the highest state of the lowest multiplet is consistent with it not being observed in the experimental data.
When compared with previous determinations of the crystal field parameters, i.e. Ref. [Guillot and Marchand, 1985] (see Table 3), we find reasonable agreement between most parts of the Stevens parameters, but there are differences in the size and sign, particularly for the highest order parameters. As can be seen in Table 2, rather few of the levels were previously determined experimentally, with the results that the parameters are not very accurate. Indeed, when the full level scheme is calculated using the parameters of Ref. [Guillot and Marchand, 1985], we can see that the higher levels are predicted at much higher energies than we observe them (see Table 2 for comparison).
Nonetheless, these previously determined parameters and eigenfunctions could be used successfully to reproduce a step-like magnetisation curve measured on a single crystal sample at K Guillot and Marchand (1985). However, all of the parameter sets obtained in the course of our refinements give a similar structure of the wavefunctions. They also describe the magnetisation step, which is a rather generic feature present for similar compositions of the quasidoublet eigenstates, and one of the levels at meV. The significant contribution from high- states to this higher level causes, due to the Zeeman term, its rapid descent in field towards the energies of the quasidoublet states leading to increase in its thermal population and contribution to the overall magnetisation. By comparison of the quasidoublet wavefunctions obtained from our parameter set to the one obtained from the parameter set in Ref. [Guillot and Marchand, 1985], we find that the symmetry character and , of the ground singlet, , and the first-excited one, , are swapped. More explicitly, and in this work [Tab. 5 in Appendix B], whereas in Ref. [Guillot and Marchand, 1985] we have and . The order of the states was found to play an important role in obtaining a good reproduction of the transition intensities in INS.
On the other hand, at meV, there is a strong discrepancy between the calculated and observed line widths, which are much larger than the instrumental resolution. Furthermore, although a single transition between the members of the quasidoublet can be seen at meV at K (though the peak is again much broader than the instrumental resolution), the lowest energy part of the spectrum displays a very strong temperature dependence. At the lowest measured temperature K the map of this part of the spectrum [Fig. 10(a)] suggests that the single excitation is replaced by a band of dispersive excitons. A clearly visible contribution of two or more peaks to the first transition has developed, as shown in Fig. 10. On the high energy tail of the main peak is another weak peak at meV that develops with the same temperature dependence as the multi peak structure of the main excitation. A shoulder can be distinguished in the quasidoublet gap at K, which suggests another peak. This observation, along with the large widths of other excitations (i.e. with meV) , suggests interactions between Tb3+ ions, or coupling with lattice excitations modifies the excitation spectrum beyond a single-ion picture.
III.3 Magnetisation
The magnetic susceptibility is presented in Fig. 11(a). Above K it can be fitted by a Curie-Weiss law with K (hence the frustration parameter ). By means of , we extracted as paramagnetic moment per Tb3+ ion over the range K. Such value differs by only 2% from , the theoretical paramagnetic moment per Tb3+ ion in the ground multiplet Jensen and Mackintosh (1991). Calculation of the susceptibility using the refined crystal-field parameters (Tab. 3) gives excellent agreement with the experimental data.

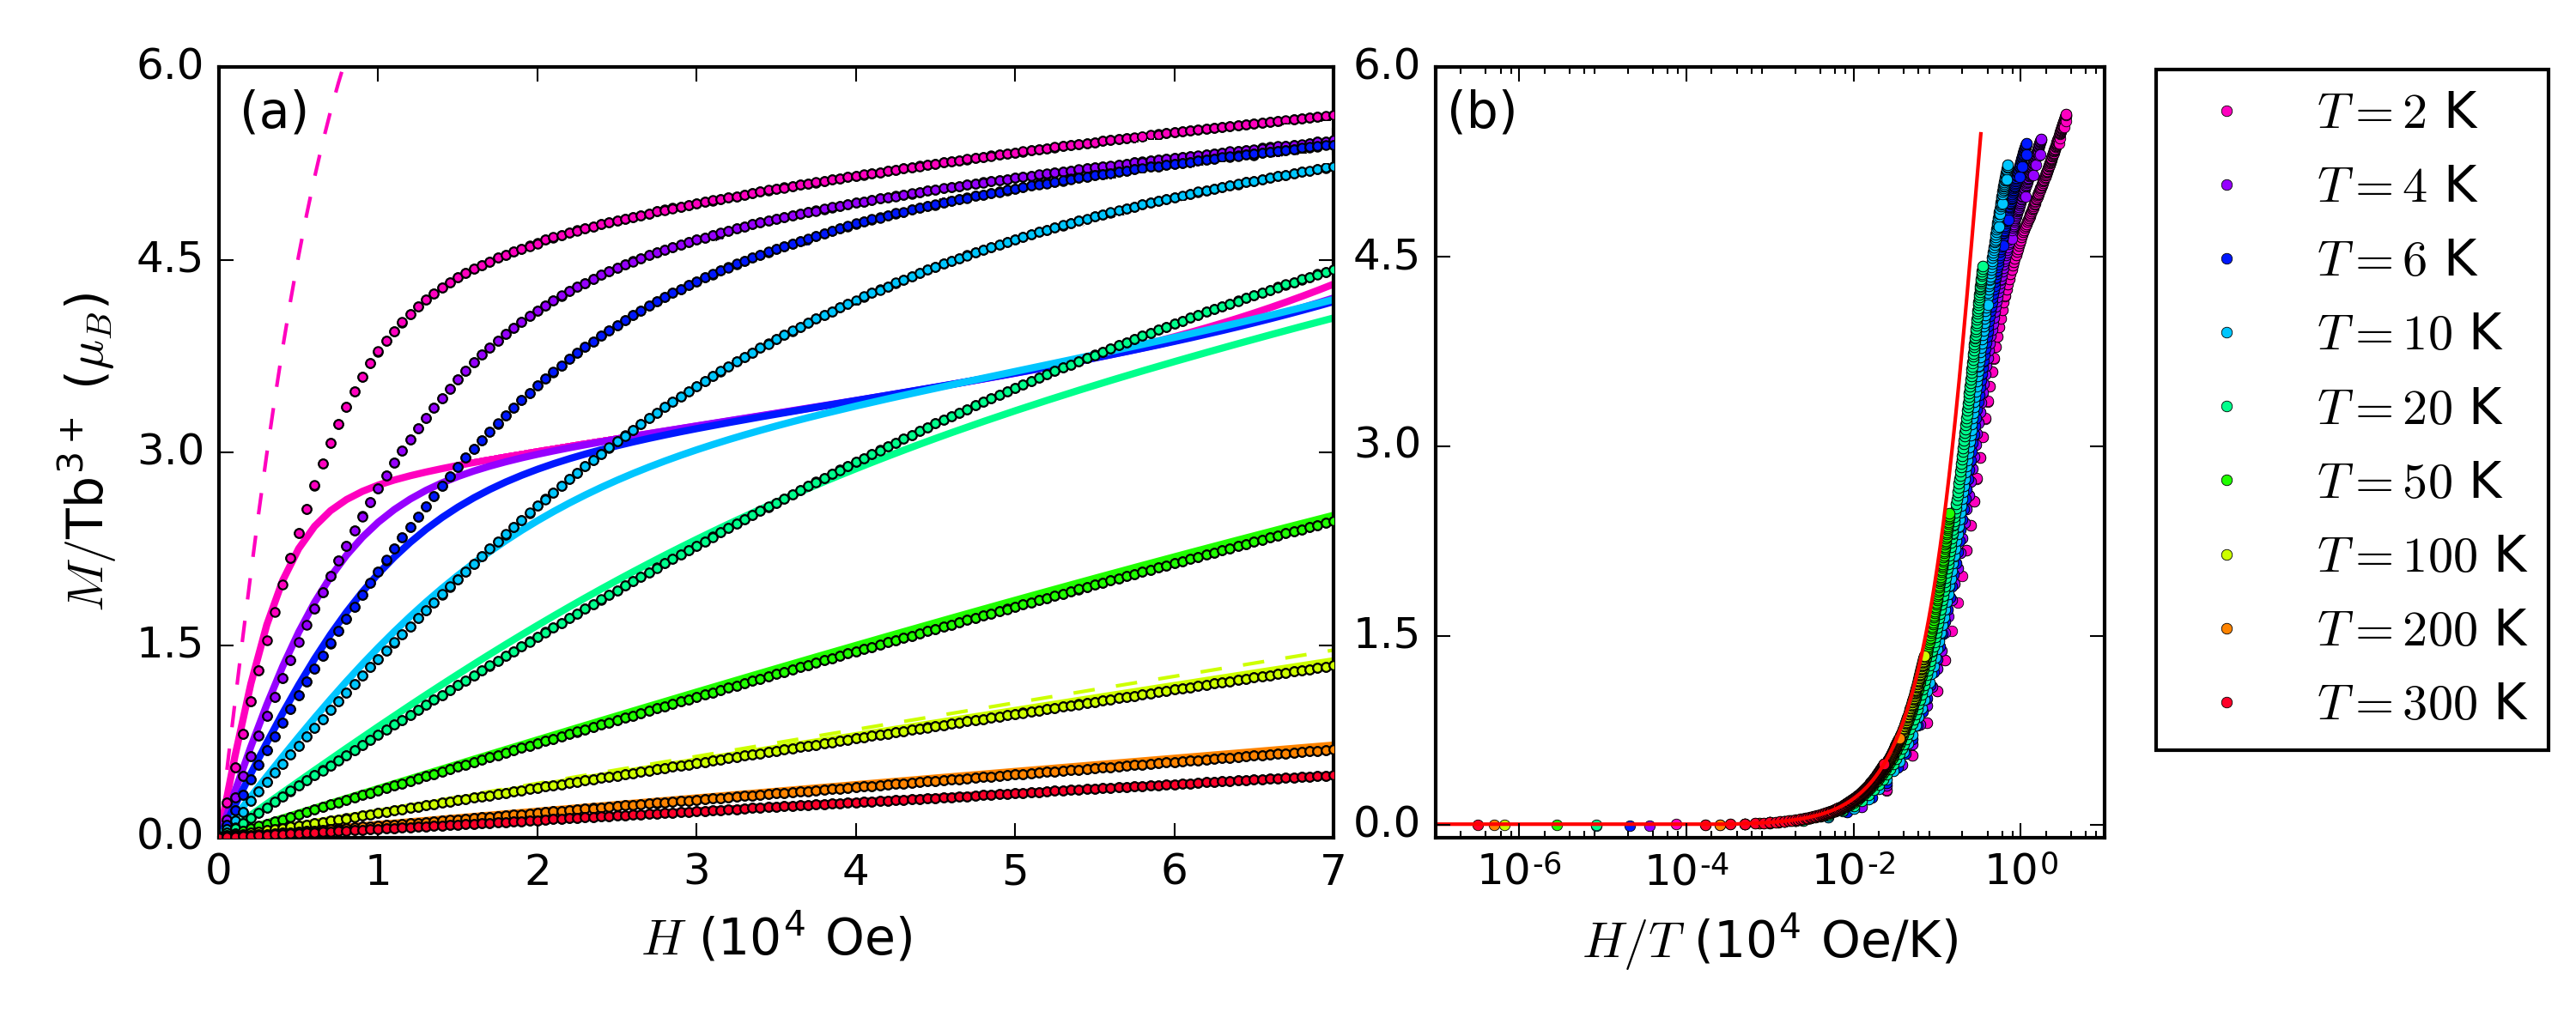
The magnetisation per Tb3+ ion as a function of applied field, , for different temperatures, and in terms of the ratio is plotted in Fig. 12(a) and 12(b), respectively. Solid lines in panel (a), show the result of calculations using the refined CEF parameters (Tab. 3), which are in good agreement with the data down to 20 K. Below this temperature, the calculated results deviate strongly from the experimental data. Similarly, the collapse of the curves that is expected for paramagnetic spins, can be observed down to 50 K. For K deviation from this scaling, coinciding with the departure of the susceptibility from the Curie-Weiss law, becomes increasingly pronounced (inset of Fig. 11(a)). These behaviours are consistent with the onset of a correlated cooperative paramagnetic phase. Our measured susceptibility and magnetisation agree well with another recent report Mukherjee et al. (2017).
IV Discussion
We have investigated the crystal and magnetic structures of TGG, together with the crystal field Hamiltonian for its single-ion physics. These are all relevant for its low temperature physics and magnetothermal effects.
Firstly, the crystal structure of our samples is close to the ideal garnet structure, but there are superstoichiometric terbium ions (Tb2). These Tb3+ ions in excess act as defects which enhance the scattering of phonons and cause the lowering of the thermal conductivity Inyushkin and Taldenkov (2007). For this reason, in Czochralski-grown crystals, where their abundance goes up to %, they are considered responsible for the manifestation of the thermal Hall effect Inyushkin and Taldenkov (2010). Such concurrence – Czochralski-grown crystals have the highest percentage of Tb2 defects and lowest diagonal thermal conductivity – motivated the theoretical work of Ref. [Mori et al., 2014], in which Mori et al. posit that the resonant skew-scattering of phonons from the CEF states of superstoichiometric Tb3+ ions is the origin of the thermal Hall effect. In this theory two assumptions are crucial: (i) the Tb2 ions are somewhat correlated in space, (ii) the CEF splitting of their lowest levels (labelled as in Ref. [Mori et al., 2014]) is comparable with , the CEF gap for the quasidoublet states, , of the regular Tb sites.
Our study provides insights to this theory, from both structural and single-ion perspectives. We detect superstoichiometric terbium ions only on the 16a (Ga1) Wyckoff position, where their concentration is 1.6 %. The importance of this observation is that the position has a symmetry, which is higher than the and symmetries, respectively for the (Tb) and (Ga2) sites (see Tab. 1). For , 5 singlets and 4 doublets are expected in symmetry, and the assumption that the crystal field scheme at this site will be generally similar to that at the main terbium site is to be examined carefully. Results from point charge calculations (which include the 6 nearest oxygen ions) suggest a similar structure of the quasidoublet ground state with 4 symmetry-allowed doublets lying at energies higher than meV. However, one has to keep in mind the limited reliability of this method. Regarding the spatial correlations of Tb2 ions and their crystal field scheme, direct experimental probing is hindered by the low percentage of superstoichiometric abundance in TGG.
The low-temperature magnetic structure of TGG that we have observed is a multiaxial antiferromagnet composed of magnetic moments that have non-collinear local anisotropy axes. Any singlet , from the CEF spectrum of the Tb3+ ion in TGG, is characterised by ( are the angular momentum operators), a consequence of the complete removal of the degeneracy of the free ion states by the crystal field Griffith (1963); Abragam and Bleaney (1970). The magnetic moments found in the ordered phase of TGG must therefore be induced by perturbations which couple or mix the CEF ground singlet with higher CEF eigenstates, i.e. an induced moment system. Usually this mixing is achieved by the exchange interactions, but a curious feature of the magnetic structure is that it nullifies the nearest neighbor Heisenberg terms , since the spin expectation values of induced moments are expected to be orthogonal (see below Eq. (4)). Our measurements of the magnetic susceptibility and magnetization suggest nonetheless that antiferromagnetic correlations build up below K, far above the magnetic ordering temperature. One may well ask how this combination of anisotropy, frustration, and magnetic order arises.
An insightful general argument about anisotropies in non-Kramers systems was given by Griffith in Refs. [Griffith, 1963], and it concerns instances where an even number of low-lying singlets is well isolated from higher excited states. In the simplest case of two low-lying singlets it was shown that the axial anisotropy of the magnetic moment is determined by their time-reversal (TR) behaviour, i.e. the local Ising axis of a non-Kramers ion is independent of the direction of the applied field (provided this is only of perturbative order Not (b)).
As already pointed out in Ref. [Bidaux et al., 1973], this is of interest for the quasidoublet states () of the CEF in similar garnets and, in order to understand and possibly predict which of the three two-fold axes of the CEF-symmetry is the anisotropy axis for the magnetic moment, we follow Ref. [Griffith, 1963] and investigate the matrix elements and their behaviour under TR transformation.
The action of the time-reversal operator on angular momentum states is given by Abragam and Bleaney (1970). Then the time-reversal of the CEF states in Eq. (2) reads
| (3) |
Calculating the matrix elements , by means of the general expansions in Eq. (2), reveals the correspondence
| (4) |
between the symmetry of the states and the direction of , being the (“off-diagonal”, ) components of the (induced) magnetic moment in TGG. From Eq.(2-4), we deduce that off-diagonal matrix elements predict a magnetic moment pointing along the local axes depending on the -decomposition and time-reversal (TR) properties of the two states of the quasidoublet. More specifically we find the induced moment along if have different basis decomposition (one with -even and the other with -odd) and different TR behaviour (one even the other odd), along if they have different basis decomposition but same TR transformation, and along if they have same basis decomposition but opposite TR transformation.
Diagonalisation of the crystal-field Hamiltonian in Eq. (1) with the parameters listed in Tab. 3 leads to a spectrum where the lowest singlet and the first excited one are, respectively, of the and type in Eq. (2) (see also Tab. 5), , according to Eq. (4), and as observed in the magnetic structure. We find indeed that , identically, and so the low-temperature induced magnetic moment will be proportional to (see Appendix A for the different in TGG).
The magnetic structure of TGG that we have determined is identical to that found previously Hammann and Ocio (1975), and to that found in various other rare earth garnets, including Dy3Al5O12 (DAG). In the case of DAG, Wolf and collaborators showed that this magnetic structure minimises the dipolar interactions for magnetic moments with Ising anisotropy and overall constraint of cubic symmetryBall et al. (1963), and this was subsequently confirmed by the application of the Luttinger-Tisza method Felsteiner and Misra (1981). In analogy with these RE-garnets, it is typical also in TGG to ascribe the ordered structure predominantly to dipolar interactions.
In the theoretical description of the ordering transition in TGG of Ref. [Hamman and Manneville, 1973], Hammann and Manneville also concluded that the dipolar interaction is of primary importance, but found that the observed ordering temperature was too high to be accounted for only by induced moment ordering mediated by dipolar interactions Hamman and Manneville (1973). They therefore showed that a molecular field theory taking into account also the role of hyperfine coupling, together with the dipolar interactions, would provide a reasonable estimate of K with respect to K, and implying the possibility of cooperative electronic and nuclear spin order. This theory was constrained by various experimental parameters of the time, which can now be examined more accurately.
Our study confirms directly the value of the (ground state) quasidoublet gap, and it suggests a time-reversal analysis of the direction of the local easy axes (among the three equivalent ones permitted by the crystalline point symmetry). The afore-mentioned “off-diagonal” matrix element , is a crucial quantity which relates to the coefficient in Ref. [Hamman and Manneville, 1973] via , and therefore controls the key parameters for the mean-field theory presented therein (see Tab. 4). It is worth emphasising that our estimation ( ) is given by the wave functions, , of the ground-state quasidoublet obtained via exact diagonalisation of the Hamiltonian in Eq. (1), i.e. crystal-field analysis of the neutron scattering data. In contrast, the estimation by Hammann and Manneville () relies on a self-consistent fit to magnetisation curves measured at different temperatures on a single crystal sample with magnetic field applied along the direction Not (c).
| Ref. [Hamman and Manneville, 1973] | This work | |
|---|---|---|
| 6.7 | 7.9 | |
| 0.08 | 0.11 |
Our direct estimation of opens up a possible route to understand coherently the behaviour of the magnetic moment across different temperature regimes. In a forthcoming theoretical work we will study how the local states () of the Tb3+ ions are the starting point for the definition of the new magnetic basis () which carries information about the admixture induced by the presence of the (molecular) field on one hand and of the thermal population of states on the other. (A similar reasoning was considered in Refs. [Bidaux et al., 1973] and [Hamman and Manneville, 1973], but actual local symmetries of the RE3+ ions were disregarded as an element of interest.) This route can resolve the puzzle reported in Ref. [Hammann and Ocio, 1975], where neutron powder diffraction showed that full saturation of the magnetic moment was still not achieved down to 0.2 (at such temperatures where is treated as the saturated magnetic moment per ion). In addition, this is expected to be the natural starting point to investigate which mechanism among others – to mention a few, competing interactions, fragmentation, fluctuations (outside of the neutron spectroscopy window) – act as leading term in the reduction of the magnetic moment.
Following the perspective of Ref. [Hamman and Manneville, 1973], the key parameters in Tab. 4 also comprehend implications about the role of hyperfine fields in the magnetic ordering of TGG. The coefficient , is the dimensionless strength of the hyperfine coupling in the pseudospin- effective Hamiltonian obtained by projecting on the quasidoublet subspace – here is the CEF ground state splitting (see Sec. III.2.1) and comes from the hyperfine Hamiltonian , which, together with the Zeeman term , act as a perturbation to in Eq. (1).
In our experiment we cannot directly probe the behaviour of the nuclear spins, and we cannot verify definitively the relevance of our findings with respect to the hyperfine aspects. If we were to strictly apply the criteria of Hammann and Manneville, then we would deduce that the molecular field is mainly of electronic nature and that the cooperative electro-nuclear polarization of the magnetic moment of the Tb3+ ions will be relevant only at the lowest temperatures (our results in Tab. 4 imply in Fig. 3 of Ref. [Hamman and Manneville, 1973], which is to say that significant nuclear polarisation is only expected at mK or )). However, one ought to conduct a dedicated study of instances of hyperfine driven quantum criticality at a level which is beyond the scope of this manuscript.
The broadening and structure of the first excitation appearing at the lowest temperatures (Fig. 10) suggests that the crystal field level is developing into dispersive excitons, as expected in a singlet-singlet systemLeask et al. (1994), and it would be interesting to examine the extent of any mode-softening at the transition Zheludev et al. (1996).
The crystal field states are of importance in the the acoustic Faraday effect (AFE) Thalmeier (2009); Sytcheva et al. (2010) and acoustic Cotton-Mouton effect Löw et al. (2014), and in quantitative explanations of the elastic constants Löw et al. (2014) and may also be of importance in the thermal Hall effect. A detailed explanation of the acoustic Faraday effect exists Thalmeier (2009), and depends in part on the character of the crystal field states of the main terbium site and their coupling with phonons. It is noted in Ref. [Thalmeier, 2009] that the crystal field states were not precisely known, and a simplified scheme of cubic Tb3+ site symmetry was adopted using a doublet and triplet, with specific field dependent components and matrix elements amongst them. A quantitative explanation of the temperature and field dependence of the elastic constants Löw et al. (2013, 2014) has been attempted using the parameters of Ref.. [Guillot and Marchand, 1985], but, as described above, a more accurate description should be expected using the parameters presented here, particularly since the intersections and crossings of some levels are modified by the use of our parameters.
V Conclusions
The low-temperature magnetic structure of TGG is of the multiaxial antiferromagnet type. As closer examination has shown, the large anisotropy of the Tb3+ magnetic moments and its direction can be explained by the time-reversal properties of the crystal-field states of this non-Kramers ion. The singlet ground-state of the Tb3+ ion in TGG indicates the presence of perturbations allowing this induced-moment type of system to develop long-range order. Determination of the nature of the ordering transition still requires additional experimental investigation.
Two striking anomalies can be recognised in the crystal-field spectra measured by neutron scattering. These are: substantial differences between observed and expected linewidths of low-lying excitations and the pronounced temperature-dependent structure of the quasidoublet ground-state (see Fig. 12(b)). To address such effects, elucidating superexchange mechanisms between Tb3+ ions, as well as coupling between magnetic and lattice degrees of freedom should be a priority for further studies. These investigations indeed introduce a collective character by perturbing the microscopic states from those derived within a (semi-classical) single-ion approach.
In addition, the results of bulk measurements we have shown departures from a picture of non-interacting spins when cooling below 50 K. This is consistent with a suspected onset of the effects of interactions that may lead to a spin liquid phase of so far unknown character. The presence of a disordered, but correlated regime in TGG is not surprising given its moderate frustration (). Nonetheless its appearance would be expected more in the range of temperatures .
Further investigations with single crystal samples that could provide the detailed -dependence of the observed features are needed to determine precisely the perturbation affecting single-ion anisotropy and the exact character of the intermediate short-range order below 50 K in TGG. We believe that these would furthermore allow us to establish a consistent microscopic theory for the thermal Hall behaviour. By enriching the picture of the low temperature physics in TGG, the results we present here constitute the basis for a full microscopic description of the observed effect.
Acknowledgements.
The authors would like to express their gratitude to Victoria García Sakai for her assistance during IRIS experiment, and to Olivier Cépas, Michel Gingras, Michel Kenzelmann, Michiyasu Mori, and Mike Zhitomirsky for stimulating discussions and insightful suggestions. Neutron scattering experiments were carried out at the spallation neutron source ISIS at the Rutherford Appleton Laboratory, UK. The presented graphical representations of the crystallographic structure were prepared with VESTA software Momma and Izumi (2011).References
- Choudhary et al. (2015) K. Choudhary, A. Chernatynskiy, K. Mathew, E. W. Bucholz, S. R. Phillpot, S. B. Sinnott, and R. G. Hennig, Applied Physics Letters 107, 112109 (2015), eprint http://dx.doi.org/10.1063/1.4929434, URL http://dx.doi.org/10.1063/1.4929434.
- Serga et al. (2010) A. A. Serga, A. V. Chumak, and B. Hillebrands, Journal of Physics D: Applied Physics 43, 264002 (2010), URL http://stacks.iop.org/0022-3727/43/i=26/a=264002.
- Collet et al. (2016) M. Collet, X. de Milly, O. d’Allivy Kelly, V. V. Naletov, R. Bernard, P. Bortolotti, J. Ben Youssef, V. E. Demidov, S. O. Demokritov, J. L. Prieto, et al., Nature Communications 7, 10377 (2016), URL https://doi.org/10.1038/ncomms10377.
- Flebus et al. (2017) B. Flebus, K. Shen, T. Kikkawa, K.-i. Uchida, Z. Qiu, E. Saitoh, R. A. Duine, and G. E. W. Bauer, Phys. Rev. B 95, 144420 (2017), URL https://link.aps.org/doi/10.1103/PhysRevB.95.144420.
- Henley (2010) C. L. Henley, Annual Review of Condensed Matter Physics 1, 179 (2010), URL http://dx.doi.org/10.1146/annurev-conmatphys-070909-104138.
- Gardner et al. (2010) J. S. Gardner, M. J. P. Gingras, and J. E. Greedan, Rev. Mod. Phys. 82, 53 (2010), URL https://link.aps.org/doi/10.1103/RevModPhys.82.53.
- Ball et al. (1963) M. Ball, M. J. M. Leask, W. P. Wolf, and A. F. G. Wyatt, Journal of Applied Physics 34, 1104 (1963), eprint http://dx.doi.org/10.1063/1.1729388, URL http://dx.doi.org/10.1063/1.1729388.
- Felsteiner and Misra (1981) J. Felsteiner and S. K. Misra, Phys. Rev. B 24, 2627 (1981), URL https://link.aps.org/doi/10.1103/PhysRevB.24.2627.
- Ball et al. (1961) M. Ball, G. Garton, M. J. M. Leask, D. Ryan, and W. P. Wolf, Journal of Applied Physics 32, S267 (1961), eprint http://dx.doi.org/10.1063/1.2000429, URL http://dx.doi.org/10.1063/1.2000429.
- Hastings et al. (1965) J. M. Hastings, L. M. Corliss, and C. G. Windsor, Phys. Rev. 138, A176 (1965), URL https://link.aps.org/doi/10.1103/PhysRev.138.A176.
- Hammann (1968a) J. Hammann, Physics Letters A 26, 263 (1968a), ISSN 0375-9601, URL http://www.sciencedirect.com/science/article/pii/0375960168906385.
- Hammann (1968b) J. Hammann, J. Phys. France 29, 495 (1968b), URL https://doi.org/10.1051/jphys:01968002905-6049500.
- Hammann (1969) J. Hammann, Acta Crystallographica Section B 25, 1853 (1969), URL https://doi.org/10.1107/S0567740869004833.
- Hammann and Ocio (1975) J. Hammann and M. Ocio, Physics Letters A 55, 195 (1975), ISSN 0375-9601, URL http://www.sciencedirect.com/science/article/pii/0375960175907082.
- Hammann and Ocio (1977) J. Hammann and M. Ocio, Physica B+C 86, 1153 (1977), ISSN 0378-4363, URL http://www.sciencedirect.com/science/article/pii/0378436377908294.
- Hov et al. (1980) S. Hov, H. Bratsberg, and A. Skjeltorp, Journal of Magnetism and Magnetic Materials 15-18, 455 (1980), ISSN 0304-8853, URL http://www.sciencedirect.com/science/article/pii/0304885380911282.
- Quilliam et al. (2013) J. A. Quilliam, S. Meng, H. A. Craig, L. R. Corruccini, G. Balakrishnan, O. A. Petrenko, A. Gomez, S. W. Kycia, M. J. P. Gingras, and J. B. Kycia, Physical Review B 87, 174421 (2013), URL https://link.aps.org/doi/10.1103/PhysRevB.87.174421.
- Paddison et al. (2015) J. A. M. Paddison, H. Jacobsen, O. A. Petrenko, M. T. Fernández-Díaz, P. P. Deen, and A. L. Goodwin, Science 350, 179 (2015), ISSN 0036-8075, eprint http://science.sciencemag.org/content/350/6257/179.full.pdf, URL http://science.sciencemag.org/content/350/6257/179.
- Momma and Izumi (2011) K. Momma and F. Izumi, Journal of Applied Crystallography 44, 1272 (2011), URL https://doi.org/10.1107/S0021889811038970.
- Guillot and Marchand (1985) M. Guillot and A. Marchand, Journal of Physics C: Solid State Physics 18, 3547 (1985), URL http://stacks.iop.org/0022-3719/18/i=18/a=018.
- Kamazawa et al. (2008) K. Kamazawa, D. Louca, R. Morinaga, T. J. Sato, Q. Huang, J. R. D. Copley, and Y. Qiu, Phys. Rev. B 78, 064412 (2008), URL https://link.aps.org/doi/10.1103/PhysRevB.78.064412.
- Araki et al. (2008) K. Araki, T. Goto, Y. Nemoto, T. Yanagisawa, and B. Lüthi, The European Physical Journal B 61, 257 (2008), ISSN 1434-6036, URL https://doi.org/10.1140/epjb/e2008-00077-1.
- Hamman and Manneville (1973) J. Hamman and P. Manneville, J. Phys. France 34, 615 (1973), URL https://doi.org/10.1051/jphys:01973003407061500.
- Dentz et al. (1974) D. J. Dentz, R. C. Puttbach, and R. F. Belt, AIP Conference Proceedings 18, 954 (1974), eprint http://aip.scitation.org/doi/pdf/10.1063/1.3141859, URL http://aip.scitation.org/doi/abs/10.1063/1.3141859.
- Villaverde et al. (1978) A. B. Villaverde, D. A. Donatti, and D. G. Bozinis, Journal of Physics C: Solid State Physics 11, L495 (1978), URL http://stacks.iop.org/0022-3719/11/i=12/a=004.
- Barnes and Petway (1992) N. P. Barnes and L. B. Petway, J. Opt. Soc. Am. B 9, 1912 (1992), URL http://josab.osa.org/abstract.cfm?URI=josab-9-10-1912.
- Thalmeier (2009) P. Thalmeier, Phys. Rev. B 80, 214421 (2009), URL https://link.aps.org/doi/10.1103/PhysRevB.80.214421.
- Sytcheva et al. (2010) A. Sytcheva, U. Löw, S. Yasin, J. Wosnitza, S. Zherlitsyn, P. Thalmeier, T. Goto, P. Wyder, and B. Lüthi, Phys. Rev. B 81, 214415 (2010), URL https://link.aps.org/doi/10.1103/PhysRevB.81.214415.
- Löw et al. (2014) U. Löw, S. Zherlitsyn, K. Araki, M. Akatsu, Y. Nemoto, T. Goto, U. Zeitler, and B. Lüthi, Journal of the Physical Society of Japan 83, 044603 (2014), URL https://doi.org/10.7566/JPSJ.83.044603.
- Strohm et al. (2005) C. Strohm, G. L. J. A. Rikken, and P. Wyder, Phys. Rev. Lett. 95, 155901 (2005), URL https://link.aps.org/doi/10.1103/PhysRevLett.95.155901.
- Inyushkin and Taldenkov (2007) A. V. Inyushkin and A. N. Taldenkov, JETP Letters 86, 379 (2007), URL http://dx.doi.org/10.1134/S0021364007180075.
- Sheng et al. (2006) L. Sheng, D. N. Sheng, and C. S. Ting, Phys. Rev. Lett. 96, 155901 (2006), URL https://link.aps.org/doi/10.1103/PhysRevLett.96.155901.
- Kagan and Maksimov (2008) Y. Kagan and L. A. Maksimov, Phys. Rev. Lett. 100, 145902 (2008), URL https://link.aps.org/doi/10.1103/PhysRevLett.100.145902.
- Mori et al. (2014) M. Mori, A. Spencer-Smith, O. P. Sushkov, and S. Maekawa, Phys. Rev. Lett. 113, 265901 (2014), URL https://link.aps.org/doi/10.1103/PhysRevLett.113.265901.
- Inyushkin and Taldenkov (2010) A. V. Inyushkin and A. N. Taldenkov, Journal of Experimental and Theoretical Physics 111, 760 (2010), ISSN 1090-6509, URL https://doi.org/10.1134/S1063776110110075.
- Rodr guez-Carvajal (1993) J. Rodr guez-Carvajal, Physica B: Condensed Matter 192, 55 (1993), ISSN 0921-4526, URL http://www.sciencedirect.com/science/article/pii/092145269390108I.
- Not (a) The coherent neutron scattering lengths of Tb and Ga are, respectively, fm and fm.
- (38) H. T. Stokes, D. M. Hatch, and B. J. Campbell, Isotropy software suite, URL http://iso.byu.edu.
- (39) Here, is identical to for BCC-type lattice.
- Leask et al. (1994) M. J. M. Leask, M. R. Wells, R. C. C. Ward, S. M. Hayden, and J. Jensen, Journal of Physics: Condensed Matter 6, 505 (1994), URL http://stacks.iop.org/0953-8984/6/i=2/a=021.
- Nandi et al. (2008) S. Nandi, A. Kreyssig, L. Tan, J. W. Kim, J. Q. Yan, J. C. Lang, D. Haskel, R. J. McQueeney, and A. I. Goldman, Phys. Rev. Lett. 100, 217201 (2008), URL https://link.aps.org/doi/10.1103/PhysRevLett.100.217201.
- Brown (2006) P. J. Brown, in International Tables for Crystallography, Volume C: Mathematical, Physical and Chemical Tables, edited by D. E. Prince, Kluwer Academic Publishers (International Union of Crystallography, 2006), chap. 4.4, pp. 454–461.
- Koningstein and Kane-Maguire (1974) J. A. Koningstein and C. J. Kane-Maguire, Canadian Journal of Chemistry 52, 3445 (1974), eprint https://doi.org/10.1139/v74-510, URL https://doi.org/10.1139/v74-510.
- Hutchings et al. (1964) M. Hutchings, F. Seitz, and D. Turnbull, 16, 227 (1964), URL http://www.sciencedirect.com/science/article/pii/S0081194708605172.
- Abragam and Bleaney (1970) A. Abragam and B. Bleaney, Electron Paramagnetic Resonance of Transition Ions (Clarendon Oxford, 1970).
- Jensen and Mackintosh (1991) J. Jensen and A. Mackintosh, Rare earth magnetism: structures and excitations, International series of monographs on physics (Clarendon Press, Oxford, 1991), ISBN 9780198520276.
- Gavignet-Tillard et al. (1973) A. Gavignet-Tillard, J. Hammann, and L. D. Seze, Journal of Physics and Chemistry of Solids 34, 241 (1973), ISSN 0022-3697, URL http://www.sciencedirect.com/science/article/pii/0022369773900838.
- Reid and Newman (2000) M. Reid and D. Newman, Crystal field handbook (Cambridge Univ. press, 2000).
- Boothroyd (1990) A. T. Boothroyd, Spectre, a program for calculating spectroscopic properties of rare earth ions in crystals (1990).
- Crosswhite and Moos (1967) H. M. Crosswhite and H. W. Moos, eds., Conference on Optical Properties of Ions in Crystals (Interscience Publishers, Inc., New York, 1967).
- Orlich and H fner (1969) E. Orlich and S. H fner, Journal of Applied Physics 40, 1503 (1969), eprint https://doi.org/10.1063/1.1657743, URL https://doi.org/10.1063/1.1657743.
- Boal et al. (1973) D. Boal, P. Grunberg, and J. A. Koningstein, Phys. Rev. B 7, 4757 (1973), URL https://link.aps.org/doi/10.1103/PhysRevB.7.4757.
- Antic-Fidancev et al. (1986) E. Antic-Fidancev, C. K. Jayasankar, M. Lemaitre-Blaise, and P. Porcher, Journal of Physics C: Solid State Physics 19, 6451 (1986), URL http://stacks.iop.org/0022-3719/19/i=32/a=019.
- Morrison et al. (1976) C. A. Morrison, D. E. Wortman, and N. Karayianis, Journal of Physics C: Solid State Physics 9, L191 (1976), URL http://stacks.iop.org/0022-3719/9/i=8/a=001.
- Bayerer et al. (1986) R. Bayerer, J. Heber, and D. Mateika, Zeitschrift für Physik B Condensed Matter 64, 201 (1986), ISSN 1431-584X, URL https://doi.org/10.1007/BF01303703.
- Mukherjee et al. (2017) P. Mukherjee, A. C. Sackville Hamilton, H. F. J. Glass, and S. E. Dutton, 29, 405808 (2017), URL http://dx.doi.org/10.1088/1361-648X/aa810e.
- Griffith (1963) J. S. Griffith, Phys. Rev. 132, 316 (1963), URL https://link.aps.org/doi/10.1103/PhysRev.132.316.
- Not (b) It is necessary that these are close to each other but well isolated from the others, and not connected by time-reversal to any other eigenstate of the system.
- Bidaux et al. (1973) R. Bidaux, A. Gavignet-Tillard, and J. Hammann, Journal de Physique 34, 19 (1973).
- Not (c) The self consistent procedure in Ref. [Hamman and Manneville, 1973] was developed by i) assuming the local anisotropy axes are along the directions as in Tb3Al5O12 [Hammann, 1969] – this was eventually verified in Ref. [Hammann and Ocio, 1975] ii) taking the value of the gap ( K or meV) from a comparison of a Schottky anomaly with the experimental heat capacity, iii) ignoring the role of any excited states.
- Zheludev et al. (1996) A. Zheludev, J. M. Tranquada, T. Vogt, and D. J. Buttrey, Phys. Rev. B 54, 6437 (1996), URL https://link.aps.org/doi/10.1103/PhysRevB.54.6437.
- Löw et al. (2013) U. Löw, S. Zvyagin, M. Ozerov, U. Schaufuss, V. Kataev, B. Wolf, and B. Lüthi, The European Physical Journal B 86, 87 (2013), ISSN 1434-6036, URL https://doi.org/10.1140/epjb/e2012-30993-0.
- Ramirez (2001) A. Ramirez, Handbook of Magnetic Materials 13, 423 (2001), ISSN 1567-2719, URL http://www.sciencedirect.com/science/article/pii/S1567271901130088.
Appendix A System of coordinates
In the rare earth garnets, each magnetic ion sits on one of the vertices joining the triangles of the two hyperkagome sublattices Ramirez (2001), as represented in Fig. 1. From a local point of view, the orthorhombic point-symmetry characterises the symmetry of the coordination environment or crystal field of a given ion (not shown in Fig. 1 – details in Sec. III.2). From a global point of view (i.e. with respect to the crystal-axes), the orientation of this local coordination environment varies from one site to the other. Throughout the whole garnet-lattice, according to the space-group , there are six orientations of the local axes with respect to the global cubic axes. In this work the local coordinates are chosen to be parallel to the 2-fold rotation axes of the point group, so that with respect to the global coordinates, they are:
| (5a) | ||||||||
| (5b) | ||||||||
| (5c) | ||||||||
| (5d) | ||||||||
| (5e) | ||||||||
| (5f) | ||||||||
This parametrisation allows for a coherent description of both single-ion physics and long range magnetic order. In the context of our study, each local coordinate system has as its local quantisation axis and coinciding parallel to the direction of the magnetic moment in the ordered phase. The rotation from each system to the other can be obtained using the rotations , where is the rotation matrix and represents the transpose of the vector .
Appendix B Eignevector structure of crystal-field states.
| [meV] | |||||||||||||||
|---|---|---|---|---|---|---|---|---|---|---|---|---|---|---|---|
| 0.0 | -0.091 | -0.026 | 0.701 | 0.701 | -0.026 | -0.091 | |||||||||
| 0.22 | 0.182 | 0.122 | -0.325 | -0.832 | -0.325 | 0.122 | 0.182 | ||||||||
| 4.50 | -0.594 | 0.096 | 0.371 | -0.371 | -0.096 | 0.594 | |||||||||
| 5.25 | 0.683 | 0.061 | -0.085 | -0.215 | -0.085 | 0.061 | -0.683 | ||||||||
| 6.01 | 0.383 | 0.115 | 0.583 | -0.583 | -0.115 | -0.383 | |||||||||
| 6.54 | -0.005 | 0.502 | 0.498 | -0.498 | -0.502 | 0.005 | |||||||||
| 26.40 | 0.032 | 0.706 | 0.030 | 0.030 | 0.706 | 0.032 | |||||||||
| 28.27 | 0.016 | 0.415 | 0.535 | -0.290 | 0.535 | 0.415 | 0.016 | ||||||||
| 34.26 | 0.566 | 0.302 | -0.298 | 0.298 | -0.302 | -0.566 | |||||||||
| 34.73 | -0.019 | -0.691 | 0.148 | -0.148 | 0.691 | 0.019 | |||||||||
| 35.63 | -0.701 | 0.035 | -0.090 | -0.090 | 0.035 | -0.701 | |||||||||
| 36.38 | 0.424 | -0.397 | 0.403 | -0.403 | 0.397 | -0.424 | |||||||||
| 38.20 | 0.023 | 0.556 | -0.318 | 0.422 | -0.318 | 0.556 | 0.023 |