Correlated Depletion and Dilution of Lithium and Beryllium Revealed by Subgiants in M 67
Abstract
The surface content of lithium (Li) and beryllium (Be) provide insights into the mixing and circulation mechanisms in stellar interiors. The old open cluster, M 67, has been well-studied for Li abundances in both main-sequence and evolved stars. The Be abundances give us a probe to a deeper level in stars. We have taken high-resolution spectra with Keck I with HIRES to determine Be abundances along the subgiant branch of M 67, where there are dramatic depletions of Li. These subgiants range in mass from 1.26 to 1.32 M⊙ and have evolved from main-sequence stars that would have occupied the region of the Li-Be dip found in younger clusters. Lithium abundances have been adjusted to the same scale for 103 stars in M 67 by Pace et al. The more massive stars now the coolest and furthest-evolved from the main-sequence show a drop in Li by a factor of 400 across the subgiant branch. Our new Be abundances also show a decline, but by a factor of 50. The two elements decline together with Li showing a steeper decline in these subgiants than it does in the Li-Be dip stars. The relative decline in Be abundance compared to Li is remarkably well fit by the models of Sills & Deliyannis, made specifically for the subgiants in M 67. Those models include the effects of mixing induced by stellar rotation. These M 67 subgiants show the effects of both main-sequence depletion and post-main-sequence dilution of both Li and Be.
1 INTRODUCTION
The surface abundances of the rare light elements, lithium (Li), beryllium (Be), and boron (B), allow us to probe into the internal structure of the stars. This results from the fact that these three elements are readily destroyed in stellar interiors where the temperatures are only a few million degrees Kelvin. They also provide insights into the mixing and other physical mechanisms taking place there.
Figure 1 – a representation of the Sun – indicates why Li and Be provide such important information. The Li atoms will be destroyed by nuclear reactions when they encounter a temperature of 2.5 x 10⁶ K and higher so Li exists only in the outer region of a star. (Above the red circle in Figure 1.) The temperature has to reach 3.5 x 10⁶ K to destroy Be atoms by nuclear reactions so the surface reservoir containing Be is larger than that for Li. (Above the blue circle in Figure 1.) The most robust of these three light elements is B; those nuclei need to be mixed down to 5 x 10⁶ K. (Not shown in this figure.)
All three light elements are susceptible to destruction in stellar interiors by nuclear reactions; some of these reactions are of the type (p,), (p,), (,n), (,) (Fowler et al. 1975). The major reaction for Li is 7Li(p,)4He showing that when the 7Li nucleus encounters a proton it will become 2 4He nuclei (= 2 alpha particles) at 2.5 x 10⁶ K. If the measured stellar photospheric abundances of Li, Be, B are less than the initial values (taken to be meteoritic abundances), then we know some destruction has occurred. (We measure these same initial values in young clusters, such as the Hyades (Boesgaard et al. 2016).) For example, if all of the surface Li is absent but some of the Be is present and all of the B is present, we know how deep the mixing has gone inside the star. The process of the mixing and destruction is a main sequence phenomenon and is very slow. We know this by comparing amounts of Li and Be in stars and clusters of an array of ages.
Observations of both Li and Be show that these elements are subject to depletion in main-sequence stars indicating destruction by nuclear reactions. The surface abundances are depleted when the surface convection zone (SCZ) is deep enough so that its base is hot enough to destroy these elements. (We note that in standard theory i.e. no rotation, magnetic fields, diffusion, mass loss or gain, etc. , Li is only depleted during pre-main-sequence evolution for G dwarfs and hotter stars, see Deliyannis et al. 1990)
As stars evolve off the main-sequence, especially in the red giant phase, Li and Be are subject to dilution. This means that the surface regions, which are relatively rich in Li and Be, are mixed with deeper regions where there is no Li or Be. This mixing is primarily due to the deepening of the outer convection zone as the star expands. The phenomenon of dilution was discussed in giants by Iben (1965, 1967) based on observations by Wallerstein (1965, 1966).
Boesgaard & Tripicco (1986) discovered a discontinuity in the Li abundances in main-sequence stars in the Hyades. (This Li-dip was presaged some 20 years earlier by Wallerstein et al. (1965) who found that they could determine only upper limits on Li for seven of their Hyades stars with values near 0.45.) There are large depletions of Li in a narrow temperature range of 6400 - 6800 K (masses near 1.2 ). The Li abundances in stars on either side of this “Li dip” are normal and close to the Li content measured in meteorites (Lodders 2003). Boesgaard & Budge (1988) further delineated the sharp drop in the mid-F dwarfs and Boesgaard et al. (2016) showed the total Li-temperature profile for the Hyades. This Li-dip is not present in the younger Pleiades cluster (Pilachowski et al. 1987, Boesgaard et al. 1988). This indicates that the Li depletion occurs during main-sequence evolution, rather than during the pre-main-sequence phase. Additional observations by Boesgaard and collaborators and other groups found this phenomenon to exist in F dwarfs in other older open clusters and in field stars. The Li-dip strongly contradicted the strictures of the standard theory, and suggested that additional physical mechanism(s) must be acting inside stars during the main sequence. This realization inspired exploration of a number of such mechanisms, including mass loss, diffusion, and slow mixing induced by rotation or gravity waves (discussion in Deliyannis et al. 1998).
2 BERYLLIUM IN CLUSTERS
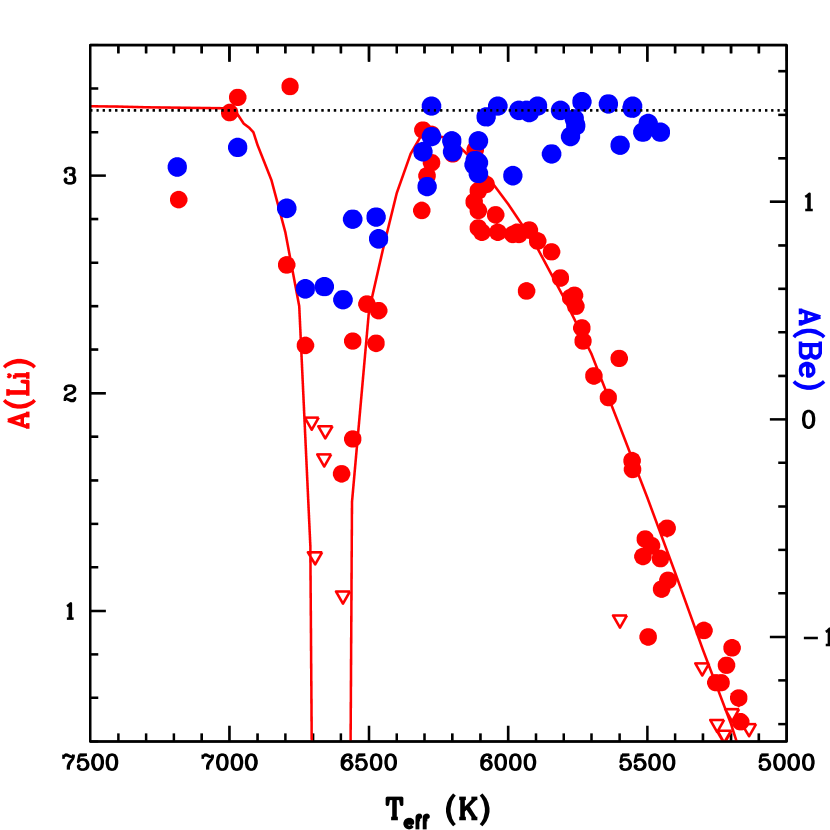
It is important to have abundance information on both Li and Be to probe different depths in a star. This is clearly shown in our results for both Li and Be in the Hyades cluster in Figure 2 derived from Boesgaard et al. (2016). The abundances are plotted on the same vertical scale and normalized to their relative initial abundances. We use the notation, A(Li) = log N(Li)/N(H) +12.00 and A(Be) = log N(Be)/N(H) +12.00. The Li dip in the F stars ( 6400-6800 K) is very deep. While there is a dip in the Be abundance in that temperature range, it is not as dramatic. While A(Li) drops by over two orders of magnitude, A(Be) falls by a factor of a little over six. As Figure 1 shows, the Be nuclei have to be mixed to deeper layers to be destroyed. In the cooler stars (6200 K) there is a systematic drop in Li, but this is not accompanied by a drop in Be. The surface content of these two atoms provide information about which processes cause mixing leading to depletions at different levels in the interiors of stars of different temperatures.
Boesgaard & King (2002) found the dip in the Be abundances in the Hyades, similar to that of Li, but Be is not as severely depleted as Li. Other young open clusters were studied for Be in the-Li dip region as well e.g. Pleiades and Per (Boesgaard et al. 2003a), Coma and UMa (Boesgaard et al. 2003b), Praesepe (Boesgaard et al. 2004a). They found no Be dip in the young Pleiades and relatively small Be-dips in the older clusters.
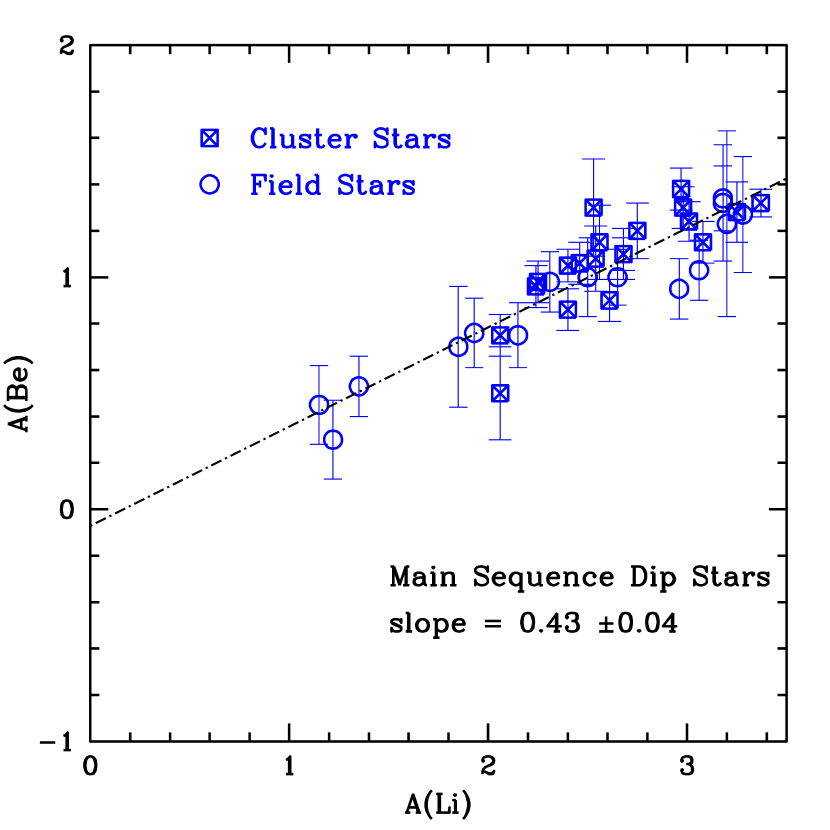
The various mechanisms proposed to create the Li-dip predict differing effects on Be, so Be data are critical to help distinguish among them. Discovery of a correlated depletion between Li and Be supported rotationally-induced mixing as the dominant mechanism creating the Li-Be dip. It could not support diffusion and mass loss, and even favored slow mixing due to rotation over slow mixing to gravity waves (Deliyannis et al. 1998). The correlated depletion of Li and Be was further detailed by Boesgaard et al. (2004b) in a sample of 88 main-sequence stars in clusters and the field. For the 35 stars on the cool side of the dip with temperatures of 6300 - 6650 K, the slope of the relationship A(Be) vs. A(Li) was found to be +0.43.
A(Be) = 0.43(0.04)A(Li) - 0.17(0.09)
The models of Charbonnel (1994) and Deliyannis & Pinsonneault (1997) of rotationally-induced stellar mixing predict 1) depletion of both Li and Be in the Li-Be dip, 2) greater depletion of Li than Be, and 3) are consistent with this slope. It should be noted that a small B-dip has been discovered in field stars, suggesting that mixing extends to deep enough layers to affect the surface B abundances, consistent with models that include rotational mixing (Boesgaard et al. 2005, 2016).
3 M 67 = NGC 2682
The old, open cluster, M 67, is similar to the Sun in metalicity and age. The best fitting isochrone in VandenBerg et al. (2007) gives an age of 3.9 Gyr. Yadav et al. (2008) compare their photometric data with four different libraries of stellar models. They find a range in age of 3.5 – 4 Gyr and prefer 3.8 Gyr. The metallicity M 67 has been found in many studies. Those for main-sequence stars include Friel & Boesgaard (1992) with [Fe/H] = +0.02; Randich et al. (2006) with +0.03; Pace et al. (2008) with +0.03; Jacobsen et al. (2011) with 0.01; Canto Martins et al. (2011) with 0.05; Önehag et al. (2014) with 0.01; Souto et al. (2018) with 0.03; Lum (2018) with 0.02.
This cluster provides uniquely important insights about the physical origin of the Li-Be-B dip because its subgiants are evolving out of the middle of the Li-dip. As they evolve and their SCZs deepen, they reveal the profile of the Li and Be preservation regions (i.e. Li and Be abundances as a function of depth), which varies from mechanism to mechanism. Furthermore, M 67 subgiants have the potential to probe a larger range of Li and Be (and B) abundances than has been possible for main sequence stars. Thus they provide even more insightful information and stringent constraints. Finally, it is possible that by the time Li-dip stars evolve to the much more advanced age of M 67 (as compared to the Hyades), mechanisms other than rotational mixing might also become important. Sills & Deliyannis (2000) argued that Li abundances in M 67 subgiants favored rotational mixing, but it was possible that diffusion and mass loss might play a role. We once again turn to the critically important element Be, in order to determine the relative importance of these various mechanisms (or to suggest some other ones).
Early studies of Li in M 67 were done by Hobbs & Pilachowski (1986) of eight stars including one subgiant, by Spite et al. (1987) of six main-sequence stars, and by Garcia López et al. (1988) of eight stars including one giant. A large spread in A(Li) was found. This was followed by Li abundance determinations by Balachandran (1995), Pasquini et al. (1997), Jones et al. (1999). More recently Randich et al. (2007) looked at both Li and Be in four main-sequence stars, two turn-off stars and two blue stragglers. In their search for solar twins in the M 67 Pasquini et al. (2008) determined Li abundances in 59 single stars in M 67 and identified 10 solar twins. (Three of these were studied in more detail by Castro et al. (2011).) In a later study Canto Martins et al. (2011) found Li abundances in 14 turn-off stars and subgiants and in 13 giants.
The Li abundances for 103 stars in M 67 were normalized to the same temperature scale by Pace et al. (2012) with consistent stellar parameters. These are the Li abundances and stellar parameter determinations we use in this work on Be abundances in our nine subgiants.
4 SPECTROSCOPIC OBSERVATIONS AND DATA REDUCTION
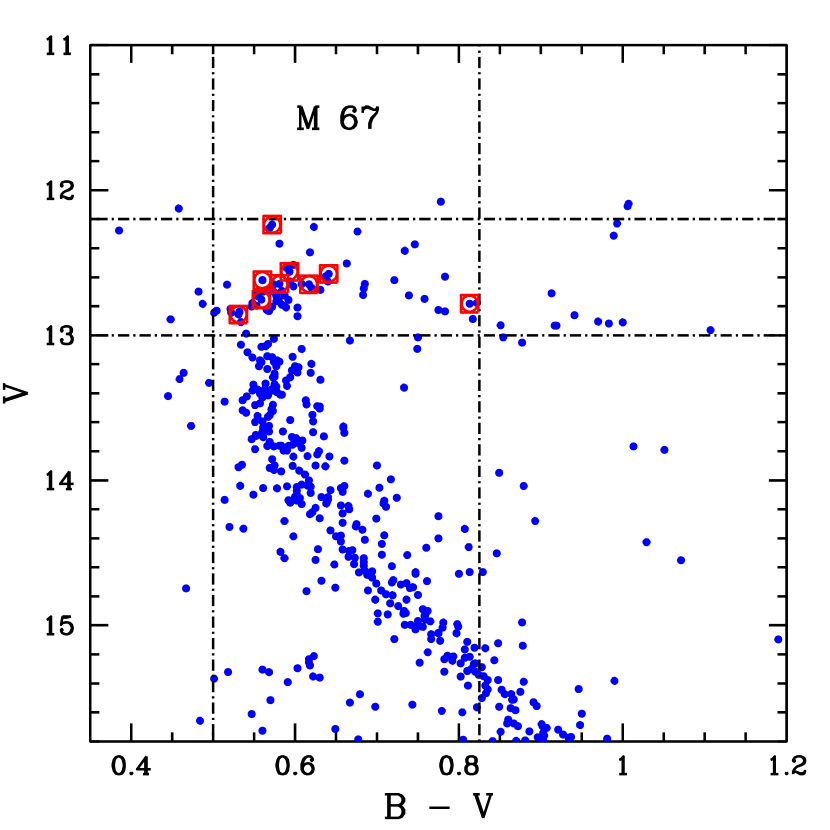
We have observed nine subgiants in M 67 for which Li abundances had been previously determined. Figure 3 shows the color-magnitude diagram for M 67 with photometry from Montgomery et al. (1993). The horizontal and vertical lines enclose the region of our target stars. The ones we have observed for Be are shown surrounded by red squares.
The solar system/meteoritic abundance of Be is very low: log N(Be/H) = 1.41, where log N(H) is 12.00 (Lodders 2003). This indicates that stellar Be abundances need to be measured in the strong resonance lines, typically Be II at 3130 and 3131. Our spectra were obtained with the Keck I telescope and HIRES (Vogt et al. 1993). The 2004 upgraded version of HIRES111http://www.ucolick.org/$∼$vogt/hires_2004ccd.html has a detector with three CCDs and the blue chip has a quantum efficiency of 93% (!) at the wavelength of 3130 Å where the Be II lines are found. This UV response is extremely important for our Be work. Our spectra have high spectral resolution (45,000) with a linear scale of 0.023 Å pix-1 and signal-to-noise ratios (S/N) at 3131 Å of 40-50. The spectral range is 3035 – 5880 Å.
We had three observing runs that covered six nights for this and other projects. Our individual exposure times were usually 30 minutes and multiple exposures were taken each night of a given star with some additional exposures on other observing nights. Our program stars had V magnitudes of 12-13. We were aiming to obtain S/N near 50 per pixel. The exposure times were meant to be long enough to obtain good enough signal to combine exposures, while short enough to minimize the occurrence of cosmic-ray events impacting the detector. Our spectra were taken when each star was as close to the meridian as possible to lessen the effect of atmospheric dispersion and absorption, which especially affect the shortest wavelengths. The log of the observations is given in Table 1. The names of the stars are from several sources. The F designation is from the early work of Fagerholm (1906); Sand is from Sanders (1977); MMJ is from the photometric work of Montgomery et al. (1993); YBP refers to Yadav et al. (2008). The exposure times are the total of multiple exposures for a given night. The S/N ratios are the combined values for stars observed on more than one observing night.
In order to do the data reduction, we obtained two 1 s exposures of the Th-Ar lamp at the beginning of the night and one more at the end of the night. Several exposures were taken of the quartz lamp for the flat-fielding of the science frames. The exposure times were 1 s for the red CCD chip, 3 s for the green chip and 50 s for the blue chip. (The long exposures on the blue chip were needed to get enough signal in the shortest wavelengths for the Be II spectral lines.) In addition, at least 11 bias frames were taken at 0 s for the calibration.
The MAKEE pipeline (Barlow 2008222http://www.caltech.edu/$∼$tb/makee/) was used to subtract the master bias frame (from our 11+ bias exposures) and to normalize the spectra with our master flat fields made for each of the three CCD chips. With the Th-Ar spectra (which were identical from the beginning and the end of the night) we made the preliminary wavelength justification. We used IRAF333IRAF is distributed by the National Optical Astronomy Observatories, which are operated by The Association of Universities for Research in Astronomy, Inc., under cooperative agreement with the National Science Foundation. for the final wavelength correction, for co-adding the multiple exposures of each star and for the continuum fitting.
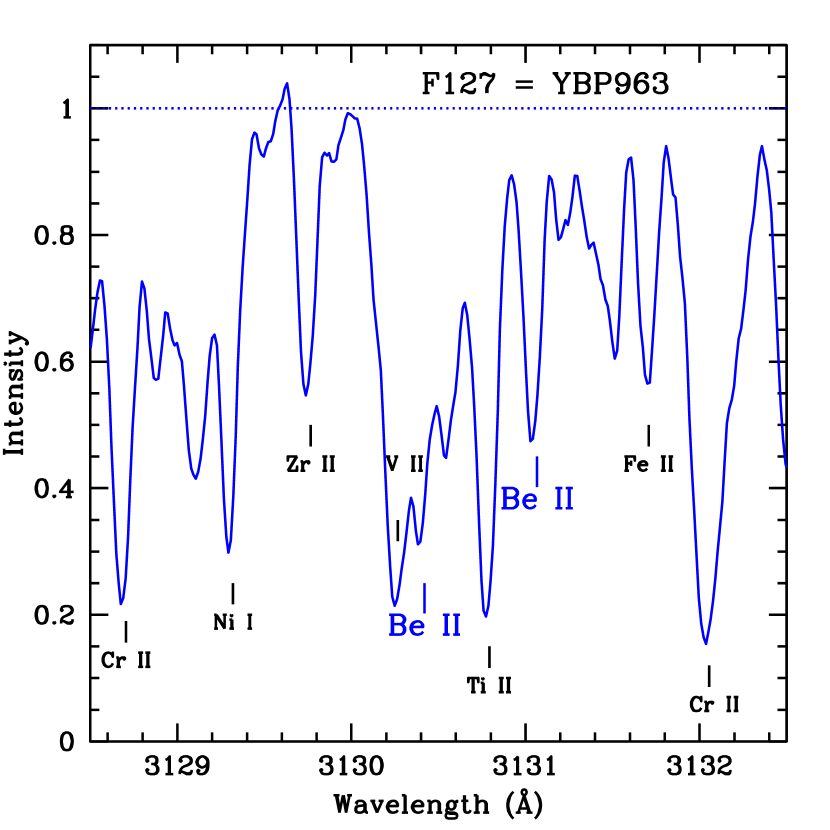
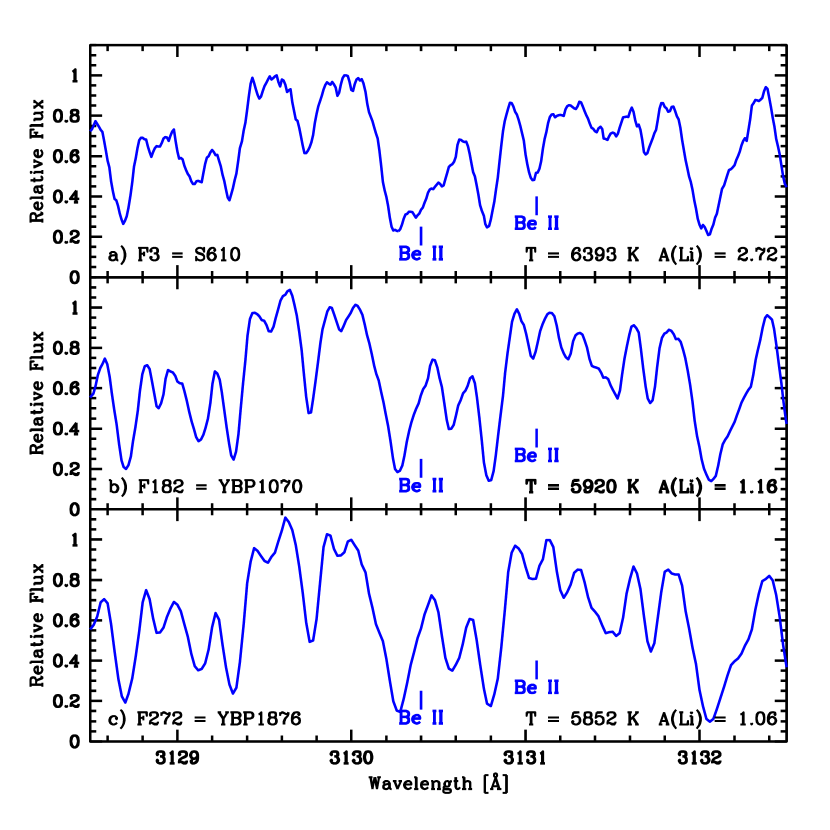
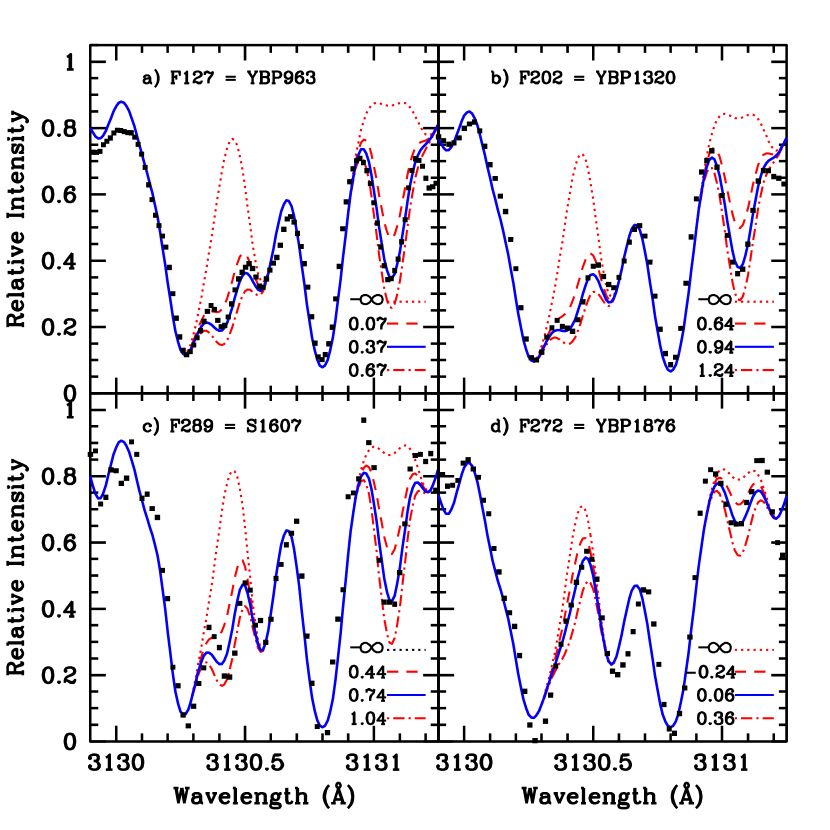
An example of the spectrum of F127 = YBP963 in the region of the Be II lines is shown in Figure 4. Some of the other strong lines in the region are identified from the solar spectrum, but we note that all the lines are blends with other atomic and molecular features. Examples of the spectra for three of the stars are shown in Figure 5 where the positions of the Be II resonance are shown. These three stars cover the range in of the stars in our sample and in A(Li) as computed by Pace et al. (2012).
5 ABUNDANCE DETERMINATION
The abundance of Li has been determined in main-sequence, subgiant and red giant stars in M 67 by several different groups. They have been put on the same temperature scale by Pace et al. (2012). The 103 stars all have masses 0.9 M☉. (The individual references and calibrations are given in the Pace et al. paper.) We have used the values they give in their Table 1 for and log g. The value for [Fe/H] = +0.02 was used in the models. (We also used [Fe/H] = 0.04 in our models, but found a mean difference for the nine stars of only 0.004 with the lower Fe abundance.) Edvardsson et al. (1993) determined an empirical relationship for microturbulent velocity, , from 189 F and G disk dwarfs with dependencies on both and log g. We have used that relationship to find the appropriate value for each of our M 67 stars. The stellar parameters are given in Table 2.
We used the synth driver in the updated version of MOOG444http://www.as.utexas.edu/$∼$chris/moog.html (Sneden 1973, Sneden et al. 2012). This version of MOOG includes Kurucz’s UV opacity edges, the metal bound-free opacity contributions adapted from the ATLAS model atmosphere code (e.g. Kurucz et al. (2011 and references therein). Our line list covers the region from 3129.5 to 3132.5 and has over 300 atomic and molecular lines. Figure 6 shows the observed and synthesized spectra for four of our stars. The notation is A(Be) = log N(Be)/N(H) + 12.00. The abundance results for A(Li) and A(Be) are given in Table 3 along with the stellar temperature and mass.
We have tried to make estimates of the errors in our Be determinations by using Kurucz grid models over our range in stellar parameters. The Be abundances from Be II are quite insensitive to temperature in the region from 6750 to 5500 K. For an error in temperature of 80 K, the error in A(Be) is 0.01. However, the Be abundance is sensitive to log g. For an error in log g of 0.25, the error in A(Be) is 0.09 at T = 6500 K; 0.11 at T = 6250 K; 0.125 at T = 6000; and 0.13 at T = 5750 K. As mentioned above we found that the values we used for [Fe/H] between 0.04 to +0.02 had virtually no effect on the Be abundance. Another source of uncertainty is how well the synthetic spectrum matches the observed one. In the determination of the best fit we relied almost completely on the relatively unblended Be II line at 3131.067 line. In Figure 6 we show the best fit Be abundance and those that are a factor of two (0.3 in the log) above and below the best fit. In the region of that less blended line, we found sigma of the observed minus computed spectra. That led to an estimated error of 0.06 dex. The log g error is the dominant source of uncertainty in the Be abundance determination. The values of log g used by Pace et al. (2012) were computed with the isochrone determined by Castro et al. (2011). They report values to three decimal points, but do not state the error. We will assume a typical error for log g of 0.25. We adopt a typical error in A(Be) of 0.14.
6 RESULTS AND DISCUSSION
The examination of both Li and Be abundances in field stars and cluster stars has been important in determining the cause(s) of the observed depletions. Deliyannis & Pinsonneault (1997) were able to rule out mass loss and microscopic diffusion and show that the timescale for mixing had to be long. With new Be observations in some 60 field stars Stephens et al. (1997) were able to reject those mechanisms also and to show that neither meridional circulation nor gravity waves could reproduce mild to severe Be depletions. Deliyannis et al. (1998) showed that the Li and Be abundances (depletions) were correlated. This pointed to rotationally-induced mixing as the cause of the element depletions. As explained by Stephens et al. (1997), the stellar wind removes angular momentum and so an angular velocity gradient develops between the outer layers and the rapidly-rotating interior. In turn, a shear instability may develop and will redistribute angular momentum and material through the inner regions of the star. This material mixing will slowly deplete Li and Be, but to different degrees because Be is less vulnerable to depletion, i.e. a higher temperature is needed for the nuclear reactions that destroy Be nuclei.
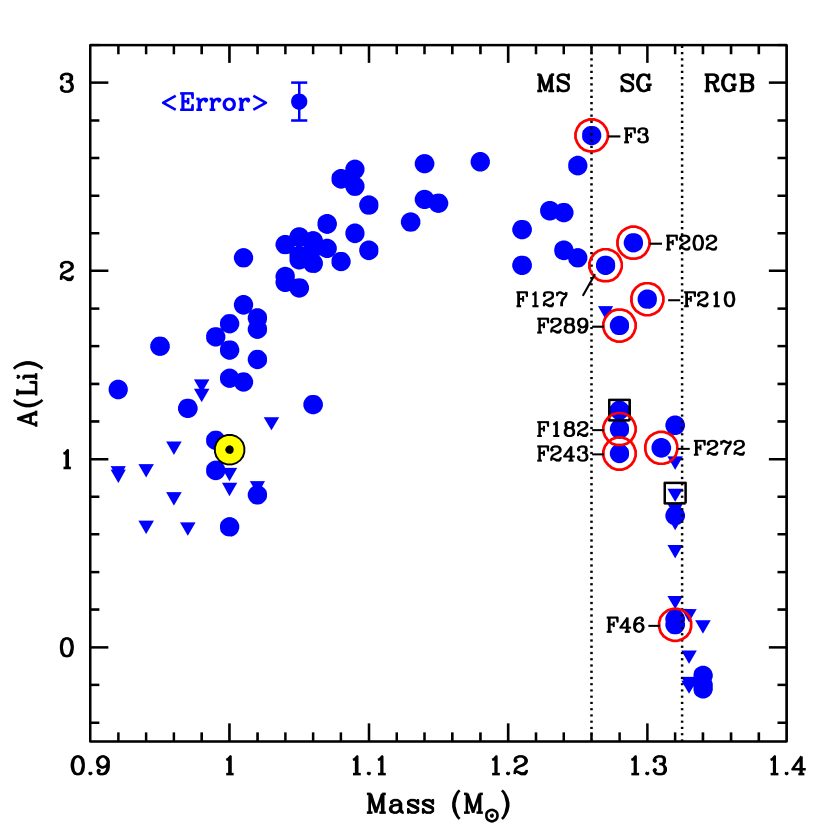
The stars we have observed for Be in the subgiants cover a large range in A(Li) of nearly 3 orders of magnitude and also a large range in A(Be) of nearly two orders of magnitude. Figure 7 shows the Li results from Pace et al. (2012) as a function of their values for the stellar mass. (We have omitted the stars they call “deviant” from this plot.) In this figure we show a delineation by mass of main-sequence stars (MS), subgiant stars (SG) and giant stars (RGB) with the vertical dotted lines. We take the turn-off mass as 1.26 M⊙ from Sills & Deliyannis (2000). The points circled in red are the subgiants for which we have taken spectra in the Be II region. These stars cover the full range in A(Li). The more massive subgiants are the ones that have evolved farthest along the subgiant branch. One can see that A(Li) plummets with increased mass. As Figure 1 shows, Li is far more susceptible to destruction than Be because Li is destroyed at higher-layers (cooler-temperatures) in the interiors of stars.
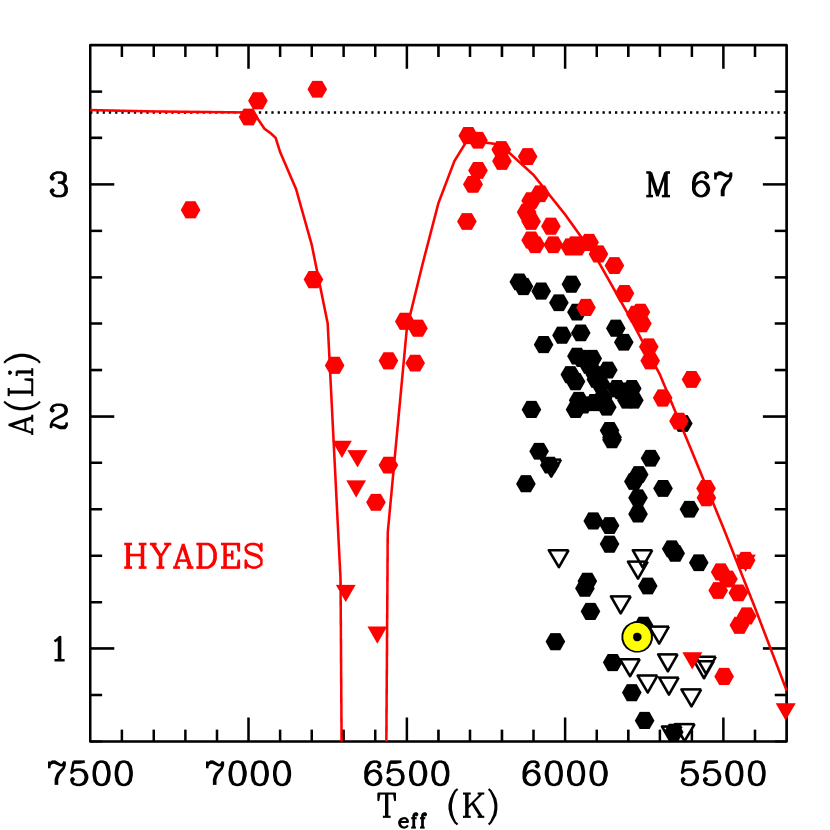
These subgiants have evolved from the temperature/stellar mass values which show the strong Li dip in younger open clusters. This can be seen in Figure 8 which compares the Li abundances in the much younger Hyades main-sequence stars with the Li in the main-sequence stars of M 67. There are no stars left on the M 67 main sequence from the temperature and mass range of the Li-Be dip. So the M 67 subgiants are the ones that once resided in the Li dip region during their lifetime on the main sequence.
Note that both Figures 7 and 8 show that there is a large range in A(Li) for the solar-mass (Figure 7) and solar-temperature (Figure 8) dwarfs in M 67. The cooler dwarfs in M67 have a much greater spread in A(Li) than that found in the Hyades. The position of the Sun is shown in both figures. The value of the solar photospheric Li abundance is similar to that in the M 67 dwarfs of the same mass and temperature. The values range from A(Li) = 0.6 to 1.8. This indicates that the Sun, which is similar in age and metallicity to M 67, does not have an anomalous Li value at A(Li) = 1.05 0.10 (Asplund et al. 2009) with respect to M 67 solar=mass stars.
Although M 67 is about 6 times older than the Hyades, we can make a comparison between the two clusters while bearing in mind their age difference. In fact, we can see that Li depletion continues on the cool side of the Li-dip in a cluster three times the age of the Hyades, NGC 6819 (Deliyannis et al. 2019). Presumably, the M 67 cluster would have had a similar distribution and depletion of Li and Be when the present subgiants were still on the main sequence. The added years for M 67 stars would result in even greater depletion of Li and Be than found in the Hyades. Figure 2 showed the distribution of both Li and Be in the Hyades. Although there is also a dip in the Be abundances in the Li dip region, it is not as deep as the Li dip. All the stars in the Li-Be dip have Be detections, not upper limit results, whereas deep depletions and upper limits are seen for Li. In M 67 the subgiants would have evolved from stars with large Be depletions and even larger depletions of Li.
It is possible that the Li and Be abundances in the subgiants of M 67 are completely consistent with their evolution from the Li-Be dip region. Inasmuch as M 67 is older than the Hyades, these stars would have been on the main sequence, depleting Li and Be, for a longer time. However, those main-sequence (surface) abundances in M 67 stars would start to be diluted by the expansion of the surface convection zone as the stars evolve off the main-sequence.
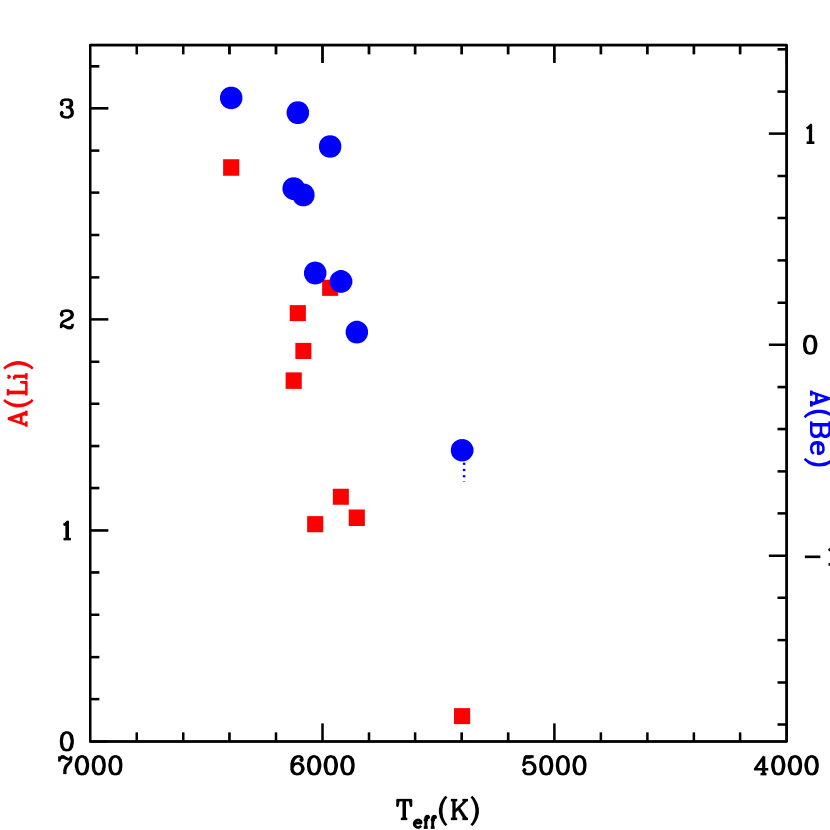
We show the Li and Be abundances in M 67 together as a function of decreasing temperature on the same vertical scale in Figure 9. It is clear that Li declines with decreasing temperature more steeply than Be does. The hottest stars, nearest the turn-off, are only moderately depleted from the initial (i.e. meteoritic) values. The depletion increases as these subgiants evolve toward cooler temperatures.
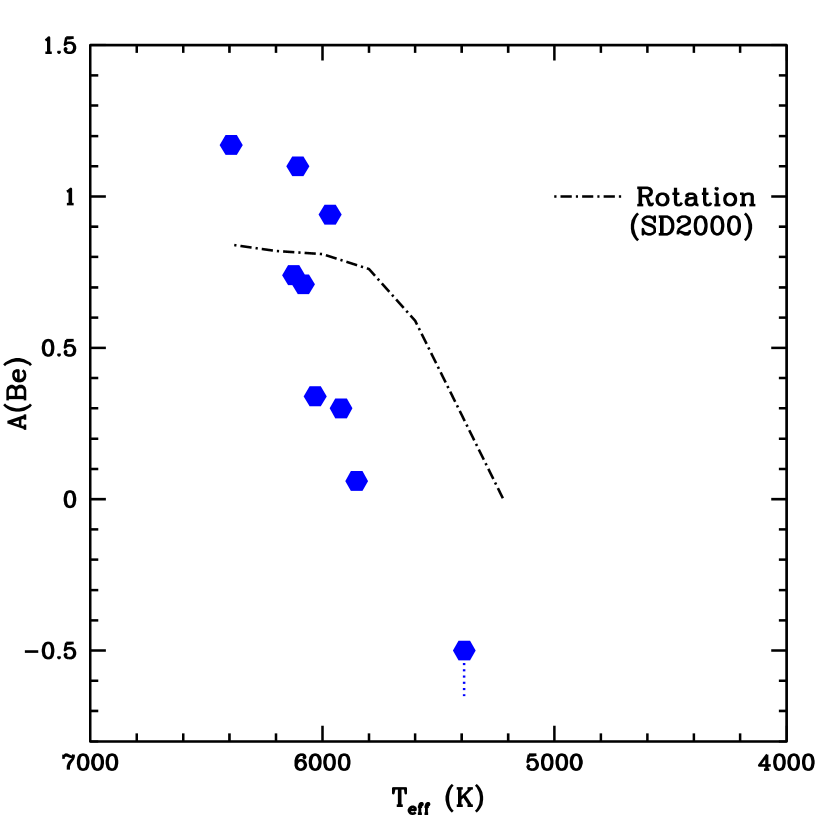
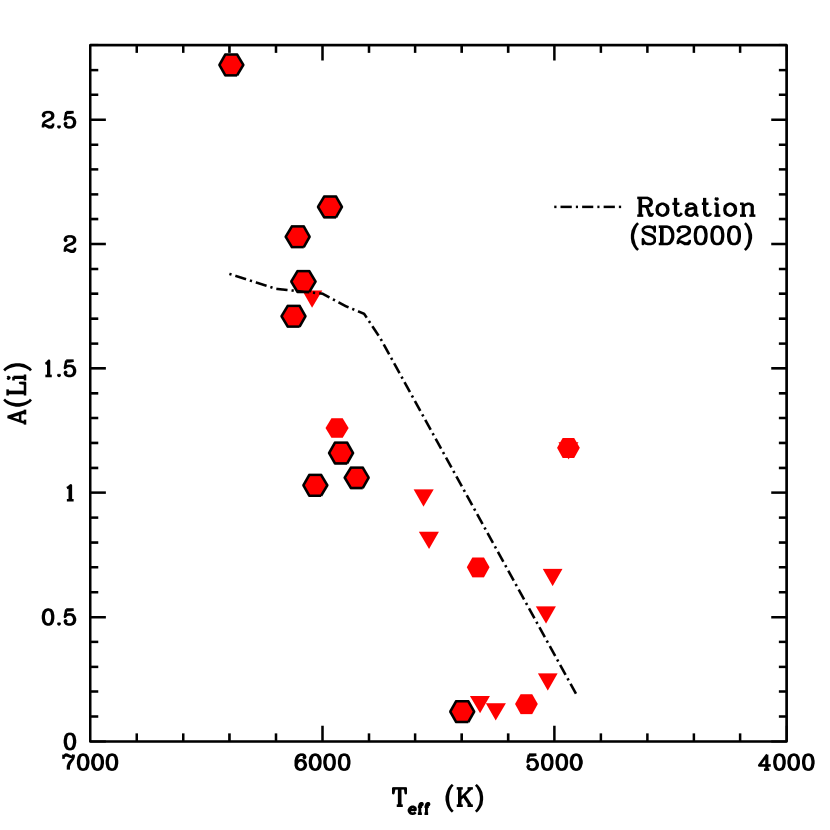
This span in A(Be) and A(Li) with temperature is shown in Figures 10 and 11. The Be abundance, shown in Figure 10, drops from A(Be) = 1.2 to 0.5, a factor of 50, over the drop of 1000 K in temperature, or between 1.26 to 1.32 M⊙ in stellar mass. The lowest-mass, least-evolved stars, have the most Be, i.e. the least Be depletion. For A(Li), shown in Figure 11, the drop is a factor of 400 over the drop of 1300 K in temperature in the same mass range. This is a reflection of the larger drop in Li than in Be as found in the main-sequence Li-Be dip, plus a potential drop due to post-main-sequence dilution.
In these two figures we show the model predictions of Sills & Deliyannis (2000) for Be and Li in M 67 subgiants caused by rotationally-induced mixing. The trend of decline in the Be depletions with temperature is off set by 500 K from the observations; the observed depletions set in at a higher temperature. Even the hottest, least massive star, F3, has depleted Be with A(Be) = 1.17 compared to the “initial” value. (That “initial” value for M 67 is somewhat unclear: Lodders (2003) give A(Be) = 1.41 from meteorites while Asplund et al. (2009) give 1.30 for meteorites from Lodders et al. (2009) and solar A(Be) as 1.38. From Figure 2 we see that the peak Be in the Hyades stars near 6000 K is 1.42 which is presumably their “initial” Be abundance.) For F3 the error in our A(Be) is 0.09.
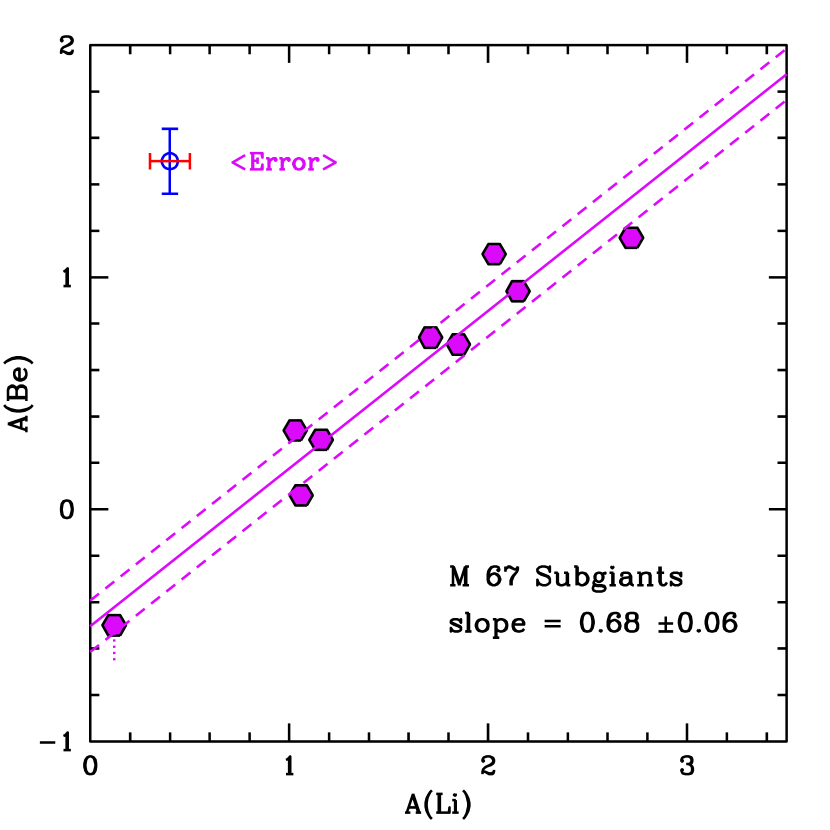
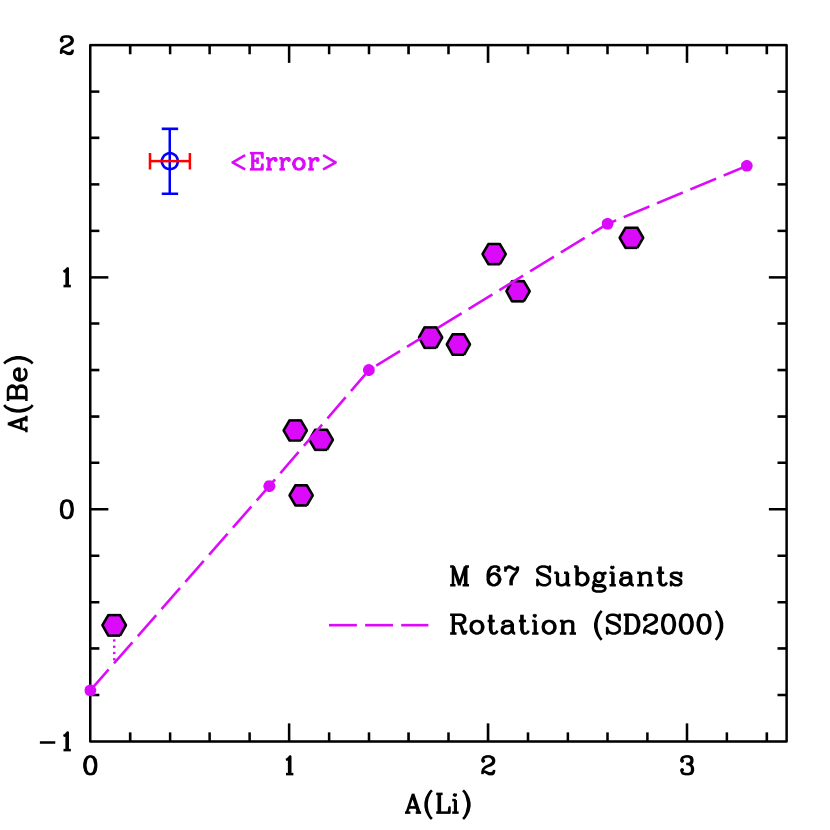
Inasmuch as we now have Be abundances, we are able to use both elements to examine the Li and Be decline to understand the stellar interior processes. In Figure 12 we plot A(Li) vs. A(Be). The left panel shows the main-sequence field and cluster stars from Boesgaard et al. (2004b) in the temperature range 6300 - 6650 K, with the equation given in section 2. That slope is 0.43 0.04 and results from main-sequence depletion of both Li and Be. The right panel is for our nine M 67 subgiants. We have made a linear fit through these points and find a slope of +0.65 0.06. This indicates that the Li abundance is falling much faster than the Be abundance in these subgiants. Perhaps this is due to the greater depletion of Li during the main-sequence life of this older cluster as well as the effects of dilution. The mechanism for depletion would be more effective on Li than Be. In addition there would be greater effects of dilution on Li than on Be because the Li reservoir is smaller that the Be reservoir.
Models that include rotationally-induced mixing for Li and Be in M 67 subgiants from Sills & Deliyannis (2000) are shown Figure 13. This reveals a more complex relationship than the simple linear fit in Figure 11. And it is a seemingly better fit to the observations. If other mechanisms also play a role, they must do so in a way that does not alter the Li/Be ratio significantly. Sills & Deliyannis (2000) also discuss the predicted effects of mass loss and diffusion on M 67 subgiant Li and Be abundances. Our data clearly rule out both as the dominant Li- and Be-depleting mechanism.
We have tried to place the two subgiants observed for Be by Randich et al. (2007) on the same (Pace) scale. The temperature differences are small: 32 K and +64 K. However, it is not clear what value of log g was used by them. Assuming it is 4.1 we can calculate the change from their value for A(Be). We have not plotted these two points in Figures 9, 11, and 12 due to the issue with log g. The data for the two stars are consistent with our results. These values would then become: Y1248 = S1039: T = 5937, A(Be) = 0.08, A(Li) = 1.26 and Y923 = S1239: T = 5541, A(Be) = 0.08, A(Li) = 0.08.
7 SUMMARY AND CONCLUSIONS
Dramatic depletions of Li have been found in the subgiant stars in M 67 as summarized by Pace et al. (2012). Our results for Be produce additional information to those for Li because they provide a probe into a deeper layer of the stellar interior. We have taken high-resolution spectra with Keck I with HIRES of nine subgiants in M 67 to determine the abundances of Be. We have used the set of stellar parameters and Li abundances established by Pace et al. in our analysis.
The subgiants in M 67 have evolved from stars that once were in the Li-Be dip region that is found in younger clusters. That dip is located in a 400 K region centered around 6650 K. Therefore, before becoming subgiants, they would have depleted some Li and Be from their initial amounts. As they evolved from the main-sequence, the deepening convection zone would begin to dilute the remaining Li and Be. The effects of both main-sequence depletion and post-main-sequence dilution are less effective on Be than Li both observationally and theoretically.
The star, F3, is at the turnoff mass of 1.26 M⊙ and is depleted in Li by a factor of 4 from the initial value and depleted in Be by a factor of 1.8. The evolutionary effects on Li and Be are seen in the subgiants from the low-mass stars to the more evolved ones, corresponding to masses from 1.26 to 1.32 M⊙ and temperatures from 6400 K to 5400 K. We can see in Figure 9 that A(Li) drops by a factor of 400, while A(Be) declines by a factor of about 50 over that temperature and mass range. The decline in A(Li) is a steeper drop with temperature than the decline in A(Be).
This greater decline in A(Li) is also shown in Figure 12 where the slope between A(Li) and A(Be) is 0.68 0.06. That slope is steeper than that main-sequence stars on the cool side of the Li-Be dip which is 0.43 0.04. Again this shows the greater susceptibility of Li, with respect to Be, for both main-sequence depletion and post-main-sequence dilution.
The models that include the effects of stellar rotation on the internal mixing processes in stars of Sills & Deliyannis (2000) predict the observed decline in Li and Be in the subgiants. It is the relative abundances of Li and Be that give the most powerful insights about the physical processes occurring inside stars. So, importantly, those models produce an excellent fit for the striking relationship between A(Li) amd A(Be) shown in Figure 13.
Both Figures 7 and 8 show that the value for solar A(Li) fits well with the observed range in A(Li) in M 67 stars of 1 solar mass and solar temperature. The Sun appears to have a normal Li content in spite of the prediction from standard solar models that the Sun should be depleted by only a factor of 3 rather than the observed factor of 200.
References
- (1) Asplund, M., Grevesse, N., Sauval, A. J. &Scott, P. 2009, Ann. Rev. Astr. Ap. 47, 481
- (2) Balachandran, S. 1995, ApJ, 446, 203
- (3) Boesgaard, A.M., Armengaud, E. & King, J.R. 2003a ApJ, 582, 410
- (4) Boesgaard, A.M., Armengaud, E. & King, J.R. 2003b ApJ, 583, 955
- (5) Boesgaard, A.M., Armengaud, E. & King, J.R. 2004a ApJ, 605, 864
- (6) Boesgaard, A.M., Armengaud, E., King, J.R., Deliyannis, C.P. & Stephens, A. 2004b ApJ, 613, 1202
- (7) Boesgaard, A.M. & Budge 1989, ApJ, 338, 875
- (8) Boesgaard, A. M., Deliyannis, C. P., & Steinhauer, A., 2005, ApJ, 621, 991
- (9) Boesgaard, A.M. & King, J.R. 2002, ApJ, 565, 587
- (10) Boesgaard, A. M., Lum, M. G., Deliyannis, C. P., King, J. R., Pinsonneault, M. H., & Sommers, G., 2016, ApJ, 830, 49.
- (11) Boesgaard, A.M. & Tripicco, M.J. 1986, ApJL, 302, L49
- (12) Canto Martins, B.L., Lébre, A., Palacios, A. et al. 2011, A&A, 527, A94
- (13) Castro, M., Do Nascimento, J.D., Biazzo, K. et al. 2011, A&A, 526, A17
- (14) Charbonnel, C., Vauclair, S., Maeder, A., Meynet, G., & Shaller, G. 1994, A&A, 283, 155
- (15) Deliyannis, C. P., Anthony-Twarog, B.J., Lee-Brown, D.B. & Twarog, B.A. 2019, ApJ, in press; arXiv:1909.04523
- (16) Deliyannis, C. P., Boesgaard, A. M., Stephens, A., King, J. R., Vogt, S. S. & Keane, M. J. 1998, ApJL, 498, L14
- (17) Deliyannis, C. P., Demarque, P. & Kawaler, S. D. 1990, ApJS, 73, 21
- (18) Deliyannis, C.P. & Pinsonneault, M.H. 1997, ApJ, 488, 836
- (19) Edvardsson, B., Andersen, J.A., Gustafsson, B., Lambert, D.L., Nissen, P.E. & Tomkin, J. 1993, A&A, 275, 101
- (20) Fagerholm, E. 1906, Ph.D. thesis, Uppsala Univ.
- (21) Fowler, W.A., Caughlan, G.R. & Zimmerman, B. A. 1975, ARAA, 13, 69
- (22) Friel, E.D. & Boesgaard, A.M. 1992, ApJ, 387, 170
- (23) Garcia López, R.J., Rebolo, R. & Beckman, J.E. 1988, PASP, 100, 1496
- (24)
- (25) Hobbs, L.M. & Pilachowski, C. A. 1986, ApJ, 311, L37
- (26) Iben, I. 1965, ApJ, 142, 1447
- (27) Iben, I. 1967, ApJ, 147, 620
- (28) Jacobson, H.R., Pilachowski, C.A. & Friel, E.D. 2011, AJ, 142, 59
- (29) Jones, B.F., Fischer, D. & Soderblom, D.R. 1999, AJ, 117, 330
- (30) Lodders, K. 2003, ApJ, 591, 1220
- (31) Lodders, K., Palme, H. & Gail, H.P. 2009, Landolt-Borstein New Series in Astronomy, Astrophysics and Cosmology, 4, 560 (arXiv: 09.01.1149)
- (32) Lum, M.G. 2018 Ph.D. thesis, Univ. Hawaii
- (33) Montgomery, K.A., Marschall, L.A. & Janes, K.A. 1993, AJ, 106, 181
- (34) Önehag, A., Gustafsson, B. & Korn, A. 2014, A&A, 562, A102
- (35) Pace, G., Castro, M., Melendez, J., Theado, S. &do Nascimento, J-D. 2012 A&A, 541, 150
- (36) Pace, G., Pasquini, L. & Francois, P. 2008, A&A, 489, 403
- (37) Pasquini, L., Randich, S. & Pallavicini, R. 1997, A&A, 325, 535
- (38) Pasquini, L., Biazzo, K., Bonifacio, P., Randich, S. & Bedin, L.R. 2008, A&A, 489, 672
- (39) Pilachowski, C., Booth, J. & Hobbs, L.M. 1987, PASP, 99, 1288
- (40) Randich, S., Primas, F., Pasquini, L., Sestito, P. & Pallavicini, R. 2007, A&A, 469, 163
- (41) Randich, S., Sestito, P., Primas, F., Palavicini, R. & Pasquini, L. 2006, A&A, 450, 557
- (42) Sanders, W.L. 1977, A&AS, 27, 89
- (43) Sills, A. & Deliyannis, C.P. 2000, ApJ, 544, 944
- (44) Sneden, C.A. 1973 Ph.D. Thesis, University of Texas at Austin
- (45) Sneden, C., Bean, J., Ivans, I., Lucatello, S., & Sobeck, J. 2012, MOOG: = LTE line analysis and spectrum synthesis, Astrophysics Source Code = Library, ascl:1202.009
- (46) Souto, D., Cunha, K., Smith, V.V. et al. 2018, ApJ, 857, 14
- (47) Spite, F., Spite, M., Peterson, R.C. & Chaffee, F.H. Jr. 1987, ApJ, 171, L8
- (48) Stephens, A., Boesgaard, A.M., King, J.K. & Deliyannis, C.P. 1997, ApJ, 491, 339
- (49) Vandenberg, D.A., Gustafsson, B., Edvardsson, B., Eriksson, K. & Ferguson, J. 2007, ApJ, 666, 105
- (50) Vogt, S. S. et al. 1994, Proc. SPIE, 2198, 362
- (51) Wallerstein, G. 1965, Nature, 204, 36
- (52) Wallerstein, G. 1966, ApJ, 143, 823
- (53) Wallerstein, G., Herbig, G.H. & Conti, P.S. 1965, ApJ, 141, 610
- (54) Yadav, R.K.S., Bedin, L.R., Piotto, G. et al. 2008, A&A, 484, 609
- (55)
| F | Sand | MMJ | YBP | V11V and B-V values are from CCD photometry by Montogomery et al. (1993) except for Sand1607 which is from Sanders (1977) and YBP 1876 which is from Yadav et al. (2008). | B-V11V and B-V values are from CCD photometry by Montogomery et al. (1993) except for Sand1607 which is from Sanders (1977) and YBP 1876 which is from Yadav et al. (2008). | (Date-UT) | Exp(min) | S/N |
|---|---|---|---|---|---|---|---|---|
| 3 | 610 | 5042 | 12.856 | 0.531 | 2014 Jan 16 | 120 | 44 | |
| 46 | 806 | 5350 | 1632 | 12.782 | 0.813 | 2014 Dec 27 | 120 | |
| 2017 Nov 10 | 60 | 35 | ||||||
| 127 | 995 | 5675 | 963 | 12.755 | 0.559 | 2014 Dec 28 | 135 | |
| 2017 Nov 10 | 60 | 45 | ||||||
| 182 | 2207 | 5929 | 1070 | 12.631 | 0.620 | 2017 Nov 10 | 30 | |
| 2017 Nov 11 | 120 | 47 | ||||||
| 202 | 1275 | 6018 | 1320 | 12.562 | 0.593 | 2014 Dec 27 | 120 | 47 |
| 210 | 1273 | 6047 | 1318 | 12.219 | 0.567 | 2014 Jan 16 | 60 | |
| 2017 Nov 11 | 30 | 37 | ||||||
| 243 | 1268 | 6177 | 1258 | 12.617 | 0.581 | 2014 Jan 16 | 120 | 49 |
| 272 | 1487 | 1876 | 12.577 | 0.641 | 2014 Dec 27 | 90 | ||
| 2014 Dec 28 | 45 | 47 | ||||||
| 289 | 1607 | 12.620 | 0.560 | 2014 Dec 28 | 45 | 24 |
| F | Sand | MMJ | YBP | (K)11These values are from Pace et al. (2012) | log g (K)11These values are from Pace et al. (2012) | |
|---|---|---|---|---|---|---|
| 3 | 610 | 5042 | 6393 | 4.000 | 2.21 | |
| 46 | 806 | 5350 | 1632 | 5398 | 3.717 | 1.79 |
| 127 | 995 | 5675 | 963 | 6106 | 4.002 | 1.98 |
| 182 | 2207 | 5929 | 1070 | 5920 | 3.918 | 1.94 |
| 202 | 1275 | 6018 | 1320 | 5967 | 3.884 | 2.02 |
| 210 | 1273 | 6047 | 1318 | 6082 | 3.831 | 2.19 |
| 243 | 1268 | 6177 | 1258 | 6031 | 3.911 | 2.04 |
| 272 | 1487 | 1876 | 5852 | 3.791 | 2.05 | |
| 289 | 1607 | 6124 | 3.919 | 2.01 |
| F | Name | (K)11These values are from Pace et al. (2012) | Mass (M⊙)11These values are from Pace et al. (2012) | A(Li)11These values are from Pace et al. (2012) | A(Be) |
|---|---|---|---|---|---|
| 3 | S610 | 6393 | 1.26 | 2.72 | 1.17 |
| 46 | Y1632 | 5398 | 1.32 | 0.12 | 0.50 |
| 127 | Y963 | 6106 | 1.27 | 2.03 | 1.10 |
| 182 | Y1070 | 5920 | 1.28 | 1.20 | 0.30 |
| 202 | Y1320 | 5967 | 1.29 | 2.15 | 0.94 |
| 210 | Y1318 | 6082 | 1.30 | 1.85 | 0.71 |
| 243 | Y1258 | 6031 | 1.28 | 1.03 | 0.34 |
| 272 | Y1876 | 5852 | 1.31 | 1.06 | 0.06 |
| 289 | S1607 | 6124 | 1.28 | 1.71 | 0.74 |