EMRI short = EMRI, long = extreme mass ratio inspiral \DeclareAcronymPTA short = PTA, long = pulsar timing array \DeclareAcronymLISA short = LISA, long = Laser Interferometer Space Antenna \DeclareAcronymGR short = GR, long = general relativity \DeclareAcronymBH short = BH , long = black hole \DeclareAcronymPBH short = PBH , long = primordial black hole \DeclareAcronymSGWB short = SGWB , long = stochastic gravitational-wave background \DeclareAcronymBBH short = BBH , long = binary black hole \DeclareAcronymBNS short = BNS , long = binary neutron star \DeclareAcronymNSBH short = NSBH , long = neutron star black hole \DeclareAcronymGW short = GW , long = gravitational wave \DeclareAcronymCMB short = CMB , long = cosmic microwave background \DeclareAcronymSFR short = SFR , long = star formation rate \DeclareAcronymCBC short = CBC, long = compact binary coalescence \DeclareAcronymSNR short = SNR, long = signal noise ratio \DeclareAcronymIMR short = IMR, long = inspiral-merger-ringdown \DeclareAcronymPSD short = PSD, long = power density spectrum \DeclareAcronymQNM short = QNM, long = quasi-normal modes \DeclareAcronymGRB short = GRB, long = gamma-ray burst \DeclareAcronymFLRW short = FLRW, long = Friedmann-Lemaître-Robertson-Walker
Searching for primordial black holes with stochastic gravitational-wave background in the space-based detector frequency band
Abstract
Assuming that primordial \aclpBH compose a fraction of dark matter, some of them may accumulate at the center of galaxy and perform a prograde or retrograde orbit against the gravity pointing towards the center exerted by the central massive \aclBH. If the mass of primordial \aclpBH is of the order of stellar mass or smaller, such \aclpEMRI can emit \aclpGW and form a background due to incoherent superposition of all the contributions of the Universe. We investigate the \aclSGWB energy density spectra from the directional source, the primordial \aclpBH surrounding Sagittarius A∗ of the Milky Way, and the isotropic extragalactic total contribution, respectively. As will be shown, the resultant \aclSGWB energy density shows different spectrum features such as the peak positions in the frequency domain for the above two kinds of sources. Detection of \aclSGWB with such a feature may provide evidence for the existence of primordial \aclpBH. Conversely, a null searching result can put constraints on the abundance of primordial \aclpBH in dark matter.
I Introduction
The recent direct detections of \acpGW by the LIGO and Virgo collaborations open a unique window to observe \acpBH Abbott et al. (2016a, b, c, 2017a, 2017b, 2017c, 2017d, 2018a). The event rate of binary \acBH merger at local Universe is estimated to be Gpc-3 yr-1 from the detections Abbott et al. (2018b). Among the \acGW events, the relatively large mass of the first detection (), GW150914, has stimulated discussions that the binary \acpBH of GW150914 could be of primordial origin, instead of products of stellar evolution Bird et al. (2016); Clesse and García-Bellido (2016a); Sasaki et al. (2016); Chen and Huang (2018). Ref. Sasaki et al. (2016) shows that the binary stellar-mass primordial \acpBH coalescence scenario can give the correct order of magnitude of event rate, if the abundance of primordial \acpBH in dark matter is .
Primordial \acpBH are a long hypothesized candidate for dark matter Hawking (1971); Carr and Hawking (1974); Dolgov and Silk (1993); Jedamzik (1997). Assuming all the primordial \acpBH have the same mass, a variety of observations from astronomy and cosmology have given constraints on the primordial \acBH abundance in dark matter, for example, gravitational lensing of stars and quasars, dynamics of dwarf galaxies, large scale structure formation and accretion effects on the \acCMB (see Refs. Carr et al. (2016); Sasaki et al. (2018); Belotsky et al. (2019); Ketov and Khlopov (2019) and references therein). The possibility that all the dark matter are primordial \acpBH with the same mass has been ruled out given all the constraints aforementioned (but see, e.g., Ref. Montero-Camacho et al. (2019)). Nevertheless, it is still interesting to consider the scenario where primordial \acpBH compose a part of dark matter and propose new methods to seek for evidence of primordial \acpBH or constrain their abundance in dark matter, especially leveraging the newly opened \acGW window Abbott et al. (2018c, 2019a).
In this work, we investigate the scenario in which primordial \acpBH constitute a fraction of dark matter in the galactic center. Astrophysical observations (see, e.g., Refs. Kormendy and Ho (2013); Kormendy and Richstone (1995) for a review) indicate that massive \acpBH with mass are ubiquitous and reside at the center of almost every massive galaxy. If some fraction of dark matter is composited by primordial \acpBH, they should perform a prograde or retrograde orbit against the gravity pointing towards the galactic center exerted by the central massive \acBH, and such a system becomes the so-called \acEMRI system whose mass ratio is usually larger than Babak et al. (2017). \acpEMRI are one of the important scientific targets of space-based \acGW detector, such as \acLISA which is anticipated to be launched in the 2030s 111https://www.elisascience.org/. Once detected, the \acGW signals from \acpEMRI can provide valuable information such as event rate estimation Babak et al. (2017); Amaro-Seoane and Preto (2011) and tests of general relativity Barack and Cutler (2007); Gair et al. (2013).
The focus of our work is the \acSGWB energy density spectrum from the \acEMRI system consisting of a massive \acBH at the galactic center and a subsolar mass primordial \acBH. \acSGWB is an incoherent superposition of numerous \acpGW, including those too weak to be detected individually Regimbau (2011); Romano and Cornish (2017); Abbott et al. (2016d, 2017e, 2018d) or having an intrinsic stochastic nature, such as the primordial \acGW which is generated by quantum fluctuations in the early Universe. The \acSGWB from binary stellar-mass primordial \acBH coalescence is calculated by Refs. Mandic et al. (2016); Wang et al. (2018); Chen et al. (2018); Clesse and García-Bellido (2016b) and, in particular, Ref. Wang et al. (2018) shows that the null result of \acSGWB in the LIGO frequency band ( Hz) has given the most stringent constraints on the abundance of primordial \acBH as dark matter in the mass range . In the \acLISA frequency band, Refs. Kühnel et al. (2017); Kuhnel et al. (2018) have considered the stochastic background from subsolar mass primordial \acpBH inspiraling to Sagittarius A∗, i.e., the central massive \acBH of the Milky Way. Our work will expand the study of Refs. Kühnel et al. (2017); Kuhnel et al. (2018) in the following two aspects. First, we calculate the \acSGWB energy density spectrum in the frequency domain, i.e., from the primordial \acpBH surrounding Sagittarius A∗. Second, we investigate the complete \acSGWB contributions from extragalactic sources by modeling the event rate of primordial \acBH \acpEMRI throughout the cosmic redshift.
The rest of the paper is arranged as follows. In Section II we model the primordial \acpBH density profile around a massive \acBH, and apply this relation to the Sagittarius A∗ in the Milky Way to derive the \acSGWB energy density spectrum. We proceed to model the number density of massive \acpBH at different redshift epochs and calculate the \acSGWB spectrum from extragalactic sources in Section III. We forecast the ability of \acLISA for detecting the \acSGWB signal or, if there is a null result, constraining the abundance of primordial \acpBH in dark matter in Section IV. The results show that \acLISA can probe the existence of primordial \acpBH with mass range and constrain the abundance of primordial \acBH with to be in the optimal case where the dark-matter spike scenario with a steeper initial power index is valid. The main uncertainty is subject to the value of the dark-matter initial power index . We summarize the conclusions in Section V. Throughout this work we assume the mass distribution of primordial \acpBH is a delta function due to the uncertainty of the primordial \acBH population. Therefore the results should be seen as being from the primordial \acpBH with a representative mass. Actually, as will be shown in the following, the mass of primordial \acpBH only serves as a scaling factor for the amplitude of the resulting \acSGWB spectra and the shape of spectra only depends on the mass of the central massive \acpBH.
II The Stochastic Gravitational-Wave Background from Sagittarius A∗
II.1 Primordial Black Holes Density Profile
To model the event rate of primordial \acBH \acpEMRI, we first infer the primordial \acBH mass density at the galactic center. Since we expect that primordial \acpBH compose a part of dark matter, it is natural to use the dark-matter density profile to characterize the primordial \acBH mass density around the central massive \acBH.
For an initial dark-matter density profile with the following power law form
| (1) |
where and are halo parameters and to be determined, is the power index, is the radius of dark matter, Ref. Gondolo and Silk (1999) suggests that the adiabatic growth of the central massive \acBH can enhance the surrounding dark-matter density at galactic center and form a spike distribution, i.e., the halo will end up with the following density Gondolo and Silk (1999); Nishikawa et al. (2017)
| (2) |
where the power index is enhanced from the initial value by , the halo parameter with being the Schwarzschild radius of the central massive \acBH, is the radius to which the dark-matter spike extends, is derived numerically for different in Ref. Gondolo and Silk (1999). For an initial Navarro-Frenk-White (NFW) profile Navarro et al. (1996) with , the final spike has a index , thus significantly boosting the inner profile around the central massive \acBH.
To connect and with the massive \acBH’s property, we employ the relation among the dark-matter halo virial mass , the concentration parameter where is the halo virial radius, and the mass of massive \acBH . The relation of for NFW profile is given by Ref. Dutton and Macciò (2014)
| (3) |
where and are numerical factors at redshift . The parametrized formula Eq. 3 is obtained by numerically fitting to a suite of N-body simulations for NFW profile with Planck 2013 cosmological parameters Ade et al. (2014) in the redshift range .
The mass of the central massive \acpBH has a correlation with a few characteristic quantities of the host galaxy, such as the velocity dispersion in the spheroidal region and the total mass of the host galaxy, indicating a coevolution history with the whole galaxy. By employing the observational relation and using the quasar luminosity function to link with the halo mass, Ref. Croton (2009) gives a parametrized relation between the massive \acBH’s mass and the host dark-matter halo’s virial mass ,
| (4) |
Here is the Hubble parameter at redshift , and are the matter and dark energy fractional densities, respectively. is a ratio between the dark-matter halo’s circular velocity and virial velocity, whose value is of order unity. Eq. 3 together with Eq. 4 can fix the corresponding coefficients of NFW density profile and NFW induced spike profile given the mass of massive \acBH.
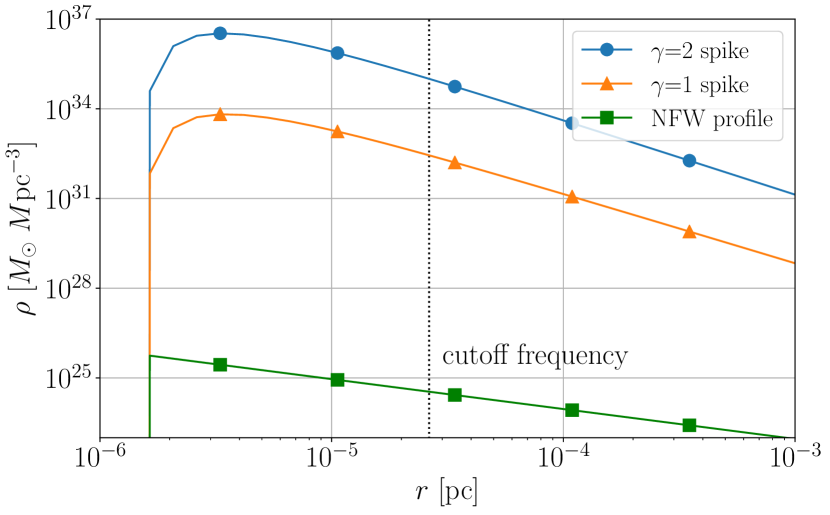
Fig. 1 shows the dark-matter spike profile around a massive \acBH with mass . Given the uncertainty of the initial profile power index, we choose two values for , for NFW profile and representing a steeper profile for an optimistic result. We observe that the dark-matter density near the galactic center is boosted significantly for the spike profile compared with the NFW profile. The spike has even larger density than by three orders of magnitude.
II.2 Stochastic Gravitational-Wave Background Spectrum
The fractional energy density spectrum of \acSGWB is defined as
| (5) |
where is the gravitational-wave energy density in the frequency band , is the critical energy to close the Universe, is the gravitational constant, is the speed of light.
The local energy density is related to the \acGW energy flux by . from Sagittarius A∗ can be derived by taking the integral of the density of primordial \acBH \acEMRI with respect to the orbital radius ,
| (6) |
where is the luminosity distance from sources to \acGW detectors, is the dark-matter density at radius to the center given , and are the primordial \acBH mass and abundance, is the symmetric mass ratio, is the total mass of the primordial \acBH \acEMRI system. To the leading order, \acGW power can be calculated by the quadrupole formula Peters and Mathews (1963); Peters (1964),
| (7) |
The radius can be equivalently replaced by the \acGW frequency under the assumption of Keplerian motion,
| (8) |
where the factor of accounts for the cosmological expansion and the \acGW frequency is twice of the orbital frequency. From Eq. 8 a differential relation can be derived ,
| (9) |
Applying Eq. 9 to Eq. 6 and using the condition , the differential \acGW power from Sagittarius A∗ is
| (10) |
Therefore the \acSGWB energy density spectrum is
| (11) |
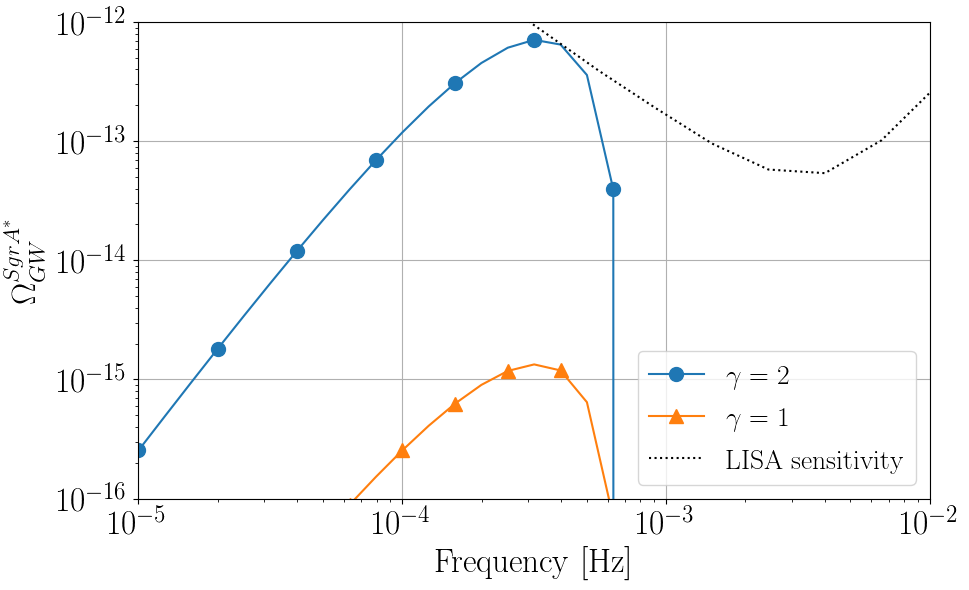
The mass of Sagittarius A∗ located at the center of the Milky Way is and the distance is kpc. Substitute the values to Eq. 11, the \acSGWB result is shown in Fig. 2 with and . Note that the term in Eq. 11 only serves as an overall scaling factor. We showcase two choices of the initial dark-matter profile power index, and , respectively. As a comparison, the LISA sensitivity curve of \acSGWB for the six links, 5 million km arm length configuration and 5 year mission duration (the optimal case) is plotted Caprini et al. (2016); Bartolo et al. (2016).
The figure shows that the amplitude of \acSGWB with is larger than that with by three orders of magnitude, inheriting from the three order of magnitude difference of the dark-matter halo density as shown in Fig. 1. Another feature is that the \acSGWB peaks at Hz, which is determined by the mass of the central massive \acBH given the dark-matter spike distribution.
It should also be noted that the \acSGWB from Sagittarius A∗ is a directional signal, but the sensitivity curve is for isotropic \acSGWB. Therefore the comparison only serves as an order of magnitude estimation due to the lack of a sensitivity curve of space-based detectors for a directional background, but note that the technique of \acGW radiometer and the sensitivity for a directional stochastic background for LIGO have been proposed and calculated by Refs. Ballmer (2006). The search for persistent \acGW signals from pointlike sources has been performed by Advanced Abbott et al. (2019b, 2017f) and Initial LIGO and Virgo Abadie et al. (2011). Especially, using the data from the first and second observational runs of Advanced LIGO and Virgo, the upper limits for \acGW strain amplitude have been given for three sources with targeting directions: Scorpius X-1, Supernova 1987 A and the Galactic Center, respectively. Refs. Ungarelli and Vecchio (2001); Kudoh et al. (2006) have considered the anisotropic \acSGWB search with space-based detectors. However, a specialized investigation for directional \acSGWB from primordial \acBH \acpEMRI at the Galactic center has not been achieved in the context of space-based \acGW detectors. We thus leave the relevant study as a future work.
III The Stochastic Gravitational-Wave Background from Extragalactic Sources
III.1 Massive Black Hole Population
To model the massive \acBH population throughout the cosmic history, we employ the dark-matter halo mass function and the relation which is characterized by Eq. 4. We choose the halo mass function in Ref. Reed et al. (2007) which calibrates with a suite of cosmological N-body simulations and takes the finite box size and the cosmic variance effects into account. In the actual practice this halo mass function is generated through invoking the Reed07 model in the python package hmf (an acronym for “halo mass function”) Murray et al. (2013), where the cosmological parameters are set to be the value of the Planck satellite’s 2018 results Aghanim et al. (2018). Reed07 model is shown to be valid up to redshift and for halos with masses Reed et al. (2007), which is sufficient for our purpose.
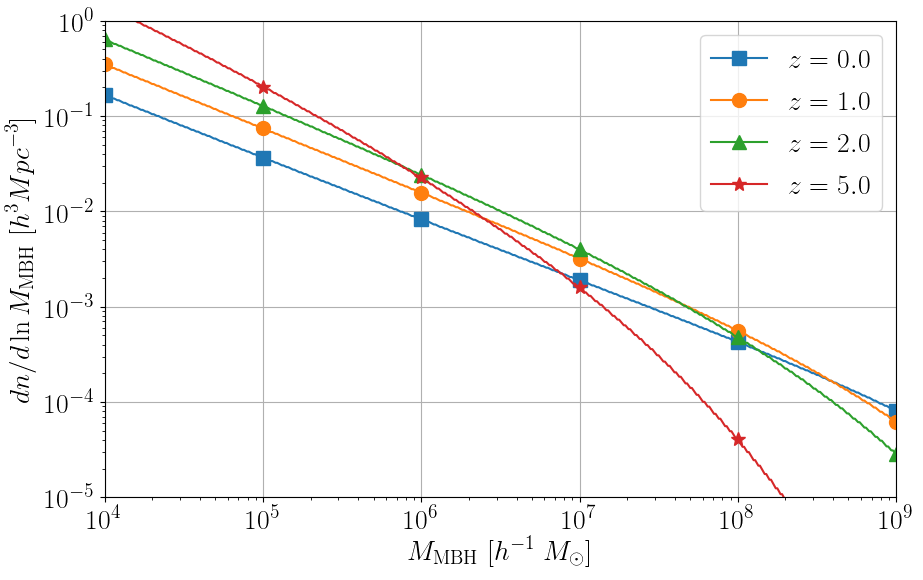
Fig. 3 shows our results of the number density for massive \acpBH in different redshifts. Since astronomical observations have confirmed the existence of massive \acpBH with (for example see Ref. Woo et al. (2019)), we will consider the \acSGWB spectrum from the massive \acpBH in the mass range as a fiducial model. The upper mass limit is determined by the condition that the emitted \acpGW are in the LISA sensitive band and is sufficient for this purpose.
III.2 Stochastic Gravitational-Wave Background Spectrum
The complete \acSGWB contribution can be obtained by taking the sum from the \acpEMRI of all extragalactic massive \acpBH
| (12) |
where is the number density of massive \acpBH and is the sources’ comoving distance. Combining Eq. 10 and Eq. 12 yields
| (13) | ||||
As a fiducial model, we consider the sources in the redshift range . Contributions from higher redshift can be negligible as will be indicated in Section III.4.
With and , the results of extragalactic \acSGWB with and are shown in Fig. 4. The results from Sagittarius A∗ are also replotted for comparison. The extragalactic \acSGWB peaks at a higher frequency ( Hz), due to the contributions from \acpBH less massive than Sagittarius A∗.
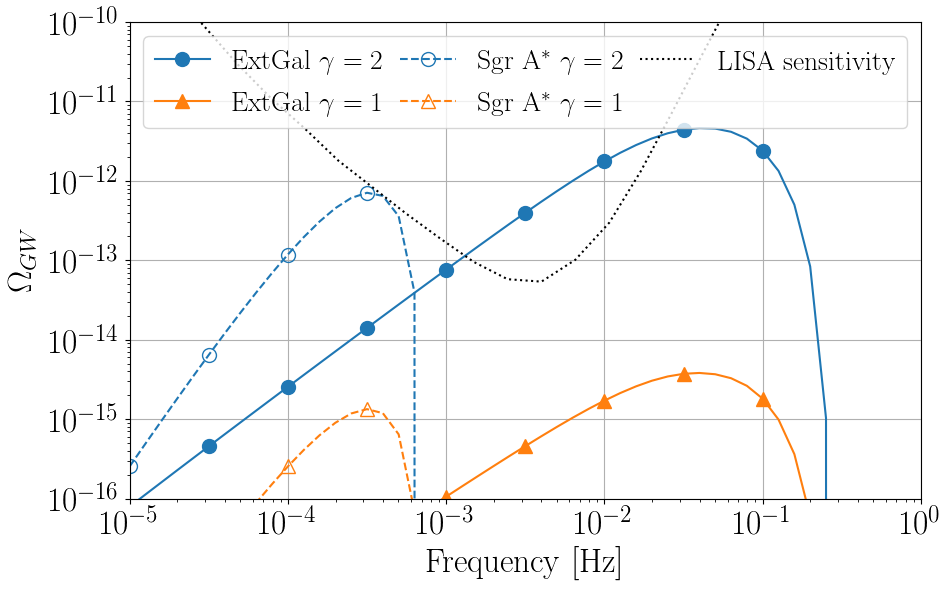
Note that the extragalactic \acSGWB is an isotropic signal, and thus can be compared with the \acLISA sensitivity curve directly. It shows that the amplitude of extragalactic \acSGWB for already reaches the detectable zone, which means that the future LISA searching results can probe the abundance of primordial \acpBH to be as low as for the case. The amplitude of \acSGWB is smaller by three orders of magnitude due to a smaller dark-matter density profile.
The main uncertainty comes from the dark-matter initial profile power index. Future astrophysical progress on understanding the dark-matter profile at galactic center can shed light on a more robust prediction on the primordial \acBH \acpEMRI event rate. Conversely, future \acGW search with space-based detectors can also be beneficial for study for the dark-matter profile.
III.3 Density Enhancement due to Gravitational-Wave Dissipation
Another consideration is that the orbit of inspiraling primordial \acpBH will gradually decay due to \acGW dissipation. As a consequence, the primordial \acBH density profile gets further concentrated. To quantify this effect, we notice that astrophysical spectroscopy surveys have confirmed that the first galaxies form at redshift (13 Gyr from now) Yajima et al. (2017). Therefore we make the extreme assumption that all the primordial \acpBH \acpEMRI start to decay at , thus the decay duration equals to 13 Gyr, to obtain an upper limit of the dark-matter density profile after concentration.
The relation among the orbital decay duration , the final orbit radius and the initial radius is given by Refs. Peters (1964); Peters and Mathews (1963) as follows
| (14) |
Let Gyr and employ the mass conservation relation 222We have numerically verified that the mass loss due to \acGW dissipation is negligible by comparing the \acGW energy with the mass energy of primordial \acpBH.
| (15) |
the enhanced density profile can be determined from the initial dark-matter profile which is assumed to the spike distribution.
For comparison, we also consider a less optimistic case where the orbital decay duration is an average of a flat distribution which ranges from zero to 13 Gyr, i.e., the primordial \acBH final orbital radius after \acGW dissipation can be determined by with the following expression
| (16) |
However, we find numerically that the relative difference of the resulting \acSGWB spectra between the most optimistic case (i.e., =13 Gyr) and the less-optimistic case is negligibly small and at most ; therefore we will only consider the most optimistic case in the following as a representative of the \acGW dissipation effect.
Choosing , the fiducial \acSGWB result without density enhancement for and the \acSGWB spectra with density enhancement for and , respectively, are shown in Fig. 5. For the enhanced \acSGWB results, the primordial \acBH abundance is modified accordingly to keep . Since \acGW dissipation makes primordial \acpBH get concentrated and closer to the center, the amplitude of \acSGWB spectra gets boosted and the frequency of the peak changes to Hz. As the mass of primordial \acpBH decreases, the amplitude boost becomes more significant. The amplitude for is larger than the fiducial result by one order of magnitude. This can be expected from Eq. 14 that a smaller value of symmetric mass ratio leads to a more significant orbital decay.

III.4 Modeling Systematics of the Massive Black Hole Population
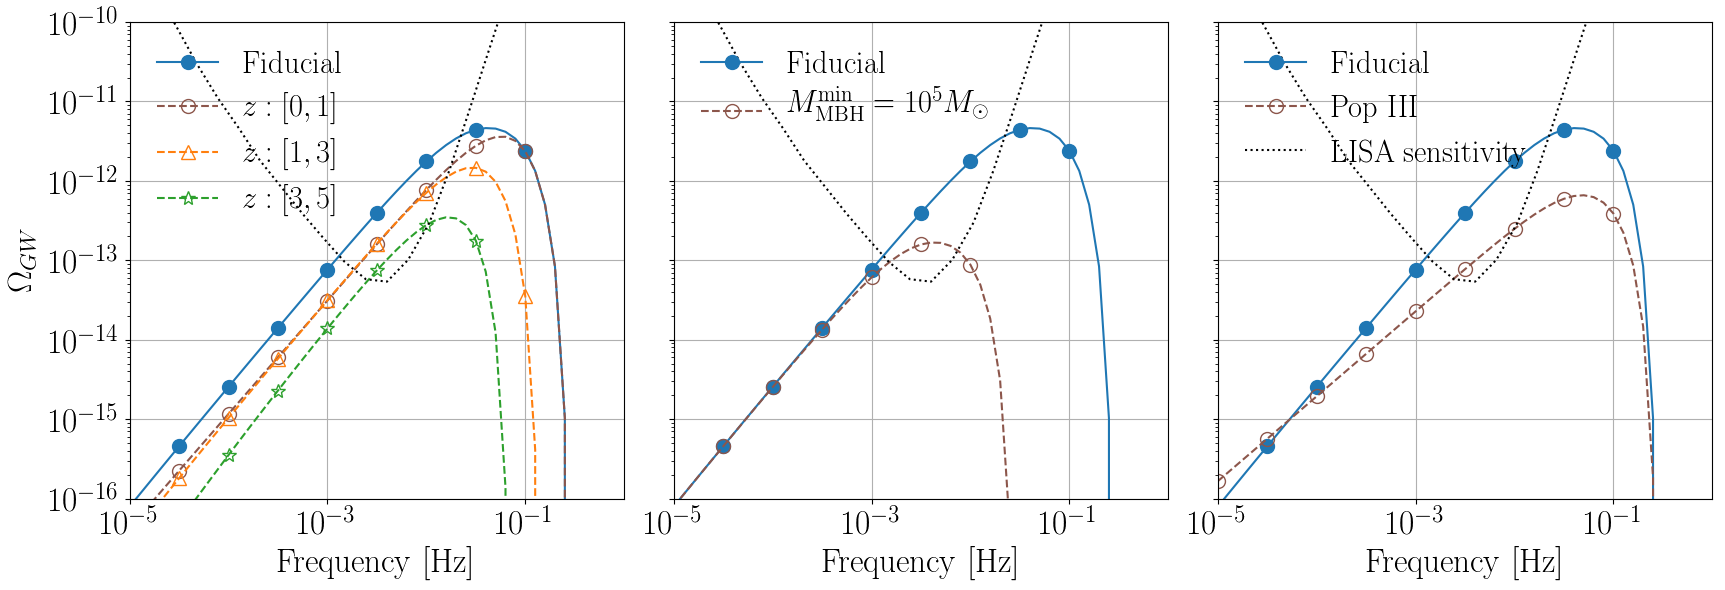
To investigate the systematics on modeling the extragalactic massive \acBH population, we vary the redshift integral limits, the lower mass of massive \acpBH and the massive \acBH population model, respectively, and plot the corresponding \acSGWB spectra. The results are shown in Fig. 6. All \acSGWB spectra are calculated from dark-matter spike distribution and , .
III.4.1 The Redshift Limits of the Integral
The left column of Fig. 6 shows the \acSGWB component contributions from different redshift ranges, , and , respectively. The fiducial result is the sum, i.e., obtained from the redshift range . We can see that the contribution from is subdominant and accounts for at most of the fiducial result. We thus conclude that the choice of for the redshift upper limit is sufficient to capture the dominant contribution.
III.4.2 The Lower Mass Cutoff of the Massive Black Holes
As mentioned, we chose to be the minimum mass of massive \acpBH to account for the existence of such massive \acpBH from astronomical observations. Nevertheless we change this value to to investigate the contribution from different mass ranges. The result is shown in the middle column of Fig. 6. Compared with the fiducial result whose lower mass cutoff is , the result shows that the \acSGWB contributed by massive \acpBH is mainly in the relative high frequency range Hz. Therefore the shape of the \acSGWB spectrum, especially the frequency of the peak, can provide information of the underlying massive \acBH population.
III.4.3 The Population Model of Massive Black Holes
A third investigation is to substitute the massive \acBH population model derived from the Reed07 dark-matter halo mass function to that proposed by Refs .Barausse (2012); Sesana et al. (2014); Antonini et al. (2015a, b) accounting for the massive \acpBH formed from population III star seeds. The number density of massive \acpBH of this model is
| (17) |
The right column of Fig. 6 presents the results. It shows that the amplitude of the peak is one order of magnitude smaller than the fiducial model. This is because the number density of massive \acpBH with mass from Eq. 17 is less than that from the Reed07 derived population.
The above investigations give a quantitative measurement about the effect on \acSGWB spectra from different modeling systematics of extragalactic massive \acBH, which can be improved in the future once a better understanding of the population of massive \acpBH is obtained. In addition, the future \acSGWB search with space-based detectors can serve as a tool to probe the population information of massive \acpBH.
IV Constraints on Primordial Black Hole Abundance
By comparing the \acSGWB spectrum with the LISA sensitivity and applying the condition
| (18) |
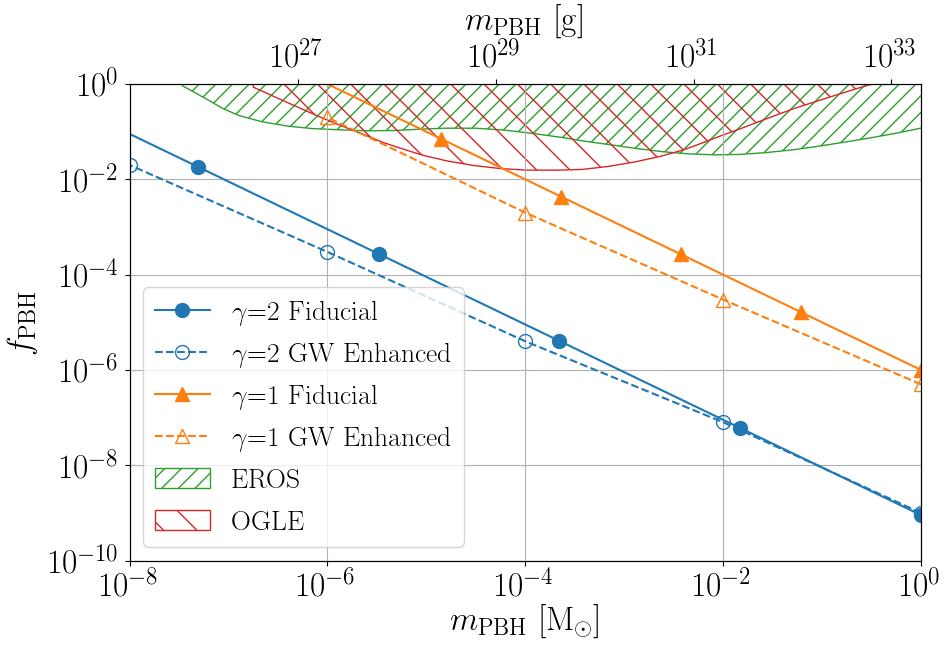
the upper limit on primordial \acBH abundance can be obtained for a null searching result. In Fig. 7, we plot the results for different primordial \acBH masses from the models of , , with and without the enhancement due to \acGW dissipation, respectively. As a comparison, we also plot the current constraint from the microlensing search collaborations OGLE Niikura et al. (2019) and EROS Tisserand et al. (2007).
It shows that LISA can probe the primordial \acBH abundance in a large range of masses, for and for , respectively. We do not consider more massive primordial \acpBH because it may break the condition of extreme mass ratio. For primordial \acpBH with , LISA can constrain the abundance to be () or (). The enhancement effect due to \acGW dissipation can further improve the constraint at the lower end of the mass range. This would be the most sensitive method proposed and quantified by now for detecting or constraining subsolar mass primordial \acpBH.
V Conclusions
In this work we have investigated the \acSGWB from primordial \acBH \acpEMRI surrounding Sagittarius A∗ and the extragalactic massive \acpBH, respectively, expanding the previous work of Ref. Kühnel et al. (2017); Kuhnel et al. (2018) by including the complete extragalactic contribution. After modeling the event rate, the \acSGWB energy density spectra are calculated. The contributions from Sagittarius A∗ and extragalactic massive \acpBH peak at different characteristic frequencies. Future space-based \acGW detectors such as LISA may utilize this feature to give decisive evidence about the existence of primordial \acBH dark matter at the galactic center. Finally, LISA can also constrain the abundance of primordial \acBH in dark matter if there will be a null \acSGWB searching result. For a NFW induced dark-matter spike profile (), LISA can exclude the existence of primordial \acBH with any abundance greater than of dark matter. A steeper dark-matter profile power index can make the constraint even tighter by three orders of magnitude. This renders \acpGW in the space-based frequency band a powerful tool to hunting for subsolar mass primordial \acpBH. However, modeling uncertainties exist from the dark-matter spike profile power index and the extragalactic massive \acpBH population as quantified in Section III. Future astrophysical progress on understanding these modeling systematics can help further improve the ability of the \acGW window to search for primordial \acpBH. In addition, as a future work, we will apply the specialized technique of the \acGW radiometer on the LISA detector to investigate the detection ability for the directional \acEMRI background from Sagittarius A∗. It would also be interesting to study whether the stochastic background is continuous or popcorn Rosado (2011); Regimbau and Hughes (2010), thereby applying different optimal detection strategies accordingly Smith and Thrane (2018).
Acknowledgements.
Q.-G.H. is supported by grants from NSFC (Grants No. 11690021, No. 11975019, No. 11947302, No. 11991053), the Strategic Priority Research Program of Chinese Academy of Sciences (Grants No. XDB23000000, No. XDA15020701), and Key Research Program of Frontier Sciences, CAS, Grant No. ZDBS-LY-7009. T.G.F.L. is partially supported by grants from the Research Grants Council of the Hong Kong (Project No. 24304317), Research Committee of the Chinese University of Hong Kong and the Croucher Foundation of Hong Kong.References
- Abbott et al. (2016a) B. P. Abbott et al. (Virgo, LIGO Scientific), “Observation of Gravitational Waves from a Binary Black Hole Merger,” Phys. Rev. Lett. 116, 061102 (2016a), arXiv:1602.03837 [gr-qc] .
- Abbott et al. (2016b) B. P. Abbott et al. (Virgo, LIGO Scientific), “GW151226: Observation of Gravitational Waves from a 22-Solar-Mass Binary Black Hole Coalescence,” Phys. Rev. Lett. 116, 241103 (2016b), arXiv:1606.04855 [gr-qc] .
- Abbott et al. (2016c) B. P. Abbott et al. (Virgo, LIGO Scientific), “Binary Black Hole Mergers in the first Advanced LIGO Observing Run,” Phys. Rev. X6, 041015 (2016c), arXiv:1606.04856 [gr-qc] .
- Abbott et al. (2017a) Benjamin P. Abbott et al. (VIRGO, LIGO Scientific), “GW170104: Observation of a 50-Solar-Mass Binary Black Hole Coalescence at Redshift 0.2,” Phys. Rev. Lett. 118, 221101 (2017a), arXiv:1706.01812 [gr-qc] .
- Abbott et al. (2017b) B. P. Abbott et al. (Virgo, LIGO Scientific), “GW170814: A Three-Detector Observation of Gravitational Waves from a Binary Black Hole Coalescence,” Phys. Rev. Lett. 119, 141101 (2017b), arXiv:1709.09660 [gr-qc] .
- Abbott et al. (2017c) B. P. Abbott et al. (Virgo, LIGO Scientific), “GW170817: Observation of Gravitational Waves from a Binary Neutron Star Inspiral,” Phys. Rev. Lett. 119, 161101 (2017c), arXiv:1710.05832 [gr-qc] .
- Abbott et al. (2017d) B. P. Abbott et al. (Virgo, LIGO Scientific), “GW170608: Observation of a 19-solar-mass Binary Black Hole Coalescence,” (2017d), arXiv:1711.05578 [astro-ph.HE] .
- Abbott et al. (2018a) B. P. Abbott et al. (LIGO Scientific, Virgo), “GWTC-1: A Gravitational-Wave Transient Catalog of Compact Binary Mergers Observed by LIGO and Virgo during the First and Second Observing Runs,” (2018a), arXiv:1811.12907 [astro-ph.HE] .
- Abbott et al. (2018b) B. P. Abbott et al. (LIGO Scientific, Virgo), “Binary Black Hole Population Properties Inferred from the First and Second Observing Runs of Advanced LIGO and Advanced Virgo,” (2018b), arXiv:1811.12940 [astro-ph.HE] .
- Bird et al. (2016) Simeon Bird, Ilias Cholis, Julian B. Muñoz, Yacine Ali-Haïmoud, Marc Kamionkowski, Ely D. Kovetz, Alvise Raccanelli, and Adam G. Riess, “Did ligo detect dark matter?” Phys. Rev. Lett. 116, 201301 (2016).
- Clesse and García-Bellido (2016a) Sebastien Clesse and Juan García-Bellido, “The clustering of massive Primordial Black Holes as Dark Matter: measuring their mass distribution with Advanced LIGO,” Phys. Dark Univ. 10, 002 (2016a), arXiv:1603.05234 [astro-ph.CO] .
- Sasaki et al. (2016) Misao Sasaki, Teruaki Suyama, Takahiro Tanaka, and Shuichiro Yokoyama, “Primordial Black Hole Scenario for the Gravitational-Wave Event GW150914,” Phys. Rev. Lett. 117, 061101 (2016), arXiv:1603.08338 [astro-ph.CO] .
- Chen and Huang (2018) Zu-Cheng Chen and Qing-Guo Huang, “Merger Rate Distribution of Primordial-Black-Hole Binaries,” Astrophys. J. 864, 61 (2018), arXiv:1801.10327 [astro-ph.CO] .
- Hawking (1971) Stephen Hawking, “Gravitationally collapsed objects of very low mass,” Mon. Not. Roy. Astron. Soc. 152, 75 (1971).
- Carr and Hawking (1974) Bernard J. Carr and S. W. Hawking, “Black holes in the early Universe,” Mon. Not. Roy. Astron. Soc. 168, 399–415 (1974).
- Dolgov and Silk (1993) Alexandre Dolgov and Joseph Silk, “Baryon isocurvature fluctuations at small scales and baryonic dark matter,” Phys. Rev. D 47, 4244–4255 (1993).
- Jedamzik (1997) Karsten Jedamzik, “Primordial black hole formation during the QCD epoch,” Phys. Rev. D55, 5871–5875 (1997), arXiv:astro-ph/9605152 [astro-ph] .
- Carr et al. (2016) Bernard Carr, Florian Kuhnel, and Marit Sandstad, “Primordial Black Holes as Dark Matter,” Phys. Rev. D94, 083504 (2016), arXiv:1607.06077 [astro-ph.CO] .
- Sasaki et al. (2018) Misao Sasaki, Teruaki Suyama, Takahiro Tanaka, and Shuichiro Yokoyama, “Primordial black holes—perspectives in gravitational wave astronomy,” Class. Quant. Grav. 35, 063001 (2018), arXiv:1801.05235 [astro-ph.CO] .
- Belotsky et al. (2019) Konstantin M. Belotsky, Vyacheslav I. Dokuchaev, Yury N. Eroshenko, Ekaterina A. Esipova, Maxim Yu. Khlopov, Leonid A. Khromykh, Alexander A. Kirillov, Valeriy V. Nikulin, Sergey G. Rubin, and Igor V. Svadkovsky, “Clusters of primordial black holes,” Eur. Phys. J. C79, 246 (2019), arXiv:1807.06590 [astro-ph.CO] .
- Ketov and Khlopov (2019) Sergei V. Ketov and Maxim Yu. Khlopov, “Cosmological Probes of Supersymmetric Field Theory Models at Superhigh Energy Scales,” Symmetry 11, 511 (2019).
- Montero-Camacho et al. (2019) Paulo Montero-Camacho, Xiao Fang, Gabriel Vasquez, Makana Silva, and Christopher M. Hirata, “Revisiting constraints on asteroid-mass primordial black holes as dark matter candidates,” JCAP 1908, 031 (2019), arXiv:1906.05950 [astro-ph.CO] .
- Abbott et al. (2018c) B. P. Abbott et al. (LIGO Scientific, Virgo), “Search for Subsolar-Mass Ultracompact Binaries in Advanced LIGO’s First Observing Run,” Phys. Rev. Lett. 121, 231103 (2018c), arXiv:1808.04771 [astro-ph.CO] .
- Abbott et al. (2019a) B. P. Abbott et al. (LIGO Scientific, Virgo), “Search for Subsolar Mass Ultracompact Binaries in Advanced LIGO’s Second Observing Run,” Phys. Rev. Lett. 123, 161102 (2019a), arXiv:1904.08976 [astro-ph.CO] .
- Kormendy and Ho (2013) John Kormendy and Luis C. Ho, “Coevolution (Or Not) of Supermassive Black Holes and Host Galaxies,” Ann. Rev. Astron. Astrophys. 51, 511–653 (2013), arXiv:1304.7762 [astro-ph.CO] .
- Kormendy and Richstone (1995) John Kormendy and Douglas Richstone, “Inward bound: The Search for supermassive black holes in galactic nuclei,” Ann. Rev. Astron. Astrophys. 33, 581 (1995).
- Babak et al. (2017) Stanislav Babak, Jonathan Gair, Alberto Sesana, Enrico Barausse, Carlos F. Sopuerta, Christopher P. L. Berry, Emanuele Berti, Pau Amaro-Seoane, Antoine Petiteau, and Antoine Klein, “Science with the space-based interferometer LISA. V: Extreme mass-ratio inspirals,” Phys. Rev. D95, 103012 (2017), arXiv:1703.09722 [gr-qc] .
- Amaro-Seoane and Preto (2011) Pau Amaro-Seoane and Miguel Preto, “The impact of realistic models of mass segregation on the event rate of extreme-mass ratio inspirals and cusp re-growth,” Laser interferometer space antenna. Proceedings, 8th International LISA Symposium, Stanford, USA, June 28-July 2, 2010, Class. Quant. Grav. 28, 094017 (2011), arXiv:1010.5781 [astro-ph.CO] .
- Barack and Cutler (2007) Leor Barack and Curt Cutler, “Using LISA EMRI sources to test off-Kerr deviations in the geometry of massive black holes,” Phys. Rev. D75, 042003 (2007), arXiv:gr-qc/0612029 [gr-qc] .
- Gair et al. (2013) Jonathan R. Gair, Michele Vallisneri, Shane L. Larson, and John G. Baker, “Testing General Relativity with Low-Frequency, Space-Based Gravitational-Wave Detectors,” Living Rev. Rel. 16, 7 (2013), arXiv:1212.5575 [gr-qc] .
- Regimbau (2011) Tania Regimbau, “The astrophysical gravitational wave stochastic background,” Res. Astron. Astrophys. 11, 369–390 (2011), arXiv:1101.2762 [astro-ph.CO] .
- Romano and Cornish (2017) Joseph D. Romano and Neil. J. Cornish, “Detection methods for stochastic gravitational-wave backgrounds: a unified treatment,” Living Reviews in Relativity 20, 2 (2017).
- Abbott et al. (2016d) B. P. Abbott et al. (Virgo, LIGO Scientific), “GW150914: Implications for the stochastic gravitational wave background from binary black holes,” Phys. Rev. Lett. 116, 131102 (2016d), arXiv:1602.03847 [gr-qc] .
- Abbott et al. (2017e) Benjamin P. Abbott et al. (Virgo, LIGO Scientific), “Upper Limits on the Stochastic Gravitational-Wave Background from Advanced LIGO’s First Observing Run,” Phys. Rev. Lett. 118, 121101 (2017e), arXiv:1612.02029 [gr-qc] .
- Abbott et al. (2018d) Benjamin P. Abbott et al. (Virgo, LIGO Scientific), “GW170817: Implications for the Stochastic Gravitational-Wave Background from Compact Binary Coalescences,” Phys. Rev. Lett. 120, 091101 (2018d), arXiv:1710.05837 [gr-qc] .
- Mandic et al. (2016) Vuk Mandic, Simeon Bird, and Ilias Cholis, “Stochastic Gravitational-Wave Background due to Primordial Binary Black Hole Mergers,” Phys. Rev. Lett. 117, 201102 (2016), arXiv:1608.06699 [astro-ph.CO] .
- Wang et al. (2018) Sai Wang, Yi-Fan Wang, Qing-Guo Huang, and Tjonnie G. F. Li, “Constraints on the Primordial Black Hole Abundance from the First Advanced LIGO Observation Run Using the Stochastic Gravitational-Wave Background,” Phys. Rev. Lett. 120, 191102 (2018), arXiv:1610.08725 [astro-ph.CO] .
- Chen et al. (2018) Zu-Cheng Chen, Fan Huang, and Qing-Guo Huang, “Stochastic Gravitational-Wave Background from Binary Black Holes and Binary Neutron Stars,” (2018), arXiv:1809.10360 [gr-qc] .
- Clesse and García-Bellido (2016b) Sebastien Clesse and Juan García-Bellido, “Detecting the gravitational wave background from primordial black hole dark matter,” (2016b), arXiv:1610.08479 [astro-ph.CO] .
- Kühnel et al. (2017) Florian Kühnel, Glenn D. Starkman, and Katherine Freese, “Primordial Black-Hole and Macroscopic Dark-Matter Constraints with LISA,” (2017), arXiv:1705.10361 [gr-qc] .
- Kuhnel et al. (2018) Florian Kuhnel, Andrew Matas, Glenn D. Starkman, and Katherine Freese, “Waves from the Centre: Probing PBH and other Macroscopic Dark Matter with LISA,” (2018), arXiv:1811.06387 [gr-qc] .
- Gondolo and Silk (1999) Paolo Gondolo and Joseph Silk, “Dark matter annihilation at the galactic center,” Phys. Rev. Lett. 83, 1719–1722 (1999).
- Nishikawa et al. (2017) Hiroya Nishikawa, Ely D. Kovetz, Marc Kamionkowski, and Joseph Silk, “Primordial-black-hole mergers in dark-matter spikes,” (2017), arXiv:1708.08449 [astro-ph.CO] .
- Navarro et al. (1996) Julio F. Navarro, Carlos S. Frenk, and Simon D. M. White, “The Structure of cold dark matter halos,” Astrophys. J. 462, 563–575 (1996), arXiv:astro-ph/9508025 [astro-ph] .
- Dutton and Macciò (2014) Aaron A. Dutton and Andrea V. Macciò, “Cold dark matter haloes in the Planck era: evolution of structural parameters for Einasto and NFW profiles,” Mon. Not. Roy. Astron. Soc. 441, 3359–3374 (2014), arXiv:1402.7073 [astro-ph.CO] .
- Ade et al. (2014) P. A. R. Ade et al. (Planck), “Planck 2013 results. XVI. Cosmological parameters,” Astron. Astrophys. 571, A16 (2014), arXiv:1303.5076 [astro-ph.CO] .
- Croton (2009) Darren J. Croton, “A simple model to link the properties of quasars to the properties of dark matter halos out to high redshift,” Mon. Not. Roy. Astron. Soc. 394, 1109–1119 (2009), arXiv:0901.4104 [astro-ph.CO] .
- Peters and Mathews (1963) P. C. Peters and J. Mathews, “Gravitational radiation from point masses in a keplerian orbit,” Phys. Rev. 131, 435–440 (1963).
- Peters (1964) P. C. Peters, “Gravitational radiation and the motion of two point masses,” Phys. Rev. 136, B1224–B1232 (1964).
- Caprini et al. (2016) Chiara Caprini et al., “Science with the space-based interferometer eLISA. II: Gravitational waves from cosmological phase transitions,” JCAP 1604, 001 (2016), arXiv:1512.06239 [astro-ph.CO] .
- Bartolo et al. (2016) Nicola Bartolo et al., “Science with the space-based interferometer LISA. IV: Probing inflation with gravitational waves,” JCAP 1612, 026 (2016), arXiv:1610.06481 [astro-ph.CO] .
- Ballmer (2006) Stefan W. Ballmer, “A Radiometer for stochastic gravitational waves,” Gravitational waves. Proceedings, 6th Edoardo Amaldi Conference, Amaldi6, Bankoku Shinryoukan, June 20-24, 2005, Class. Quant. Grav. 23, S179–S186 (2006), arXiv:gr-qc/0510096 [gr-qc] .
- Abbott et al. (2019b) B. P. Abbott et al. (LIGO Scientific, Virgo), “Directional limits on persistent gravitational waves using data from Advanced LIGO’s first two observing runs,” Phys. Rev. D100, 062001 (2019b), arXiv:1903.08844 [gr-qc] .
- Abbott et al. (2017f) Benjamin P. Abbott et al. (LIGO Scientific, Virgo), “Directional Limits on Persistent Gravitational Waves from Advanced LIGO’s First Observing Run,” Phys. Rev. Lett. 118, 121102 (2017f), arXiv:1612.02030 [gr-qc] .
- Abadie et al. (2011) J. Abadie et al. (LIGO Scientific), “Directional limits on persistent gravitational waves using LIGO S5 science data,” Phys. Rev. Lett. 107, 271102 (2011), arXiv:1109.1809 [astro-ph.CO] .
- Ungarelli and Vecchio (2001) Carlo Ungarelli and Alberto Vecchio, “Studying the anisotropy of the gravitational wave stochastic background with LISA,” Phys. Rev. D64, 121501 (2001), arXiv:astro-ph/0106538 [astro-ph] .
- Kudoh et al. (2006) Hideaki Kudoh, Atsushi Taruya, Takashi Hiramatsu, and Yoshiaki Himemoto, “Detecting a gravitational-wave background with next-generation space interferometers,” Phys. Rev. D73, 064006 (2006), arXiv:gr-qc/0511145 [gr-qc] .
- Reed et al. (2007) Darren Reed, Richard Bower, Carlos Frenk, Adrian Jenkins, and Tom Theuns, “The halo mass function from the dark ages through the present day,” Mon. Not. Roy. Astron. Soc. 374, 2–15 (2007), arXiv:astro-ph/0607150 [astro-ph] .
- Murray et al. (2013) Steven Murray, Chris Power, and Aaron Robotham, “HMFcalc: An Online Tool for Calculating Dark Matter Halo Mass Functions,” (2013), arXiv:1306.6721 [astro-ph.CO] .
- Aghanim et al. (2018) N. Aghanim et al. (Planck), “Planck 2018 results. VI. Cosmological parameters,” (2018), arXiv:1807.06209 [astro-ph.CO] .
- Woo et al. (2019) Jong-Hak Woo, Hojin Cho, Elena Gallo, Edmund Hodges-Kluck, Huynh Anh N. Le, Jaejin Shin, Donghoon Son, and John C. Horst, “A 10,000-solar-mass black hole in the nucleus of a bulgeless dwarf galaxy,” Nature Astronomy 3, 755–759 (2019), arXiv:1905.00145 [astro-ph.GA] .
- Yajima et al. (2017) Hidenobu Yajima, Kentaro Nagamine, Qirong Zhu, Sadegh Khochfar, and Claudio Dalla Vecchia, “Growth of First Galaxies: Impacts of Star Formation and Stellar Feedback,” Astrophys. J. 846, 30 (2017), arXiv:1704.03117 [astro-ph.GA] .
- Barausse (2012) Enrico Barausse, “The evolution of massive black holes and their spins in their galactic hosts,” Mon. Not. Roy. Astron. Soc. 423, 2533–2557 (2012), arXiv:1201.5888 [astro-ph.CO] .
- Sesana et al. (2014) A. Sesana, E. Barausse, M. Dotti, and E. M. Rossi, “Linking the spin evolution of massive black holes to galaxy kinematics,” Astrophys. J. 794, 104 (2014), arXiv:1402.7088 [astro-ph.CO] .
- Antonini et al. (2015a) Fabio Antonini, Enrico Barausse, and Joseph Silk, “The imprint of massive black-hole mergers on the correlation between nuclear star clusters and their host galaxies,” Astrophys. J. 806, L8 (2015a), arXiv:1504.04033 [astro-ph.GA] .
- Antonini et al. (2015b) Fabio Antonini, Enrico Barausse, and Joseph Silk, “The Coevolution of Nuclear Star Clusters, Massive Black Holes, and their Host Galaxies,” Astrophys. J. 812, 72 (2015b), arXiv:1506.02050 [astro-ph.GA] .
- Niikura et al. (2019) Hiroko Niikura, Masahiro Takada, Shuichiro Yokoyama, Takahiro Sumi, and Shogo Masaki, “Constraints on Earth-mass primordial black holes from OGLE 5-year microlensing events,” Phys. Rev. D99, 083503 (2019), arXiv:1901.07120 [astro-ph.CO] .
- Tisserand et al. (2007) P. Tisserand et al. (EROS-2), “Limits on the Macho Content of the Galactic Halo from the EROS-2 Survey of the Magellanic Clouds,” Astron. Astrophys. 469, 387–404 (2007), arXiv:astro-ph/0607207 [astro-ph] .
- Rosado (2011) Pablo A. Rosado, “Gravitational wave background from binary systems,” Phys. Rev. D84, 084004 (2011), arXiv:1106.5795 [gr-qc] .
- Regimbau and Hughes (2010) T. Regimbau and Scott A. Hughes, “Confusion background from compact binaries,” Gravitational waves. Proceedings, 8th Edoardo Amaldi Conference, Amaldi 8, New York, USA, June 22-26, 2009, J. Phys. Conf. Ser. 228, 012009 (2010), arXiv:0911.1043 [gr-qc] .
- Smith and Thrane (2018) Rory Smith and Eric Thrane, “Optimal search for an astrophysical gravitational-wave background,” Phys. Rev. X 8, 021019 (2018).