1 European Southern Observatory, Karl-Schwarzschild-Str. 2, D-85748 Garching Near Munich, Germany
Cold neutral hydrogen gas in galaxies
Abstract
This review summarizes recent studies of the cold neutral hydrogen gas associated with galaxies probed via the H i 21-cm absorption line. H i 21-cm absorption against background radio-loud quasars is a powerful tool to study the neutral gas distribution and kinematics in foreground galaxies from kilo-parsec to parsec scales. At low redshifts (), it has been used to characterize the distribution of high column density neutral gas around galaxies and study the connection of this gas with the galaxy’s optical properties. The neutral gas around galaxies has been found to be patchy in distribution, with variations in optical depth observed at both kilo-parsec and parsec scales. At high redshifts (), H i 21-cm absorption has been used to study the neutral gas in metal or absorption-selected galaxies. It has been found to be closely linked with the metal and dust content of the gas. Trends of various properties like incidence, spin temperature and velocity width of H i 21-cm absorption with redshift have been studied, which imply evolution of cold gas properties in galaxies with cosmic time. Upcoming large blind surveys of H i 21-cm absorption with next generation radio telescopes are expected to determine accurately the redshift evolution of the number density of H i 21-cm absorbers per unit redshift and hence understand what drives the global star formation rate density evolution.
keywords:
galaxies—absorption lines—interstellar medium.rdutta@eso.org
12.3456/s78910-011-012-3 \artcitid#### \volnum000 0000 \pgrange1– \lp1
1 Introduction
The interstellar medium (ISM) of a galaxy is a complex and dynamic system with constant interplay of matter, momentum and energy between the various ISM phases and the stars. The phase structure of the ISM is hence a direct probe of various complex astrophysical processes that take place inside a galaxy. In addition, the ISM mediates between the stellar- and the galactic-scale processes. The accreting ionized gas from the intergalactic medium (IGM) passes though the different ISM phases before getting converted to stars. On the other hand, galactic winds, outflows and fountains populate the IGM with metals. Diffuse ionized hydrogen gas and metals have been observed to extend up to few hundreds of kilo-parsec around galaxies, constituting the circumgalactic medium (CGM; Tumlinson et al., 2017). The large-scale multi-phase gas distribution in the CGM around galaxies, due to infalls, outflows and mergers, is again intricately linked with the ISM and the star formation in galaxies. Therefore, the ISM and CGM phases are expected to contain an imprint of the collective outcome of all the processes that shape the star formation history of the Universe (Hopkins & Beacom, 2006).
In this review, we focus on the neutral gas phase in and around galaxies. In particular, we review studies of the cold neutral hydrogen gas as probed using the tool of H i 21-cm absorption. In Sections 2 and 3, we introduce the neutral gas phase and H i 21-cm absorption, respectively. We discuss results from studies of distribution of cold neutral gas around low- galaxies in Section 4, dependence of cold neutral gas on metals and dust at high- in Section 5, and the redshift evolution of cold gas properties in Section 6 We conclude by discussing future prospects in Section 7
2 The neutral gas phase
The neutral gas phase in and around galaxies act as the intermediary phase between the accreting ionized gas from the IGM and the molecular gas phase in the stellar disc that gets converted to stars. It thus is the reservoir from which molecules and stars form and consequently plays a crucial role in galaxy formation and evolution. The H i disc around galaxies is the component that gets affected the most by tidal interactions and mergers, since it is more extended than the stellar disc, typically by more than a factor of two (Haynes et al., 1979; Rosenberg & Schneider, 2002; Oosterloo et al., 2007; Sancisi et al., 2008; Chung et al., 2009; Mihos et al., 2012). Therefore, in the hierarchical structure formation models, galaxy formation is expected to leave its imprint on the atomic gas mass density and its evolution with redshift.
The neutral gas exists in two dominant phases, the cold neutral medium (CNM; K, cm-3) and the warm neutral medium (WNM; K, cm-3). Field et al. (1969) demonstrated that the CNM and the WNM can coexist in pressure equilibrium, such that the neutral gas can be considered as a two-phase medium. Observations of the Milky Way and nearby galaxies also provide evidence for a two-phase neutral medium (e.g. Dickey et al., 1983; Kulkarni & Heiles, 1987; Wolfire et al., 1995; Mebold et al., 1997; Braun, 1997; Dickey et al., 2000). Wolfire et al. (1995) and Wolfire et al. (2003) investigated the thermal balance of the WNM and CNM phases in the Galactic ISM. They found that their two-phase model, with thermal pressure in the range K cm-3, is in good agreement with observations of the Galactic ISM. In addition, the pressure equilibrium in their model depends on the gas phase abundance, dust abundance, metallicity, absorbing column density and radiation field. However, note that Heiles & Troland (2003) found that a large fraction, i.e. about 50% of the WNM lies in the thermally unstable region of 5005000 K. The heating mechanisms in the neutral ISM are dust photoelectric heating, cosmic ray heating, X-ray heating and heating by C i ionization, with dust photoelectric heating being the dominant heating mechanism. Radiative cooling by emission of the fine-structure lines, C ii* 158 m and O i* 63 m, dominates at cm-3 ( 2000 K), while electron recombination onto positively charged grains and radiative losses from resonant transitions like Lyman- dominate at cm-3 ( 7000 K).
3 H i 21-cm absorption
The neutral gas in the ISM can be detected and studied via the H i 21-cm line, which originates in the hyperfine splitting of the electronic ground state of hydrogen atom. Predicted by H.C. Van de Hulst in 1945 (van de Hulst, 1945), H i 21-cm emission from our Galaxy was first detected in 1951 (Ewen & Purcell, 1951; Muller & Oort, 1951; Pawsey, 1951). Since then the H i 21-cm emission line has proved to be a powerful tool for studying the distribution, amount, kinematics, and temperature of the neutral gas in our Galaxy as well as other galaxies. In the local Universe (0.2), blind H i 21-cm emission-line surveys using single-dish telescopes have provided reliable measurements of the cosmological H i mass density (Rosenberg & Schneider, 2002; Zwaan et al., 2005a; Hoppmann et al., 2015; Jones et al., 2018), and spatially resolved H i imaging using interferometers have traced the large scale dynamics of galaxies (van der Hulst et al., 2001; Zwaan et al., 2001; Verheijen et al., 2007; de Blok et al., 2008; Walter et al., 2008; Begum et al., 2008; Catinella & Cortese, 2015). Rotation curves derived from H i 21-cm emission maps of galaxies have provided evidence for the existence of dark matter (Bosma, 1978, 1981a, 1981b; van Albada et al., 1985; Rubin et al., 1985; Begeman, 1987; Broeils, 1992). However, the flux of the H i 21-cm emission signal is inversely proportional to the square of the distance to the unresolved emitting gas. Hence, sensitivities of present day radio telescopes make it difficult to directly map H i emission from 0.2 galaxies. The highest redshift ( = 0.376) H i 21-cm emission detection to date (Fernández et al., 2016) has been possible due to very long integration (178 hours) using the Karl G. Jansky Very Large Array (VLA). Besides direct detection of H i 21-cm emission from galaxies, there have been several H i 21-cm emission line stacking experiments which have studied the average H i properties of different samples of galaxies (Lah et al., 2007, 2009; Delhaize et al., 2013; Rhee et al., 2013, 2018; Kanekar et al., 2016). In addition to stacking, intensity mapping and cross-correlation of H i 21-cm emission with optical galaxy surveys (e.g. Chang et al., 2010; Masui et al., 2013) can complement individual H i line surveys and probe the average H i emission of galaxies upto higher redshifts (1).
Unlike H i 21-cm emission, the detectability of H i 21-cm absorption is not limited by distance of the absorbing gas and depends only on the strength of the background radio sources and H i 21-cm absorption cross-section projected on the sky by the galaxies. Therefore, H i -cm absorption line studies can complement the emission line surveys to trace the evolution of the atomic gas component in galaxies. The first Galactic detections of H i 21-cm absorption were reported by Hagen et al. (1954), Hagen & McClain (1954) and Hagen et al. (1955). Clark et al. (1962) was the first to use extragalactic radio sources to probe Galactic H i 21-cm absorption, followed by Shuter & Gower (1969) and Heiles & Miley (1970). The first detection of extragalactic H i 21-cm absorption was from the radio galaxy, Centaurus A (Roberts, 1970). Thereafter, Brown & Roberts (1973) detected H i 21-cm absorption at = 0.692 towards the background quasar 3C 286. Subsequently, H i 21-cm absorption has been used to probe the atomic gas in galaxies upto higher redshifts (see Kanekar et al., 2014, for a compilation), starting with detections of H i 21-cm absorption at by Wolfe & Davis (1979), Wolfe et al. (1981) and Wolfe et al. (1985).
Further, H i 21-cm emission line observations of nearby dwarf and spiral galaxies indicate that properties of the CNM phase and 100 pc- to 2 kpc-scale structures detected in the H i gas are closely linked with the in-situ star formation in galaxies (e.g. Tamburro et al., 2009; Bagetakos et al., 2011; Ianjamasimanana et al., 2012). However, identification of CNM gas through H i 21-cm emission is not straightforward as it depends on Gaussian decomposition of the emission line profiles. In the absence of absorption line measurements, it is not known whether the H i 21-cm emission line components exhibiting smaller line widths (and hence assumed to correspond to CNM) are truly cold. Therefore, the contributions due to turbulent motions and the processes driving the observed properties of H i gas are poorly constrained. Moreover, H i 21-cm emission studies usually do not have sufficient spatial resolution to detect parsec-scale structures. On the other hand, H i 21-cm absorption is an excellent tracer of the CNM phase (Kulkarni & Heiles, 1988), and can be used to study parsec-scale structures in the H i gas using sub-arcsecond-scale spectroscopy (e.g. Srianand et al., 2013).
The H i 21-cm optical depth integrated over velocity ( in km s-1) is related to the column density of neutral hydrogen, (H i) (cm-2), spin temperature (K) of the gas, and the fraction of the background radio source covered by the absorbing gas, as (e.g. Rohlfs & Wilson, 2000):
| (1) |
where the H i 21-cm line is assumed to be optically thin. Note that if there are a number of H i gas clouds at different phases along the line-of-sight giving rise to the absorption line, then the effective measured would be the column density-weighted harmonic mean of the of the different clouds. The inverse dependence of the H i 21-cm optical depth on , coupled with its very low transition probability and its resonance frequency falling in the radio wavelengths, make the H i 21-cm absorption line a good tracer of high column density cold H i gas without being affected by dust and luminosity biases. Hence, the H i 21-cm absorption line can be used to investigate:
-
1.
the thermal state of the H i gas, since the H i 21-cm optical depth depends inversely on , which is known to follow the gas kinetic temperature in the CNM (Field, 1959; Bahcall & Ekers, 1969; McKee & Ostriker, 1977; Wolfire et al., 1995; Roy et al., 2006), and can be coupled to the gas kinetic temperature via the radiation field in the WNM in case of a two-phase medium (Liszt, 2001);
- 2.
- 3.
-
4.
the magnetic field in the CNM using Zeeman splitting (Heiles & Troland, 2004);
-
5.
the filling factor of cold gas in the ISM/CGM of galaxies;
-
6.
the underlying potential using the overall velocity width of the H i 21-cm absorption lines;
- 7.
Next, we discuss some of the limitations of the H i 21-cm absorption line technique. The main limitation when estimating (H i) from H i 21-cm absorption is that the two parameters and in Eqn. 1, cannot usually be well-constrained. Comparison of both H i 21-cm emission and absorption spectra can be used to estimate . Such studies are possible in our Galaxy and nearby galaxies (e.g. Wakker et al., 2011; Keeney et al., 2011; Dutta et al., 2016). Though it should be noted that the angular scales probed by H i 21-cm emission are usually larger than that by H i 21-cm absorption. Therefore, (H i) obtained from H i emission maps represents average H i surface density, while the cold gas traced by H i 21-cm absorption could be much clumpier, implying that there will be uncertainties in comparing H i emission to absorption. However, such comparisons of H i emission and absorption are not feasible at high redshifts as explained above. Hence, for identifying and studying the ISM of high redshift galaxies, one usually has to rely on absorption lines detected towards bright background sources like quasars and gamma ray bursts. In such cases, can be estimated if there is independent measurement of (H i) from absorption in optical or ultraviolet (UV) spectra. However, this technique suffers from uncertainties regarding how much of the H i gas traced by absorption is associated with the 21-cm absorbing gas, and whether the radio and optical lines-of-sight are aligned. The second parameter, , is usually taken to be unity for lack of sufficient information about the extent of the absorber and the background radio source. This can be estimated by comparing the flux density of the radio source at high spatial resolution (parsec-scales), from Very Long Baseline Interferometry (VLBI) observations at the redshifted H i 21-cm line frequency, with the total flux density at the lower spatial resolution (usually kilo-parsec-scales) at which absorption is observed (e.g. Kanekar et al., 2009a; Gupta et al., 2012). However, VLBI observations of the radio sources may not always be available, especially at lower frequencies as required for the high redshift absorbers.
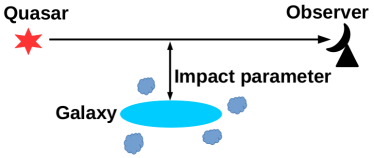
H i 21-cm absorption can be classified into two categories: (a) intrinsic and (b) intervening. The former probes neutral gas associated with the Active Galactic Nucleus (AGN) and its environment, and can be used to constrain models of formation and evolution of AGN, as well as the feedback they provide to their host galaxies (see for a review Morganti & Oosterloo, 2018). The latter probes the neutral gas in foreground galaxies and can be used to study how galaxies form and evolve with time. Here we concentrate on the latter category. See Fig. 1 for an illustration of quasar absorption line technique to study the gas associated with intervening galaxies.
4 Distribution of cold neutral gas around low- galaxies
Absorption lines seen in the spectra of background quasars whose sightline happen to pass through the discs or halos of foreground galaxies (we refer to such fortuitous associations as quasar-galaxy-pairs or QGPs from hereon), allow us to probe the physical, chemical and ionization state of gas in different environments such as the stellar discs, extended H i discs, high velocity clouds, outflows, accreting streams and tidal structures. The main drawback of quasar absorption line spectroscopy is that it probes the gas only along the pencil beam sightline. This issue can be addressed by compiling a large homogeneous and statistically significant sample of absorbers. The relationship between absorption strength and impact parameter (projected separation between quasar sightline and galaxy centre) obtained from a large number of quasar sightlines passing near foreground galaxies can then be used to statistically determine the gas distribution in and around galaxies. Considerable progress has been made in mapping the distribution of gas in the CGM or galaxy halos using absorption from (Chen et al., 2001; Prochaska et al., 2011; Tumlinson et al., 2013; Stocke et al., 2013; Borthakur et al., 2015), Mg ii (Chen et al., 2010; Kacprzak et al., 2012; Churchill et al., 2013; Nielsen et al., 2013; Bordoloi et al., 2014a), and other metals like C ii, C iii, C iv, Si ii, Si iii, Si iv, O vi (Tumlinson et al., 2011; Werk et al., 2014; Bordoloi et al., 2014b; Liang & Chen, 2014). Such studies have shown that the CGM can extend upto the virial radius (100s of kpc); is typically cool (105 K, i.e. below the virial temperature); is likely to be bound to the dark matter halo of the galaxy (within 200 km s-1 of the galaxy); is multiphase in nature; and becomes progressively more ionized with increasing distance from the galaxy centre. In addition to the above, the absorbing gas is found to be ubiquitous around both star-forming and passive galaxies, while the metals are found to be more patchy in distribution.
Here we are interested in probing the high column density H i gas around galaxies. Such gas is usually traced by damped absorbers (DLAs; (H i) 21020 cm-2) and sub-DLAs ((H i) 1019 21020 cm-2) (see Wolfe et al., 2005; Péroux et al., 2005). Thanks to large spectroscopic surveys like the Sloan Digital Sky Survey (SDSS; York et al., 2000), thousands of DLAs are known at 1.8, and they are found to trace the bulk (80%) of the H i gas at 2 4 (Prochaska et al., 2005; Noterdaeme et al., 2009, 2012). However, atmospheric cutoff of light below 3000 Å restricts ground-based observations of DLAs at 1.5. UV spectroscopic observations with the Hubble Space Telescope (HST) have identified 70 low- (1.65) DLAs and sub-DLAs till date (Rao et al., 2006, 2011; Meiring et al., 2011; Battisti et al., 2012; Turnshek et al., 2015; Neeleman et al., 2016; Rao et al., 2017). Using ground-based imaging studies of 1 DLAs, Rao et al. (2011) have found an anti-correlation (Spearman rank correlation coefficient, = 0.34 at 3 level of significance) between (H i) and impact parameter (), with median = 17 kpc. They also do not find any correlation between galaxy luminosity and (H i) and no significant evidence that galaxies at larger are more luminous. Similar trend of (H i) decreasing with is found by Rahmani et al. (2016) using X-Shooter observations of 0.6 DLA host galaxies and by Péroux et al. (2012) using integral field unit observations of H emission from DLAs at 1 2. At 2, Krogager et al. (2012) have found an anti-correlation ( = 0.6) between (H i) and , as well as correlation between metallicity and , consistent with simulations that contain feedback mechanisms to control the star formation (Fynbo et al., 2008; Pontzen et al., 2008).
At 0, Zwaan et al. (2005b), using H i 21-cm emission maps of local galaxies, have found that (H i) decreases with galactocentric radius. Further, they have calculated the two-dimensional probability function of H i column density and impact parameter, and found that the distribution of and luminosities of 1 DLA host galaxies can be explained on the basis of the local galaxy population. Based on their conditional probability distribution of (H i) and , the expected median for systems with log (H i) 20.3 (cm-2) is 8 kpc. However, Rao et al. (2011) found that a significantly higher fraction of low-redshift DLA host galaxies are at larger values, with luminosities less than the characteristic luminosity, which may hint at an evolution in the H i sizes of galaxies with redshift. Similar studies of H i 21-cm emission in nearby dwarf galaxies have found that their H i column density distribution function falls off significantly faster at high (H i) compared to that in DLAs and the local luminous galaxy population (Begum et al., 2008; Patra et al., 2013). Hence, the extent of high (H i) gas around them is likely to be much smaller and in order to detect gas with high (H i) from dwarf galaxies one must probe them at very small impact parameters.
While absorption and H i 21-cm emission trace the neutral gas around galaxies, H i 21-cm absorption towards radio-loud quasars is an excellent tracer of the CNM phase in galaxies. A detailed study of cold H i gas in the outer disks and halos of galaxies is required to understand where and how the infalling/circumgalactic gas condenses into the ISM. There are usually two approaches to map the distribution of gas around galaxies using quasar absorption lines: (i) galaxy-blind or absorption-selected approach, where one searches for intervening absorption towards a background quasar and then tries to identify the associated host galaxy, and (ii) absorption-blind or galaxy-selected approach, where one selects a galaxy in close proximity to a background quasar (i.e. a QGP) without prior knowledge of any absorption along the quasar sightline, and then proceeds to search for absorption at the redshift of the galaxy towards the quasar. The advantage of the second approach over the first is that it is not biased against dusty sightlines (which are more likely to be conducive to the presence of cold gas), and hence it is expected to trace gas associated with the general galaxy population without any biases.
Following the second approach, H i 21-cm absorption searches from low- (0.4) QGPs have revealed a weak anti-correlation between the H i 21-cm optical depth and impact parameter (Carilli & van Gorkom, 1992; Gupta et al., 2010; Borthakur et al., 2011; Borthakur, 2016; Zwaan et al., 2015; Reeves et al., 2016). However, the number of low- QGPs in these studies was too small to characterize the distribution of cold H i gas around galaxies. With a view to map the distribution of high column density ((H i) 1019 cm-2) cold ( few 100 K) H i gas around low- galaxies, Dutta et al. (2017c) have carried out a systematic survey of H i 21-cm absorption in a homogeneous sample of 55 QGPs (40 of which are in the statistical sample) towards radio sources at 035 kpc. The main results from this study are highlighted below.
-
1.
Radial profile of cold H i gas around low- galaxies: The strength and covering factor of H i 21-cm absorption decreases, albeit slowly, with increasing impact parameter, radial distance along the galaxy’s major axis and distances scaled with the effective H i radius (see Fig. 2). There is a weak anti-correlation (rank correlation coefficient = 0.20 at 2.42 level) between and . The covering factor of H i 21-cm absorbers decreases from 0.24 at 15 kpc to 0.06 at 1535 kpc. The 3 sensitivity for this estimate is 0.3 km s-1, which corresponds to (H i) = cm-2, for a of 100 K typical of CNM and of unity.
-
2.
Azimuthal profile of cold H i gas around low- galaxies: There is tentative evidence that the distribution of the H i 21-cm absorbers is likely to be co-planar with that of the H i disk. The absorption strength and covering factor are higher when the radio sightline passes near the galaxy’s major axis. Further, the covering factor is maximum for sightlines that pass near the major axis of edge-on galaxies.
-
3.
Dependence of cold H i gas distribution on host galaxy properties: The strength and covering factor of H i 21-cm absorbers is not found to depend significantly on the host galaxy properties, i.e. luminosity, stellar mass, colour, surface star formation rate density and redshift. Hence, it is surmised that the distribution of H i 21-cm absorbers is more sensitive to geometrical parameters than physical parameters related to the star formation in galaxies.
-
4.
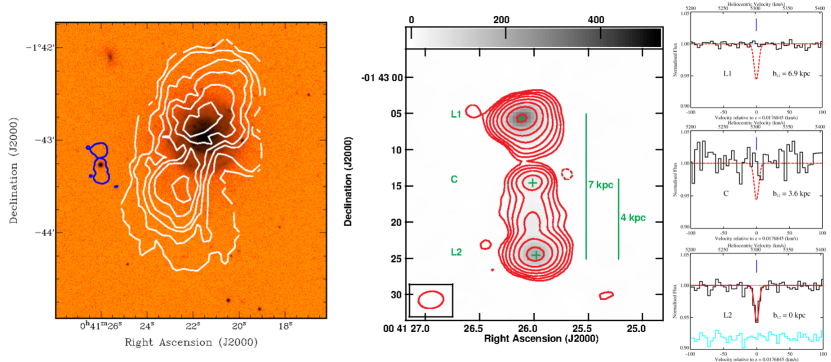
Nature of cold H i gas around low- galaxies: No correlation is found between H i 21-cm optical depth and equivalent widths of Ca ii and Na i absorption lines detected in the optical spectra of the quasars. The observed equivalent ratios of Ca ii and Na i suggest that most of the H i 21-cm absorbers observed around low- galaxies are not tracing the dusty star-forming disks, but rather the diffuse extended H i disks. Further, the observations suggest that cold gas clouds in the extended disks/halos of galaxies have small sizes (parsec to sub-parsec scale) and are patchy in distribution (see Fig. 3). Indeed, there have been observations of structures in the H i gas around galaxies from parsec-scales (Srianand et al., 2013; Dutta et al., 2015) to kilo-parsec-scales (Dutta et al., 2016). This is further supported by four times higher incidence of H i 21-cm absorption around DLA host galaxies (i.e. absorption-selected sample) compared to the galaxy-selected sample of QGPs. From the fact that 60% of DLAs have cold gas that can produce detectable H i 21-cm absorption, we infer that the H i gas distribution around low- galaxies that contribute to the DLA population is patchy, with a covering factor of 30% within 30 kpc.

5 Dependence of cold neutral gas on metals and dust
Currently it is not possible to extend the study of low- QGPs, as described in Section 4, to higher redshifts (i.e. ) due to the difficulty of constructing large spectroscopic samples of galaxies at high redshifts. Hence, the usual practice to study cold gas at high redshifts has been to search for H i 21-cm absorption towards radio-loud quasars that show strong metal or absorption in their optical and UV spectra, i.e. absorption-selected approach. As mentioned in Section 4, the line cannot observed from ground at . The Mg ii doublet lines, 2797, 2803, offer the best way to probe high (H i) systems in the absence of direct observations of . Mg ii absorption detected towards background quasars have proved to be excellent tools to probe the gaseous halos of 2 galaxies (Lanzetta et al., 1987; Sargent et al., 1988; Bergeron & Boissé, 1991; Steidel & Sargent, 1992; Steidel, 1995; Nestor et al., 2005; Prochter et al., 2006; Quider et al., 2011; Zhu & Ménard, 2013). At 0.53.5, systematic searches of H i 21-cm absorption in samples of Mg ii systems and DLAs towards radio-loud quasars have estimated the detection rate or the CNM filling factor as 1020% (Briggs & Wolfe, 1983; Kanekar & Chengalur, 2003; Curran et al., 2005; Gupta et al., 2009; Kanekar et al., 2009b; Curran et al., 2010; Srianand et al., 2012; Gupta et al., 2012; Kanekar et al., 2013, 2014). Spin temperature () measurements derived using H i 21-cm optical depth and (H i) measured from DLAs, suggest that most of the gas along these sightlines trace the diffuse WNM phase, and only a small fraction of the total (H i) is associated with the CNM phase (Srianand et al., 2012; Kanekar et al., 2014). This is supported by observations of typically low (%) molecular fractions of in DLAs (Noterdaeme et al., 2008), as well as physical conditions inferred in DLAs using C ii* and Si ii* fine structure lines (Neeleman et al., 2015). In addition, there are indications for an anti-correlation between and the gas phase metallicity (see Kanekar et al., 2014, and references therein).
Strong Mg ii absorbers (rest equivalent width of Mg ii , 1 Å) at 1.65 have been shown to trace gas with high neutral hydrogen column densities, like DLAs and sub-DLAs (Rao et al., 2006). However, strong Mg ii systems sample a wide range of galaxy impact parameters, over 10200 kpc (Nielsen et al., 2013). Hence, such absorbers can trace gas in a wide variety of environments like star-forming discs, CGM, galactic winds and outflows. To study the cold dense gas around galaxies, other parameters like equivalent width ratios of metal lines are required to select sightlines that probe low impact parameters. Rao et al. (2006) have demonstrated that equivalent width ratios of Mg ii, Mg i and Fe ii absorption can be used to pre-select DLAs more successfully than by just using . Further insights into the origin and physical conditions prevailing in the strong Mg ii systems and DLAs can be obtained by studying their associated H i 21-cm absorption. Gupta et al. (2009, 2012) have shown that the H i 21-cm detection rate in strong Mg ii systems can be enhanced with appropriate equivalent width ratio cuts of Mg ii, Fe ii and Mg i. Recently, Dutta et al. (2017b) have proposed an efficient Fe ii absorption-based selection technique to detect high (H i) cold gas at high-. The detection rate of H i 21-cm absorption increases with the absorption strength of Fe ii, and additional constraints on Fe ii (rest equivalent width of Fe ii , 1 Å) gives a higher (by a factor of ) detection rate of H i 21-cm absorption compared to a pure Mg ii-based selection.
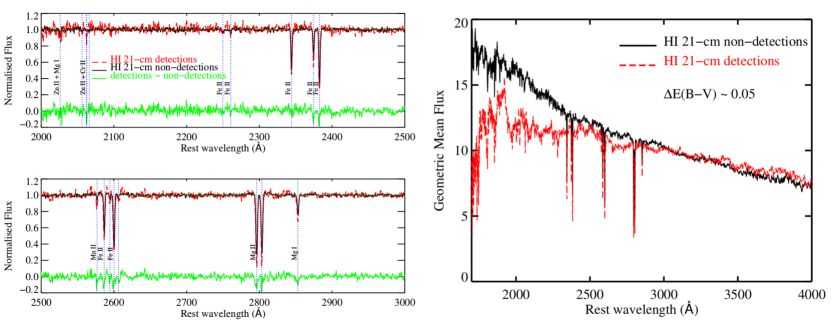
Further, the properties of cold gas detected through H i 21-cm absorption are found to be closely linked with the metal and dust content of the gas. Dutta et al. (2017b) have found that H i 21-cm absorption arises on an average in systems with stronger metal absorption. Stacking of SDSS optical spectra of background quasars shows that the average equivalent widths of various metal lines among H i 21-cm absorbers are higher by a factor of than that found in non-absorbers (Fig. 4, left panel). In addition, quasars with H i 21-cm absorption detected towards them are found to be systematically more reddened than those without absorption (Fig. 4, right panel), and there is a tendency for the detection rate of H i 21-cm absorbers to be higher towards more reddened quasars. Further, H i 21-cm absorption searches towards radio-selected red quasars have usually resulted in a higher detection rate than that obtained for optically-selected DLAs (e.g. Carilli et al., 1998; Ishwara-Chandra et al., 2003). There have also been detections of H i 21-cm and molecular line absorption towards gravitationally-lensed systems that have high visual extinction (Carilli et al., 1992; Chengalur et al., 1999; Kanekar & Briggs, 2003). Hence, all the above imply that H i 21-cm absorption is more likely to arise in metal-rich dusty cold gas.
6 Redshift evolution of cold neutral gas
The global star formation rate density (SFRD) of the Universe peaks at , followed by a decline towards (Madau & Dickinson, 2014). The redshift evolution of the SFRD is expected to be imprinted in the ISM/CGM of galaxies, because the physical conditions and the volume filling factors of different gas phases depend on various feedback mechanisms associated with the in-situ star-formation. Therefore, mapping the redshift evolution of different gas phases will provide deeper understanding of the physical processes that drive the global star formation in the Universe. Even more relevant for understanding the SFRD evolution is how the fraction of cold gas (which acts as the reservoir for star-formation) is evolving with redshift, which is not well-constrained from observations. The cosmic mass density of H i, , shows a mild (factor of ) decrease from to (Rhee et al., 2018). This is modest compared to an order of magnitude decrease in the SFRD over the same redshift range. This implies that the processes leading to the conversion of gas to stars need to be understood directly via observations of cold atomic and molecular gas. Indeed recent results using ALMA indicate that the cosmic molecular gas density peaks at and drops by a factor of to (Decarli et al., 2019), matching the evolution of the cosmic SFRD. Hence, the emerging picture is that cold gas content is the driving force behind the star formation history.
H i 21-cm emission and absorption measurements have been used to study in detail the CNM phase in the ISM of the Milky Way (Heiles & Troland, 2003; Roy et al., 2013). It has been observed that 60% of the atomic gas is in the WNM phase and 50% of the WNM lies in the thermally unstable range of 5005000 K. Jenkins & Tripp (2001) also arrived at similar conclusions based on excitation of neutral carbon using UV spectroscopy. The ideal, i.e. dust- and luminosity-unbiased, way to estimate the redshift evolution of the cold gas fraction would be to conduct blind H i 21-cm absorption searches. However, this has not been possible till recently due to limited receiver bandwidths and hostile radio frequency interference environment, though the situation is now improving with the advent of Square Kilometer Array (SKA) pre-cursors and induction of wide-band receivers in existing telescopes. Till date, H i 21-cm absorption studies have been typically conducted in samples of QGPs (see Section 4) or absorption-selected samples (see Section 5). Fig. 5 summarizes the detection rates of H i 21-cm absorption and the number density per unit redshift of H i 21-cm absorbers () obtained using different techniques at different redshifts. No significant evolution is observed in the detection rate and among strong Mg ii systems over . However, comparing H i 21-cm studies of and DLAs, it can be seen that the cold gas fraction in DLAs may be declining with redshift, with the detection rate being 3 times lower at compared to .
Besides the evolution in incidence, Kanekar et al. (2014) have found evidence for redshift evolution in DLA spin temperatures. The distribution of DLAs is found to be significantly different from that of DLAs, and the high temperatures in high- DLAs are attributed to lower fractions of CNM. Further, Dutta et al. (2017b) have found an increasing trend of the velocity width of the H i 21-cm absorption lines with redshift. A possible explanation for this is that the typical H i 21-cm absorber may be probed by larger mass galaxy halos at high- (for a given metallicity). In addition, taking into account the evolution of size and luminosity of galaxies with redshift, the radius of the cold H i gas around a galaxy that gives rise to H i 21-cm absorption is likely be much higher at high- than what is seen at low- for a galaxy with same optical luminosity.
While we have made progress in understanding the nature of cold H i gas in galaxies and its redshift evolution, it can be seen that we are still limited by statistical uncertainties due to the small number of detections and different sample selection techniques at different redshifts. Hence, increasing the number of H i 21-cm detections over , such that we can uniformly trace the evolution of cold gas in galaxies in a dust- and luminosity-unbiased way, is one of the major motivations of the upcoming blind H i 21-cm absorption line surveys using the SKA pathfinders and pre-cursors, e.g. FLASH/ASKAP, MALS/MeerKAT, SHARP/Apertif (Gupta et al., 2016; Maccagni et al., 2017).


7 Summary & Future Perspectives
We have discussed in this work the results from different efforts to study the cold neutral gas in and around galaxies using H i 21-cm absorption. Some of the key results from these studies are summarized here.
-
•
The cold neutral gas around galaxies, as traced by H i 21-cm absorption, has a weakly declining radial profile, with an average covering factor of within 30 kpc. Based on geometrical and chemical analysis, the H i 21-cm absorbers are likely tracing the diffuse extended H i disc around galaxies. The cold H i gas is patchily distributed around galaxies and can have variations in the optical depth at both parsec- and kilo-parsec-scales.
-
•
The detection rate and optical depth of H i 21-cm absorption over are correlated with the equivalent width of metal line absorption like Mg ii and Fe ii. They are further correlated with the reddening of the background quasar. Thus, the presence and amount of cold H i gas in the vicinity of high- galaxies appear to be closely related to the metal and dust content of the gas.
-
•
The incidence and number density per unit redshift of H i 21-cm absorbers in strong Mg ii absorbers do not seem to evolve over , albeit the uncertainties are still large. The incidence of H i 21-cm absorbers in DLAs, on the other hand, seem to show a stronger evolution, i.e. it increases by a factor of 3 from to . The spin temperature of DLAs also show a redshift evolution, with DLAs having significantly higher .
H i 21-cm absorption towards background radio-loud quasars has thus proved to be an effective tool to map the distribution of cold neutral gas around foreground low- galaxies, as well as study the neutral gas in the vicinity of high- galaxies selected via Mg ii absorption or DLAs. The next step is to increase the number of sightlines searched for H i 21-cm absorption and the number of detections through blind surveys as mentioned in Section 6 The large number (100s) of H i 21-cm absorption detection is expected to accurately characterize the redshift evolution of cold gas in galaxies. Here we identify few prospects involving multi-wavelength observations that are promising for interpreting the existing and upcoming results with H i 21-cm absorption.
-
1.
High resolution () optical spectroscopy of quasars which show H i 21-cm absorption will enable detailed comparison of the kinematics of metals and H i gas, and confirm with higher significance the various trends of H i with metals and dust as found using low resolution optical spectra (e.g. Srianand et al., 2012).
-
2.
Sub-arcsecond-scale imaging of the background radio sources will allow us to quantify the covering factor of cold gas and study its small scale structure (e.g. Gupta et al., 2012).
- 3.
-
4.
Identifying the host galaxies of high- H i 21-cm absorbers using optical integral field unit spectroscopy (e.g. MUSE/VLT) and molecular emission with e.g. ALMA, is essential to connect the properties of the galaxies with the absorbing gas (e.g. Péroux et al., 2019). Such observations are also required to link the neutral gas around galaxies with their ionized and molecular gas content, and hence understand the mechanisms through which galaxies acquire the fuel for forming stars.
The upcoming surveys will provide interesting targets for follow-up multi-wavelength observations as outlined above. In addition, existing and planned wide-area multi-object/integral field optical spectroscopic surveys like Calar Alto Legacy Integral Field Area (CALIFA; Sánchez et al., 2012), Sydney-Australian-Astronomical-Observatory Multiobject Integral-Field Spectrograph (SAMI; Croom et al., 2012), SDSS Mapping Nearby Galaxies at Apache Point Observatory (MaNGA; Bundy et al., 2015) and WEAVE (Dalton et al., 2012), will complement the H i 21-cm surveys in associating the absorption with the galaxies.
Acknowledgements
I thank the anonymous reviewers for their helpful comments. I thank Raghunathan Srianand for going through a draft of this review and providing feedback. I am grateful to the Alexander von Humboldt Foundation for support in the form of a post-doctoral fellowship.
References
- Bagetakos et al. (2011) Bagetakos, I., Brinks, E., Walter, F., et al. 2011, AJ, 141, 23
- Bahcall & Ekers (1969) Bahcall, J. N., & Ekers, R. D. 1969, ApJ, 157, 1055
- Battisti et al. (2012) Battisti, A. J., Meiring, J. D., Tripp, T. M., et al. 2012, ApJ, 744, 93
- Begeman (1987) Begeman, K. G. 1987, PhD thesis, , Kapteyn Institute, (1987)
- Begum et al. (2008) Begum, A., Chengalur, J. N., Karachentsev, I. D., Sharina, M. E., & Kaisin, S. S. 2008, MNRAS, 386, 1667
- Bergeron & Boissé (1991) Bergeron, J., & Boissé, P. 1991, A&A, 243, 344
- Biggs et al. (2016) Biggs, A. D., Zwaan, M. A., Hatziminaoglou, E., Péroux, C., & Liske, J. 2016, MNRAS, 462, 2819
- Bordoloi et al. (2014a) Bordoloi, R., Lilly, S. J., Kacprzak, G. G., & Churchill, C. W. 2014a, ApJ, 784, 108
- Bordoloi et al. (2014b) Bordoloi, R., Tumlinson, J., Werk, J. K., et al. 2014b, ApJ, 796, 136
- Borthakur (2016) Borthakur, S. 2016, ApJ, 829, 128
- Borthakur et al. (2011) Borthakur, S., Tripp, T. M., Yun, M. S., et al. 2011, ApJ, 727, 52
- Borthakur et al. (2015) Borthakur, S., Heckman, T., Tumlinson, J., et al. 2015, ApJ, 813, 46
- Bosma (1978) Bosma, A. 1978, PhD thesis, PhD Thesis, Groningen Univ., (1978)
- Bosma (1981a) —. 1981a, AJ, 86, 1791
- Bosma (1981b) —. 1981b, AJ, 86, 1825
- Braun (1997) Braun, R. 1997, ApJ, 484, 637
- Briggs & Wolfe (1983) Briggs, F. H., & Wolfe, A. M. 1983, ApJ, 268, 76
- Broeils (1992) Broeils, A. H. 1992, PhD thesis, PhD thesis, Univ. Groningen, (1992)
- Brown & Roberts (1973) Brown, R. L., & Roberts, M. S. 1973, ApJ, 184, L7
- Bundy et al. (2015) Bundy, K., Bershady, M. A., Law, D. R., et al. 2015, ApJ, 798, 7
- Carilli et al. (1998) Carilli, C. L., Menten, K. M., Reid, M. J., Rupen, M. P., & Yun, M. S. 1998, ApJ, 494, 175
- Carilli et al. (1992) Carilli, C. L., Perlman, E. S., & Stocke, J. T. 1992, ApJ, 400, L13
- Carilli & van Gorkom (1992) Carilli, C. L., & van Gorkom, J. H. 1992, ApJ, 399, 373
- Carilli et al. (2000) Carilli, C. L., Menten, K. M., Stocke, J. T., et al. 2000, Phys. Rev. Lett., 85, 5511
- Catinella & Cortese (2015) Catinella, B., & Cortese, L. 2015, MNRAS, 446, 3526
- Chang et al. (2010) Chang, T.-C., Pen, U.-L., Bandura, K., & Peterson, J. B. 2010, Nature, 466, 463
- Chen et al. (2010) Chen, H.-W., Helsby, J. E., Gauthier, J.-R., et al. 2010, ApJ, 714, 1521
- Chen et al. (2001) Chen, H.-W., Lanzetta, K. M., Webb, J. K., & Barcons, X. 2001, ApJ, 559, 654
- Chengalur et al. (1999) Chengalur, J. N., de Bruyn, A. G., & Narasimha, D. 1999, A&A, 343, L79
- Chengalur & Kanekar (2003) Chengalur, J. N., & Kanekar, N. 2003, Phys. Rev. Lett., 91, 241302
- Chung et al. (2009) Chung, A., van Gorkom, J. H., Kenney, J. D. P., Crowl, H., & Vollmer, B. 2009, AJ, 138, 1741
- Churchill et al. (2013) Churchill, C. W., Nielsen, N. M., Kacprzak, G. G., & Trujillo-Gomez, S. 2013, ApJ, 763, L42
- Clark et al. (1962) Clark, B. G., Radhakrishnan, V., & Wilson, R. W. 1962, ApJ, 135, 151
- Combes et al. (2019) Combes, F., Gupta, N., Jozsa, G. I. G., & Momjian, E. 2019, A&A, 623, A133
- Croom et al. (2012) Croom, S. M., Lawrence, J. S., Bland-Hawthorn, J., et al. 2012, MNRAS, 421, 872
- Curran et al. (2005) Curran, S. J., Murphy, M. T., Pihlström, Y. M., Webb, J. K., & Purcell, C. R. 2005, MNRAS, 356, 1509
- Curran et al. (2010) Curran, S. J., Tzanavaris, P., Darling, J. K., et al. 2010, MNRAS, 402, 35
- Dalton et al. (2012) Dalton, G., Trager, S. C., Abrams, D. C., et al. 2012, in Proc. SPIE, Vol. 8446, Ground-based and Airborne Instrumentation for Astronomy IV, 84460P
- de Blok et al. (2008) de Blok, W. J. G., Walter, F., Brinks, E., et al. 2008, AJ, 136, 2648
- Decarli et al. (2019) Decarli, R., Walter, F., Gónzalez-López, J., et al. 2019, arXiv e-prints, arXiv:1903.09164
- Delhaize et al. (2013) Delhaize, J., Meyer, M. J., Staveley-Smith, L., & Boyle, B. J. 2013, MNRAS, 433, 1398
- Dickey et al. (1983) Dickey, J. M., Kulkarni, S. R., van Gorkom, J. H., & Heiles, C. E. 1983, ApJS, 53, 591
- Dickey et al. (2000) Dickey, J. M., Mebold, U., Stanimirovic, S., & Staveley-Smith, L. 2000, ApJ, 536, 756
- Dutta et al. (2016) Dutta, R., Gupta, N., Srianand, R., & O’Meara, J. M. 2016, MNRAS, 456, 4209
- Dutta et al. (2017a) Dutta, R., Srianand, R., Gupta, N., & Joshi, R. 2017a, ArXiv e-prints, arXiv:1703.00457
- Dutta et al. (2017b) Dutta, R., Srianand, R., Gupta, N., et al. 2017b, MNRAS, 465, 4249
- Dutta et al. (2017c) —. 2017c, MNRAS, 465, 588
- Dutta et al. (2015) Dutta, R., Srianand, R., Muzahid, S., et al. 2015, MNRAS, 448, 3718
- Ewen & Purcell (1951) Ewen, H. I., & Purcell, E. M. 1951, Nature, 168, 356
- Fernández et al. (2016) Fernández, X., Gim, H. B., van Gorkom, J. H., et al. 2016, ApJ, 824, L1
- Field (1959) Field, G. B. 1959, ApJ, 129, 536
- Field et al. (1969) Field, G. B., Goldsmith, D. W., & Habing, H. J. 1969, ApJ, 155, L149
- Fynbo et al. (2008) Fynbo, J. P. U., Prochaska, J. X., Sommer-Larsen, J., Dessauges-Zavadsky, M., & Møller, P. 2008, ApJ, 683, 321
- Gupta et al. (2018a) Gupta, N., Momjian, E., Srianand, R., et al. 2018a, ApJ, 860, L22
- Gupta et al. (2010) Gupta, N., Srianand, R., Bowen, D. V., York, D. G., & Wadadekar, Y. 2010, MNRAS, 408, 849
- Gupta et al. (2012) Gupta, N., Srianand, R., Petitjean, P., et al. 2012, A&A, 544, A21
- Gupta et al. (2009) Gupta, N., Srianand, R., Petitjean, P., Noterdaeme, P., & Saikia, D. J. 2009, MNRAS, 398, 201
- Gupta et al. (2016) Gupta, N., Srianand, R., Baan, W., et al. 2016, in Proceedings of MeerKAT Science: On the Pathway to the SKA. 25-27 May, 2016 Stellenbosch, South Africa (MeerKAT2016)., 14
- Gupta et al. (2018b) Gupta, N., Srianand, R., Farnes, J. S., et al. 2018b, MNRAS, 476, 2432
- Hagen et al. (1955) Hagen, J. P., Lilley, A. E., & McClain, E. F. 1955, ApJ, 122, 361
- Hagen & McClain (1954) Hagen, J. P., & McClain, E. F. 1954, ApJ, 120, 368
- Hagen et al. (1954) Hagen, J. P., McClain, E. F., & Hepburn, N. 1954, AJ, 59, 323
- Haynes et al. (1979) Haynes, M. P., Giovanelli, R., & Roberts, M. S. 1979, ApJ, 229, 83
- Heiles & Miley (1970) Heiles, C., & Miley, G. K. 1970, ApJ, 160, L83
- Heiles & Troland (2003) Heiles, C., & Troland, T. H. 2003, ApJ, 586, 1067
- Heiles & Troland (2004) —. 2004, ApJS, 151, 271
- Hopkins & Beacom (2006) Hopkins, A. M., & Beacom, J. F. 2006, ApJ, 651, 142
- Hoppmann et al. (2015) Hoppmann, L., Staveley-Smith, L., Freudling, W., et al. 2015, MNRAS, 452, 3726
- Ianjamasimanana et al. (2012) Ianjamasimanana, R., de Blok, W. J. G., Walter, F., & Heald, G. H. 2012, AJ, 144, 96
- Ishwara-Chandra et al. (2003) Ishwara-Chandra, C. H., Dwarakanath, K. S., & Anantharamaiah, K. R. 2003, Journal of Astrophysics and Astronomy, 24, 37
- Jenkins & Tripp (2001) Jenkins, E. B., & Tripp, T. M. 2001, ApJS, 137, 297
- Jones et al. (2018) Jones, M. G., Haynes, M. P., Giovanelli, R., & Moorman, C. 2018, MNRAS, 477, 2
- Kacprzak et al. (2012) Kacprzak, G. G., Churchill, C. W., & Nielsen, N. M. 2012, ApJ, 760, L7
- Kanekar & Briggs (2003) Kanekar, N., & Briggs, F. H. 2003, A&A, 412, L29
- Kanekar & Chengalur (2003) Kanekar, N., & Chengalur, J. N. 2003, A&A, 399, 857
- Kanekar et al. (2010) Kanekar, N., Chengalur, J. N., & Ghosh, T. 2010, ApJ, 716, L23
- Kanekar et al. (2001) Kanekar, N., Chengalur, J. N., Subrahmanyan, R., & Petitjean, P. 2001, A&A, 367, 46
- Kanekar et al. (2013) Kanekar, N., Ellison, S. L., Momjian, E., York, B. A., & Pettini, M. 2013, MNRAS, 428, 532
- Kanekar et al. (2009a) Kanekar, N., Lane, W. M., Momjian, E., Briggs, F. H., & Chengalur, J. N. 2009a, MNRAS, 394, L61
- Kanekar et al. (2012) Kanekar, N., Langston, G. I., Stocke, J. T., Carilli, C. L., & Menten, K. M. 2012, ApJ, 746, L16
- Kanekar et al. (2009b) Kanekar, N., Prochaska, J. X., Ellison, S. L., & Chengalur, J. N. 2009b, MNRAS, 396, 385
- Kanekar et al. (2016) Kanekar, N., Sethi, S., & Dwarakanath, K. S. 2016, ApJ, 818, L28
- Kanekar et al. (2014) Kanekar, N., Prochaska, J. X., Smette, A., et al. 2014, MNRAS, 438, 2131
- Keeney et al. (2011) Keeney, B. A., Stocke, J. T., Danforth, C. W., & Carilli, C. L. 2011, AJ, 141, 66
- Krogager et al. (2012) Krogager, J.-K., Fynbo, J. P. U., Møller, P., et al. 2012, MNRAS, 424, L1
- Kulkarni & Heiles (1987) Kulkarni, S. R., & Heiles, C. 1987, in Astrophysics and Space Science Library, Vol. 134, Interstellar Processes, ed. D. J. Hollenbach & H. A. Thronson, Jr., 87–122
- Kulkarni & Heiles (1988) Kulkarni, S. R., & Heiles, C. 1988, Neutral hydrogen and the diffuse interstellar medium, ed. K. I. Kellermann & G. L. Verschuur, 95–153
- Lah et al. (2007) Lah, P., Chengalur, J. N., Briggs, F. H., et al. 2007, MNRAS, 376, 1357
- Lah et al. (2009) Lah, P., Pracy, M. B., Chengalur, J. N., et al. 2009, MNRAS, 399, 1447
- Lane (2000) Lane, W. M. 2000, PhD thesis, University of Groningen
- Lanzetta et al. (1987) Lanzetta, K. M., Turnshek, D. A., & Wolfe, A. M. 1987, ApJ, 322, 739
- Liang & Chen (2014) Liang, C. J., & Chen, H.-W. 2014, MNRAS, 445, 2061
- Liszt (2001) Liszt, H. 2001, A&A, 371, 698
- Maccagni et al. (2017) Maccagni, F. M., Morganti, R., Oosterloo, T. A., Geréb, K., & Maddox, N. 2017, A&A, 604, A43
- Madau & Dickinson (2014) Madau, P., & Dickinson, M. 2014, Ann. Rev. of Astron. and Astrophys., 52, 415
- Masui et al. (2013) Masui, K. W., Switzer, E. R., Banavar, N., et al. 2013, ApJ, 763, L20
- McKee & Ostriker (1977) McKee, C. F., & Ostriker, J. P. 1977, ApJ, 218, 148
- Mebold et al. (1997) Mebold, U., Düsterberg, C., Dickey, J. M., Staveley-Smith, L., & Kalberla, P. 1997, ApJ, 490, L65
- Meiring et al. (2011) Meiring, J. D., Tripp, T. M., Prochaska, J. X., et al. 2011, ApJ, 732, 35
- Mihos et al. (2012) Mihos, J. C., Keating, K. M., Holley-Bockelmann, K., Pisano, D. J., & Kassim, N. E. 2012, ApJ, 761, 186
- Morganti & Oosterloo (2018) Morganti, R., & Oosterloo, T. 2018, A&A Rev., 26, 4
- Muller & Oort (1951) Muller, C. A., & Oort, J. H. 1951, Nature, 168, 357
- Neeleman et al. (2016) Neeleman, M., Prochaska, J. X., Ribaudo, J., et al. 2016, ApJ, 818, 113
- Neeleman et al. (2015) Neeleman, M., Prochaska, J. X., & Wolfe, A. M. 2015, ApJ, 800, 7
- Nestor et al. (2005) Nestor, D. B., Turnshek, D. A., & Rao, S. M. 2005, ApJ, 628, 637
- Nielsen et al. (2013) Nielsen, N. M., Churchill, C. W., Kacprzak, G. G., & Murphy, M. T. 2013, ApJ, 776, 114
- Noterdaeme et al. (2008) Noterdaeme, P., Ledoux, C., Petitjean, P., & Srianand, R. 2008, A&A, 481, 327
- Noterdaeme et al. (2009) Noterdaeme, P., Petitjean, P., Ledoux, C., & Srianand, R. 2009, A&A, 505, 1087
- Noterdaeme et al. (2012) Noterdaeme, P., Petitjean, P., Carithers, W. C., et al. 2012, A&A, 547, L1
- Oosterloo et al. (2007) Oosterloo, T., Fraternali, F., & Sancisi, R. 2007, AJ, 134, 1019
- Patra et al. (2013) Patra, N. N., Chengalur, J. N., & Begum, A. 2013, MNRAS, 429, 1596
- Pawsey (1951) Pawsey, J. L. 1951, Nature, 168, 358
- Péroux et al. (2012) Péroux, C., Bouché, N., Kulkarni, V. P., York, D. G., & Vladilo, G. 2012, MNRAS, 419, 3060
- Péroux et al. (2005) Péroux, C., Dessauges-Zavadsky, M., D’Odorico, S., Sun Kim, T., & McMahon, R. G. 2005, MNRAS, 363, 479
- Péroux et al. (2019) Péroux, C., Zwaan, M. A., Klitsch, A., et al. 2019, MNRAS, 485, 1595
- Pontzen et al. (2008) Pontzen, A., Governato, F., Pettini, M., et al. 2008, MNRAS, 390, 1349
- Prochaska et al. (2005) Prochaska, J. X., Herbert-Fort, S., & Wolfe, A. M. 2005, ApJ, 635, 123
- Prochaska et al. (2011) Prochaska, J. X., Weiner, B., Chen, H.-W., Mulchaey, J., & Cooksey, K. 2011, ApJ, 740, 91
- Prochter et al. (2006) Prochter, G. E., Prochaska, J. X., & Burles, S. M. 2006, ApJ, 639, 766
- Quider et al. (2011) Quider, A. M., Nestor, D. B., Turnshek, D. A., et al. 2011, AJ, 141, 137
- Rahmani et al. (2012) Rahmani, H., Srianand, R., Gupta, N., et al. 2012, MNRAS, 425, 556
- Rahmani et al. (2016) Rahmani, H., Péroux, C., Turnshek, D. A., et al. 2016, MNRAS, 463, 980
- Rao et al. (2011) Rao, S. M., Belfort-Mihalyi, M., Turnshek, D. A., et al. 2011, MNRAS, 416, 1215
- Rao et al. (2006) Rao, S. M., Turnshek, D. A., & Nestor, D. B. 2006, ApJ, 636, 610
- Rao et al. (2017) Rao, S. M., Turnshek, D. A., Sardane, G. M., & Monier, E. M. 2017, MNRAS, 471, 3428
- Reeves et al. (2016) Reeves, S. N., Sadler, E. M., Allison, J. R., et al. 2016, MNRAS, 457, 2613
- Rhee et al. (2018) Rhee, J., Lah, P., Briggs, F. H., et al. 2018, MNRAS, 473, 1879
- Rhee et al. (2013) Rhee, J., Zwaan, M. A., Briggs, F. H., et al. 2013, MNRAS, 435, 2693
- Roberts (1970) Roberts, M. S. 1970, ApJ, 161, L9
- Rohlfs & Wilson (2000) Rohlfs, K., & Wilson, T. L. 2000, Tools of radio astronomy
- Rosenberg & Schneider (2002) Rosenberg, J. L., & Schneider, S. E. 2002, ApJ, 567, 247
- Roy et al. (2006) Roy, N., Chengalur, J. N., & Srianand, R. 2006, MNRAS, 365, L1
- Roy et al. (2013) Roy, N., Kanekar, N., & Chengalur, J. N. 2013, MNRAS, 436, 2366
- Rubin et al. (1985) Rubin, V. C., Burstein, D., Ford, Jr., W. K., & Thonnard, N. 1985, ApJ, 289, 81
- Sánchez et al. (2012) Sánchez, S. F., Kennicutt, R. C., Gil de Paz, A., et al. 2012, A&A, 538, A8
- Sancisi et al. (2008) Sancisi, R., Fraternali, F., Oosterloo, T., & van der Hulst, T. 2008, A&A Rev., 15, 189
- Sargent et al. (1988) Sargent, W. L. W., Steidel, C. C., & Boksenberg, A. 1988, ApJ, 334, 22
- Shuter & Gower (1969) Shuter, W. L. H., & Gower, J. F. R. 1969, Nature, 223, 1046
- Srianand et al. (2012) Srianand, R., Gupta, N., Petitjean, P., et al. 2012, MNRAS, 421, 651
- Srianand et al. (2013) Srianand, R., Gupta, N., Rahmani, H., et al. 2013, MNRAS, 428, 2198
- Steidel (1995) Steidel, C. C. 1995, in QSO Absorption Lines, ed. G. Meylan, 139
- Steidel & Sargent (1992) Steidel, C. C., & Sargent, W. L. W. 1992, ApJS, 80, 1
- Stocke et al. (2013) Stocke, J. T., Keeney, B. A., Danforth, C. W., et al. 2013, ApJ, 763, 148
- Tamburro et al. (2009) Tamburro, D., Rix, H.-W., Leroy, A. K., et al. 2009, AJ, 137, 4424
- Tumlinson et al. (2017) Tumlinson, J., Peeples, M. S., & Werk, J. K. 2017, Ann. Rev. of Astron. and Astrophys., 55, 389
- Tumlinson et al. (2011) Tumlinson, J., Thom, C., Werk, J. K., et al. 2011, Science, 334, 948
- Tumlinson et al. (2013) —. 2013, ApJ, 777, 59
- Turnshek et al. (2015) Turnshek, D. A., Monier, E. M., Rao, S. M., et al. 2015, MNRAS, 449, 1536
- van Albada et al. (1985) van Albada, T. S., Bahcall, J. N., Begeman, K., & Sancisi, R. 1985, ApJ, 295, 305
- van de Hulst (1945) van de Hulst, H. C. 1945, Nederl. Tij. Natuurkunde, 11, 201
- van der Hulst et al. (2001) van der Hulst, J. M., van Albada, T. S., & Sancisi, R. 2001, in Astronomical Society of the Pacific Conference Series, Vol. 240, Gas and Galaxy Evolution, ed. J. E. Hibbard, M. Rupen, & J. H. van Gorkom, 451
- Verheijen et al. (2007) Verheijen, M., van Gorkom, J. H., Szomoru, A., et al. 2007, ApJ, 668, L9
- Wakker et al. (2011) Wakker, B. P., Lockman, F. J., & Brown, J. M. 2011, ApJ, 728, 159
- Walter et al. (2008) Walter, F., Brinks, E., de Blok, W. J. G., et al. 2008, AJ, 136, 2563
- Werk et al. (2014) Werk, J. K., Prochaska, J. X., Tumlinson, J., et al. 2014, ApJ, 792, 8
- Wolfe et al. (1981) Wolfe, A. M., Briggs, F. H., & Jauncey, D. L. 1981, ApJ, 248, 460
- Wolfe et al. (1985) Wolfe, A. M., Briggs, F. H., Turnshek, D. A., et al. 1985, ApJ, 294, L67
- Wolfe et al. (1976) Wolfe, A. M., Brown, R. L., & Roberts, M. S. 1976, Phys. Rev. Lett., 37, 179
- Wolfe & Davis (1979) Wolfe, A. M., & Davis, M. M. 1979, AJ, 84, 699
- Wolfe et al. (2005) Wolfe, A. M., Gawiser, E., & Prochaska, J. X. 2005, Ann. Rev. of Astron. and Astrophys., 43, 861
- Wolfire et al. (1995) Wolfire, M. G., Hollenbach, D., McKee, C. F., Tielens, A. G. G. M., & Bakes, E. L. O. 1995, ApJ, 443, 152
- Wolfire et al. (2003) Wolfire, M. G., McKee, C. F., Hollenbach, D., & Tielens, A. G. G. M. 2003, ApJ, 587, 278
- York et al. (2000) York, D. G., Adelman, J., Anderson, Jr., J. E., et al. 2000, AJ, 120, 1579
- Zhu & Ménard (2013) Zhu, G., & Ménard, B. 2013, ApJ, 770, 130
- Zwaan et al. (2015) Zwaan, M. A., Liske, J., Péroux, C., et al. 2015, MNRAS, 453, 1268
- Zwaan et al. (2005a) Zwaan, M. A., Meyer, M. J., Staveley-Smith, L., & Webster, R. L. 2005a, MNRAS, 359, L30
- Zwaan et al. (2005b) Zwaan, M. A., van der Hulst, J. M., Briggs, F. H., Verheijen, M. A. W., & Ryan-Weber, E. V. 2005b, MNRAS, 364, 1467
- Zwaan et al. (2001) Zwaan, M. A., van Dokkum, P. G., & Verheijen, M. A. W. 2001, Science, 293, 1800