Generation of atomic spin orientation with a linearly polarised beam in room-temperature alkali-metal vapour
Abstract
Traditionally, atomic spin orientation is achieved by the transfer of angular momentum from polarised light to an atomic system. We demonstrate the mechanism of orientation generation in room-temperature caesium vapours that combines three elements: optical pumping, non-linear spin dynamics and spin-exchange collisions. Through the variation of the spin-exchange relaxation rate, the transition between an aligned and an oriented atomic sample is presented. The observation is performed by monitoring the atomic radio-frequency spectra. The measurement configuration discussed, paves the way to simple and robust radio-frequency atomic magnetometers that are based on a single low power laser diode that approach the performance of multi-laser pump-probe systems.
I Introduction
The generation of spin polarization is an essential step in the study and application of a large variety of systems, from solid-state samples Awschalom2018 to cold atomic ensembles Jessen2013 ; Chalopin2018 . In the atomic physics domain, the standard method (optical pumping) relies on the transfer of angular momentum from polarised light to the atomic system Happer1972 . While a typical scheme involves the interaction of an atomic sample with a circularly polarised laser beam propagating along a static magnetic field, other configurations, including different polarisation Fortson1987 ; Klipstein1996 ; Andalkar2002 and number of lasers Wasilewski2010 , have been demonstrated. Optical pumping also covers the transfer of optical angular momentum to the target atoms achieved via spin-exchange collisions (SEC) Walker1997 ; Appelt1998 . Another category of spin polarization processes combines optical pumping with non-linear spin dynamics Smith2004 ; Chalupczak2015 . One particular realization of this is the so-called effect of alignment to orientation conversion, which involves the evolution of an atomic population imbalance in mutually orthogonal magnetic and electric fields Cohen-Tannoudji1969 ; Lombardi1969 ; Hilborn1994 ; Budker2000 ; Kuntz2002 ; Auzinsh2010 ; Rochester2012 . In this way, tensor polarization, (alignment) where the spins are aligned along a preferred axis but no preferred direction, can be transformed into a vector polarization, (orientation) where spins are biased in one direction Auzinsh2010 . A similar efect has been achieved within the excited state hyperfine sublevels in the presence of either an electric or magnetic field Krainska1979 ; Han1991 ; Alnis2001 ; Auzinsh2006 ; Auzinsh2015 .
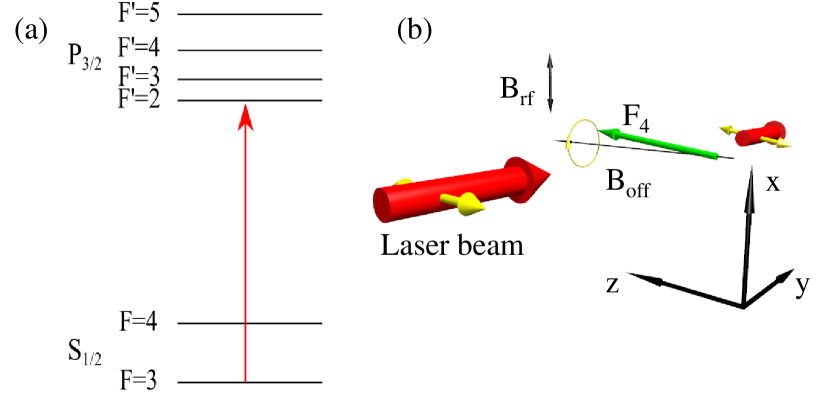
In this paper, we explore the mechanism of the generation of spin orientation in room-temperature Caesium vapour that combines three elements: (1) off-resonant optical pumping, (2) non-linear spin dynamics and (3) SEC (selective relaxation and coherence transfer Ruff1965 ; Haroche1970 ; Happer1977 ; Skalla1996 ; Chalupczak2014 ). (1) A linearly polarized laser beam moves the atomic population from the F=3 to F=4 manifold through off-resonant optical pumping, while creating a population imbalance (alignment) within both levels, Fig. 1 (a). The particular frequency detuning of the beam ensures that the majority of the population transferred to the F=4 level goes to either stretched states, i.e. sublevels with a maximum or minimum magnetic quantum number. While the dynamics within the F=3 level is defined by the resonant coupling to the laser field, the F=4 atomic spins evolve only in the presence of both weak far-off resonant optical and SEC couplings. (2) The weak coupling to the optical field drives the non-linear spin dynamics that breaks the population distribution symmetry. In particular, it moves some of the population out of one of the stretched states, effectively making the atoms more prone to SEC relaxation (3). As a consequence of these two factors (non-linear spin dynamics and SEC), we observe suppression of components representing one of the spin directions that contributes to alignment and the generation of atomic orientation at low magnetic fields. In contrast to standard alignment to orientation conversion experiments Cohen-Tannoudji1969 ; Lombardi1969 ; Hilborn1994 ; Budker2000 ; Kuntz2002 ; Auzinsh2010 , the change of the spin polarization discussed here is produced with a parallel magnetic and electric (linearly polarized laser beam) fields. In a sense, the mechanisms demonstrated here are a generalisation of that presented in Chalupczak2015 , where the major difference between the two experiments is the initial state created by the pumping process. While the indirect pumping implemented in Chalupczak2015 creates a system with 80% of the population in the stretched state, here the starting point is an aligned state. This enables us to demonstrate a continuous transition from the aligned to oriented state with the scan of the Larmor frequency or the linearly polarized beam power.
The immediate implementation of the discussed technique is in the area of radio-frequency (rf) atomic magnetometry Savukov2005 ; Chalupczak2018 . State-of-the-art rf atomic magnetometers take advantage of the properties of an oriented atomic polarization Savukov2005 ; Lee2006 ; Savukov2007 ; Chalupczak2012a . This polarization ensures immunity of the magnetometer signal to SEC decoherence Appelt1999 ; Scholtes2011 ; Chalupczak2012 and enables a high signal-to-noise ratio (SNR) of the sensor. Possible applications of ultrasensitive rf magnetic field sensors cover a wide range of technologies from chemical analysis Lee2006 ; Savukov2007 ; Bevilacqua2017 to the non-destructive testing of materials Wickenbrock2014 ; Bevington2018 ; Bevington2019 ; Bevington2019a ; Bevington2019b . A standard method for generating orientation in alkali metal atoms (optical pumping) uses a circularly polarized laser beam operating on the D1 line Ledbetter2008 . For even more efficient pumping, an additional laser, the so-called repumper, is added to transfer the atoms from the other hyperfine ground state Wasilewski2010 . In this configuration, the signal readout is done by a linearly polarized laser beam operating on the D2 line. Consequently, the magnetometer arrangement involves two or three lasers operating at different frequencies. The concept discussed here achieves a comparable sensor performance (SNR) with a single laser diode, which significantly simplifies the instrumentation.
The following part contains a brief description of the experimental instrumentation. The components of the atomic spin orientation mechanism are explored through the dependencies of the rf spectroscopy signal on three measurement parameters (laser frequency detuning, beam power and magnetic field strength), which are discussed in the subsequent sections.
II Experimental setup
The measurements are performed in a shielded environment Chalupczak2012a ; Chalupczak2012 ; Chalupczak2014 ; Chalupczak2015 . The ambient magnetic field is suppressed by the use of five layers of cylindrical shields with end caps, made from 2-mm thick mu-metal. A solenoid inside the shield generates a well-controlled offset magnetic field, , along axis, Fig. 1 (b), with a relative homogeneity exceeding over the length of the cell. The atoms used are a Caesium atomic vapour housed in a paraffin-coated, cross-shaped, quartz cell (22 mm in diameter and arm lengths of 32 mm) at ambient temperature (atomic density ). These atoms are optically pumped by a linearly polarised laser beam, 20 mm in diameter, propagating orthogonally to the direction of , Fig. 1 (b). The polarization of the beam is parallel to . The beam is provided by a DBR diode laser operating on the caesium D2 line [Fig. 1 (a)] and can be frequency stabilized within with respect to the master laser frequency using offset locking. The same linearly polarised beam also acts as a probe of the spin precession via the Faraday effect Takahashi1999 , where the evolution of the collective atomic spin is mapped onto the polarization state of the linearly polarized probe beam Savukov2005 ; Ledbetter2008 ; Wasilewski2010 ; Chalupczak2012a ; Bevilacgua2016 . The laser light transmitted through the cell is analysed by a polarimeter consisting of a crystal polariser oriented at with respect to the incident polarization and a commercial balanced photodetector. The two quadrature components of the resulting signal X and Y (where X is the in-phase and Y is the out-off-phase components, R=) are measured by a lock-in amplifier, referenced to the first harmonic of the driving rf field () frequency.
III Off-resonant pumping
The change in population of the F=3 and F=4 ground states induced by the off-resonant pumping can be described by a pair of rate equations Atoneche2017 :
| (1) |
where index refers to the P3/2 excited state levels, the pair of indices equal , and refer to the F=3 and F=4 S1/2 ground state levels and is the coupling coefficient between the ground and excited state. The absorption rate depends on the detuning of the pumping light from the relevant atomic transition. In our case, this dependence is dominated by Doppler broadening. Calculations based on the above equation show that the optimal condition (laser detuning) for population transfer from the F=3 to F=4 level and the generation of a population imbalance within the F=4 manifold are mutually exclusive. The former is optimised when the laser frequency is tuned in the vicinity of the S1/2 F=3P3/2 F’= 4 transition, at which the latter effect is minimised.
In the section below we experimentally identify the frequency range, which optimises the build-up of orientation in the F=4 level.
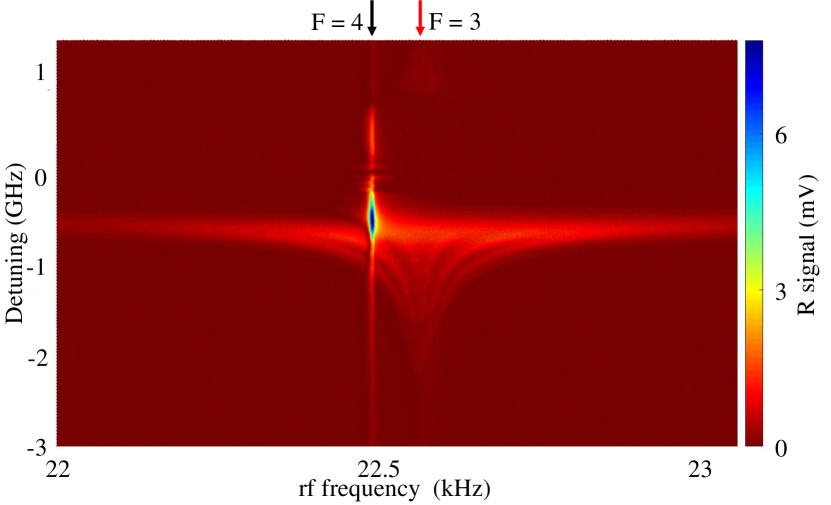
Figure 2 shows the rf signal magnitude, R, as the frequency of the linearly polarised laser beam is scanned across the group of D2 line transitions involving the F=3 ground-state (zero detuning represents the S1/2 F=3P3/2 F’=2 transition). The relatively small amplitude of (Larmor frequency ) ensures that, on one hand, the contributions from both ground-state levels can be individually distinguished and, on the other, the Zeeman levels in a particular manifold are degenerate. The splitting between components of the F=3 spectral profiles is defined solely by the tensor light shift. In particular, as the laser frequency approaches the atomic resonance, the tensor light shift in F=3 increases, and consequently, so does the splitting between the components of the relevant profile. Due to the relatively large detuning from resonance, there is no significant splitting in the F=4 profile. Efficient pumping from the F=3 to the F=4 level, in the vicinity of the S1/2 F=3P3/2 F’= 4 transition, results in the asymmetry in the F=3 signal amplitude with respect to the laser detuning. The exact detuning where the maximum in the F=4 signal is observed varies with the laser power and ranges from (3.3 mW) to (10 mW). While the observation of off-resonant F=4 pumping is similar to that observed on the D1 transition Chalupczak2010 , there are two differences worth pointing out. Firstly, the maximum pumping between the manifolds is reached for a non-zero laser detuning ( for the measurements represented in Fig. 2). Secondly, the character of the generated polarization within the F=3 (alignment) and F=4 (orientation) levels is different.
IV Non-linear dynamics
The F=4 atomic spins only evolve in the presence of weak far-off resonant optical and SEC couplings. The linearly polarized light () couples to the atomic ground state through the tensor ac polarizability (single-spin Hamiltonian, without the scalar part of the light shift , where is the total angular momentum operator of the i’th atom). Therefore in general, the atomic spin dynamics will exhibit a non-linear character Smith2004 ; Chalupczak2015 . The topic of atomic spin evolution in the presence of an electric and magnetic field has been the subject of a number of theoretical Rochester2012 and experimental Budker2000 ; Kuntz2002 ; Smith2004 ; Chalupczak2015 studies. Mostly, the focus of these explorations was on measurement configurations where the two fields were orthogonal. In such a case, as shown in Rochester2012 , the atomic polarization exposed to a static magnetic and an off-resonant ac electric field begins to oscillate between two types of atomic polarization with an oscillation period equal to , where is equal to the line separation generated by the tensor light shift. As pointed out in Smith2004 the non-linear dynamics critically depends on the relative angle between the fields, , i.e. in the arrangement discussed here, the angle between the laser beam polarization and the axis. In particular, the non-linear behaviour, quantified in Smith2004 by the spin decoherence, is twice as strong for an angle of than for , while it disappears at . Also, there has been a demonstration of an alkali-metal spin maser based on non-linear spin dynamics, which was performed at Chalupczak2015 . In the presence of SEC decoherence the behaviour of the system is defined by a combination of processes, which is characterised by the ratio of the and SEC relaxation rates. Calculation of the spectral splitting Footnote indicates that varies between and for a linearly polarised beam power of and 9 mW respectively. This is smaller than the relaxation rate due to SEC, Chalupczak2014 . This indicates that the SEC process dominates the spin dynamics and while a small can trigger non-linear dynamics (similar to Chalupczak2015 ), the system will not perform a full oscillation between atomic polarisation states. Intuitively, the mechanism is similar to the evolution of the atomic spin in a near-zero static magnetic field, where the combination of three effects (optical pumping, slow spin precession around the magnetic field and decoherence) effectively leads to a tilt of the steady-state spin polarization with respect to its initial state Kominis2003 . Here, the combination of (1) off-resonant pumping, which creates the alignment in the F=4 manifold, (2) non-linear spin dynamics that drives the alignment to orientation conversion, and (3) SEC decoherence results in a change (asymmetry) in the initial population distribution. The effect of conversion from alignment to orientation is enhanced by the SEC coherence transfer, which is discussed in the following section.
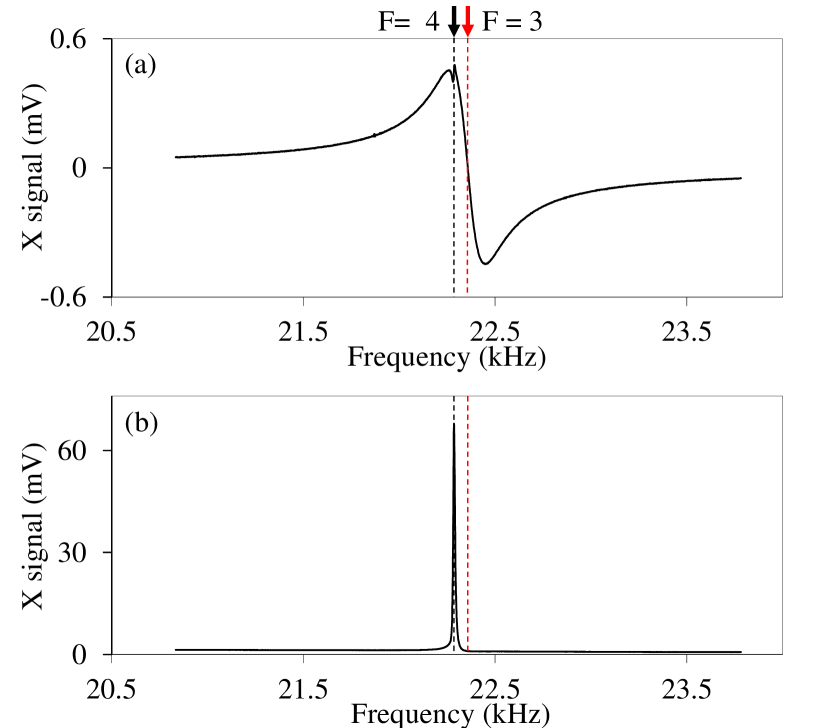
Figure 3 shows the X component of the rf spectra recorded with a laser power of 200 W (a) and 9.1 mW (b). The positions of the F=3 and F=4 resonances are marked with red and black arrows respectively. Polarization-rotation resonances are observed when the rf field frequency matches the splitting between neighbouring Zeeman sublevels introduced by . In an aligned system, the rf response consists of two profiles with an opposite sign, leading to a dispersive-like lineshape. At low power, Fig. 3 (a), the rf spectrum consists of a large broad feature due to alignment in the F=3 level created by direct optical pumping, with a much smaller structure due to off-resonant excitation into the F=4 manifold. An increase in the laser beam power does not only translate into an increase of the F=3 and F=4 signal amplitude, Fig. 3 (b). While the character of the F=3 profile remains unaltered, the change in the symmetry of the F=4 signal indicates the presence of atomic orientation. The resonant coupling of laser light to the F=3 Zeeman sublevels results in power broadening of their corresponding spectral profiles, which contributes to the broad low amplitude background visible in Fig. 3 (b).
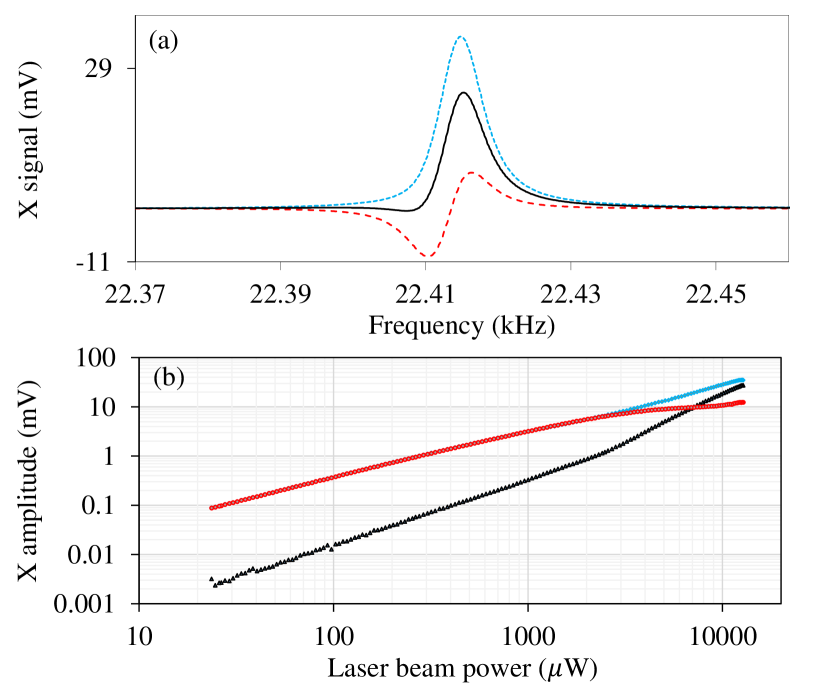
To confirm that the F=4 spectral profile represents atomic orientation, pumping with a circularly polarized (pump) beam propagating along the direction of ( axis, Fig. 1) was added Chalupczak2012 . The pump beam is generated by a diode laser, frequency locked to the Caesium S1/2 F=3P3/2 F’=2, 3 crossover. The solid black line in Fig. 4 (a) shows the rf spectrum for the F=4 profile recorded with only the linearly polarized beam. The dashed red and pointed blue lines represent the case where one of the two orthogonal circular polarisations of the pump beam is added. The presence of the pump beam creates atomic orientation in the sample (parallel or anti-parallel to ). If the orientation generated by the linearly polarised beam and pump beam coincide, the amplitude of the observed profile increases [pointed blue line in Fig. 4 (a)]. For the case with the opposite pump polarisation, the signal amplitude decreases and the character of the spectrum changes (dashed red line). The dependencies of the signal amplitude for the opposite pump beam polarisations are shown (red points and blue diamonds ) in Fig. 4 (b). The amplitudes of the signals created by the orthogonally polarized pump beams are equal below 2 mW of probe power. The asymmetry in amplitudes above this power is produced by the sample orientation induced by the linearly polarised beam. The signature of this effect is also present in the amplitude data for the signal produced by only the linearly polarised beam (black triangles). The change from a linear to a quadratic slope in the amplitude power dependence, seen above 2 mW, confirms the non-linear character of the underlying mechanism.
V Spin-exchange collisions
The contribution of non-linear spin dynamics to the generation of orientation is enhanced by SEC driven coherence transfer Ruff1965 ; Haroche1970 ; Happer1977 ; Skalla1996 ; Chalupczak2014 . The effect relies on the macroscopic exchange of the excitation between different coherence modes subject to a resonance condition, which links the difference between the relevant coherence frequencies and the coherence relaxation rate Haroche1970 . If the size of the mismatch between the frequencies of the different modes is comparable to the SEC decoherence rate, rapid SECs average out the coherence precession with different Larmor frequencies leading to a prolonged oscillation at the averaged frequency Happer1977 . Intuitively, the resonant condition for coherence transfer is equivalent to an overlap of the spectroscopic profiles of the relevant coherences in the rf spectrum. For the case considered here, the degeneracy between the F=4 Zeeman sublevel transition frequencies leads to an automatic realisation of the resonance condition, i.e. the frequency mismatch (dephasing) between the precessing spins affected and not affected by SEC is negligible, so long as the SEC processes do not involve manifold change. Consequently, SEC processes do not contribute to relaxation and a reduction in the SEC dominated decoherence rate is observed Chalupczak2014 . One of the signatures of this coherence transfer is that the spectral profiles representing the relevant coherences group (merge) around the leading component of the spectrum Happer1977 ; Chalupczak2014 .
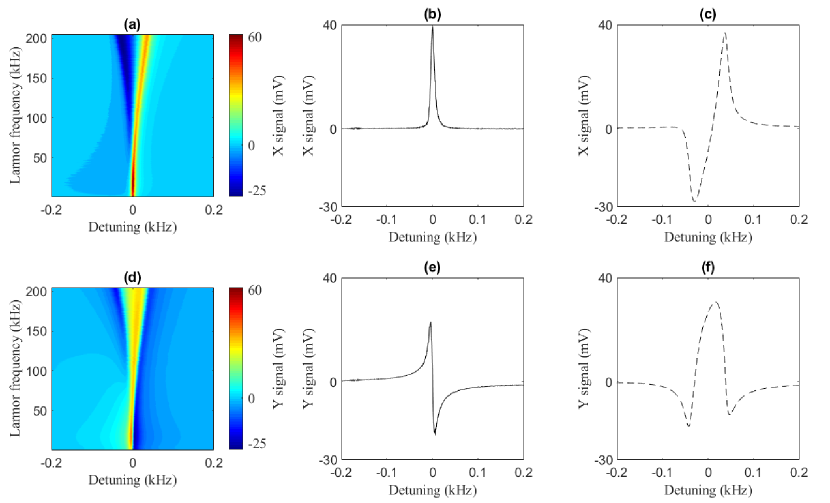
Figure 5 shows the dependence of the two normalised quadratures (X and Y) of the rf spectroscopy signal on (in terms of Larmor frequency). The normalization takes into account the variation of the amplitude and phase of the rf spectroscopy signal with operating frequency and was performed in the standard pump-probe configuration Chalupczak2012 over the same range of . It is worth pointing out that SEC processes have a twofold contribution to the generation of orientation. Due to coherence transfer, tuning the strength of the offset magnetic field is equivalent to changing the value of the SEC relaxation rate. Reduction in the decoherence rate extends the duration of the non-linear alignment to orientation evolution. Collisions between atoms in their stretched state does not introduce relaxation as the total angular momentum must be conserved, therefore selective SEC relaxation depopulates all but the stretched state. The spectral profile for large (Larmor frequency ), Fig. 5 (c) and (f), have a shape typical for atomic alignment, Fig. 3 (a). The decrease of increases the overlap of the components with opposite signs and consequently a reduction of the signal amplitude. Non-linear spin dynamics results in a decrease in the population of the stretched state represented in Fig. 5 (a) and (c) by the profile positioned at detuning from resonance. This results in a higher relaxation rate for the coherences contributing to the part of the spectrum with a negative detuning. Consequently, the amplitude of the component with a negative detuning decreases more rapidly with than the other profile. The small frequency mismatch between these coherence’s (decreasing with the reduction of ) enhances coherence transfer and the build-up of atomic orientation observed over the frequency range below . The spectral profiles observed for Larmor frequencies , Fig. 5 (b) and (e), represent the spin system in the oriented state.
The maximum signal-to-noise ratio, recorded in the measurement conditions discussed here, is 1.3-1.4 times lower than that measured for the optimised indirect pumping scheme, Chalupczak2012 . Since the degree of population polarization described in Chalupczak2012 , i.e. stretched state population as a fraction of total population, was found to be 80% we estimate the degree of polarization in the current configuration to be 72%.
VI Conclusions
We have demonstrated the generation of atomic spin orientation in a room-temperature caesium vapour. The presence of atomic polarization is vital for the operation of a radio-frequency atomic magnetometer. The rf frequency range of the presented technique (-) is interesting in the context of magnetic induction based non-destructive testing, where a low operating frequency translates into a deeper penetration depth of the (so-called primary) magnetic field Bevington2018 ; Bevington2019 ; Bevington2019a ; Bevington2019b . The measurement configuration discussed here combines the efficient generation of the F=4 atomic orientation and off-resonant probing usually achieved with two/ three independent lasers. The obvious benefit of the presented scheme is the simplicity of the instrumentation. Systematic measurements of the signal-to-noise ratio (SNR) confirm that the discussed option delivers a SNR only 1.3-1.4 times lower than recorded in the optimised pump-probe configuration Chalupczak2012 . The relatively sharp peak in the signals frequency dependence, Fig. 2, allows for stabilisation of the laser frequency despite strong saturation of the F=3 resonance. The difficulty that the orientation generated by the linearly polarised beam is observed over a relatively narrow range of could be overcome through the implementation of a degenerate pump-probe configuration, which involves a circularly polarized (pump along the axis) beam and a linearly polarized (probe along the axis) beam operating at the same frequency ( from the S1/2 F=3P3/2 F’=2 transition). It is worth pointing out that this frequency for the pump beam is not far from that used in the optimised indirect pumping scheme, which means that a relatively small power, W, will be required Chalupczak2012 . The Caesium ground state hyperfine splitting () defines the detuning of the laser frequency from F=4, which affects the signal amplitude and non-linearity strength. Hence, the use of 85Rb vapour (hyperfine splitting of ) would improve sensor performance in two ways. (1) Smaller detuning of the light monitoring the atomic spin evolution will increase the recorded signal amplitudes and potentially improve the SNR. (2) The strength of the tensor couplings scales inversely with the square of the laser detuning Sherson2008 . Implementation of 85Rb vapour would reduce the linearly polarized beam power threshold for non-linear effects by nearly an order of magnitude (W). Preliminary tests indicate that the combination of a degenerate pump-probe and the use of 85Rb vapour would enable efficient operation of the atomic magnetometer with 4 mW of laser light power, which is achievable from a single Vertical-Cavity Surface-Emitting Laser diode.
VII Acknowledgements
Acknowledgements.
The work was funded by UK Department for Business, Innovation and Skills as part of the National Measurement System Program. P.B. was supported by the Engineering and Physical Sciences Research Council (EPSRC) (No. EP/P51066X/1).References
- (1) D. D. Awschalom, Ronald Hanson, J. Wrachtrup, and B. B. Zhou, Nat. Photonics 12, 516 (2018).
- (2) A. Smith, B. E. Anderson, H. Sosa-Martinez, C. A. Riofrío, I. H. Deutsch, and P. S. Jessen, Phys. Rev. Lett. 111, 170502 (2013).
- (3) T. Chalopin, C. Bouazza, A. Evrard, V. Makhalov, D. Dreon, J. Dalibard, L. A. Sidorenkov, and S. Nascimbene, Nat. Commun. 9, 4955 (2018).
- (4) W. Happer, Rev. Mod. Phys. 44, 169 (1972).
- (5) N. Fortson, and B. Heckel, Phys. Rev. Lett. 59, 1281 (1987).
- (6) W. M. Klipstein, S. K. Lamoreaux, and E. N. Fortson, Phys. Rev. Lett. 76, 2266 (1996).
- (7) A. Andalkar, R. B. Warrington, M. V. Romalis, S. K. Lamoreaux, B. R. Heckel, and E. N. Fortson, Phys. Rev. A 65, 023407 (2002).
- (8) W. Wasilewski, K. Jensen, H. Krauter, J. J. Renema, M. V. Balabas, and E. S. Polzik, Phys. Rev. Lett. 104, 133601 (2010).
- (9) T. G. Walker, and W. Happer Rev. Mod. Phys. 69, 629 (1997).
- (10) S. Appelt, A. B. Baranga, C. J. Erickson, M. Romalis, A. R. Young, and W. Happer, Phys. Rev. A 58, 1412 (1998);
- (11) G. A. Smith, S. Chaudhury, A. Silberfarb, I. H. Deutsch, and P. S. Jessen, Phys. Rev. Lett. 93, 163602 (2004).
- (12) W. Chalupczak, and P. Josephs-Franks, Phys. Rev. Lett. 115, 033004 (2015).
- (13) M. Lombardi, J. Phys. (Paris) 30, 631 (1969).
- (14) C. Cohen-Tannoudji and J. Dupont-Roc, Opt. Commun. 1, 184 (1969).
- (15) R. C. Hilborn, L. R. Hunter, K. Johnson, S. K. Peck, A. Spencer, and J. Watson, Phys. Rev. A 50, 2467 (1994).
- (16) D. Budker, D. F. Kimball, S. M. Rochester, V. V. Yashchuk Phys. Rev. Lett. 85, 2088 (2000).
- (17) M. C. Kuntz, R. C. Hilborn, and A. M. Spencer, Phys. Rev. A 65, 023411 (2002).
- (18) M. Auzinsh, D. Budker, and S. M. Rochester, Optically polarized atoms, Oxford University Press (2010).
- (19) S. M. Rochester, M. P. Ledbetter, T. Zigdon, A. D. Wilson-Gordon, D. Budker, Phys. Rev. A 85, 022125 (2012).
- (20) M. Kraińska-Miszczak, J. Phys. B: At. Mol. Phys. 12, 555 (1979).
- (21) X. L. Han and G. W. Schinn, Phys. Rev. A 43, 266 (1991).
- (22) J. Alnis and M. Auzinsh, Phys. Rev. A 63, 023407 (2001).
- (23) M. Auzinsh, K. Blushs, R. Ferber, F. Gahbauer, A. Jarmola, and M. Tamanis, Phys. Rev. Lett. 97, 043002 (2006).
- (24) M. Auzinsh, A. Berzins, R. Ferber, F. Gahbauer, L. Kalvans, A. Mozers, and A. Spiss, Phys. Rev. A 91, 053418 (2015).
- (25) G. A. Ruff and T. R. Carver, Phys. Rev. Lett. 15, 282 (1965).
- (26) S. Haroche and C. Cohen-Tannoudji, Phys. Rev. Lett. 24, 974 (1970).
- (27) W. Happer and A. C. Tam, Phys. Rev. A 16, 1877 (1977).
- (28) J. Skalla, G. Wackerle, and M. Mehring, Opt. Commun. 127, 31 (1996).
- (29) W. Chalupczak, P. Josephs-Franks, B. Patton, and S. Pustelny, Phys. Rev. A 90, 042509 (2014).
- (30) I. M. Savukov, S. J. Seltzer, M. V. Romalis, and K. L. Sauer, Phys. Rev. Lett. 95, 063004 (2005).
- (31) W. Chalupczak, R. M. Godun, and S. Pustelny, Advances in At. Mol. and Opt. Phys. 67, 297-336 (2018).
- (32) S.K.Lee, K.L.Sauer, S.J.Seltzer, O.Alem, and M. V. Romalis,Appl. Phys. Lett. 89, 214106 (2006).
- (33) I. M. Savukov, S. J. Seltzer, and M. V. Romalis, J. Magn. Res. 185, 214 (2007).
- (34) W. Chalupczak, R. M. Godun, S. Pustelny, and W. Gawlik, Appl. Phys. Lett. 100, 242401 (2012).
- (35) S. Appelt, A. B. A. Baranga, A. R. Young, and W. Happer, Phys. Rev. A 59, 2078, 1999.
- (36) T. Scholtes, V. Schultze, R. IJsselsteijn, S. Woetzel, and H.G. Meyer, Phys. Rev. A 84, 043416, 2011.
- (37) W. Chalupczak, R. M. Godun, P. Anielski, A. Wojciechowski, S. Pustelny, and W. Gawlik, Phys. Rev. A 85, 043402 (2012).
- (38) G. Bevilacqua, V. Biancalana, Y. Dancheva, A. Vigilante, A. Donati, and C. Rossi, J. Phys. Chem. Lett. 8, 6176 (2017)
- (39) A. Wickenbrock, S. Jurgilas, A. Dow, L. Marmugi, and F. Renzoni, Opt. Lett. 39, 6367 (2014).
- (40) P. Bevington, R. Gartman, W. Chalupczak, C. Deans, L. Marmugi, and F. Renzoni, App. Phys. Lett. 113, 063503 (2018).
- (41) P. Bevington, R. Gartman, and W. Chalupczak, Rev. Sci. Instrum. 90, 013103 (2019).
- (42) P. Bevington, R. Gartman, and W. Chalupczak, J. Appl. Phys. 125, 094503 (2019).
- (43) P. Bevington, R. Gartman and W. Chalupczak, App. Phys. Lett. 115, 173502 (2019).
- (44) M. P. Ledbetter, I. M. Savukov, V. M. Acosta, D. Budker, and M. V. Romalis, Phys. Rev. A 77, 033408 (2008).
- (45) Y. Takahashi, K. Honda, N. Tanaka, K. Toyoda, K. Ishikawa, and T. Yabuzaki, Phys. Rev. A 60, 4974 (1999).
- (46) G. Bevilacqua, V. Biancalana, P. Chessa, and Y. Dancheva, Appl. Phys. B 122, 103 (2016).
- (47) F. Atoneche and A. Kastberg, Eur. J. Phys. 38 (2017).
- (48) W. Chalupczak, P. Josephs-Franks, S. Pustelny, and W. Gawlik, Phys. Rev. A 81, 013422 (2010).
- (49) The calculated values of are consistent with the broadening of the rf spectra that were the source of the amplitude data in Fig. 4 (b) and those measured in W. Chalupczak, A. Wojciechowski, S. Pustelny, and W. Gawlik, Phys. Rev. A 82, 023417 (2010).
- (50) I. K. Kominis, T. W. Kornack, J. C. Allred, and M. V. Romalis, Nature 422, 596 (2003).
- (51) J. Sherson, H. Krauter, R. K. Olsson, B. Julsgraard, and E. S. Polzik, J. Phys. B: at. Mol. Opt. Phys. 41, 223001 (2008).