New Astronomical, Meteorological and Geological Study
of Pieve a Nievole (PT)
Abstract
In this paper we present an analysis of the geological, meteorological and climatic data recorded in Pieve a Nievole (PT) over 24 years and using this data for the establishment of the research structure called "PAN.R.C. - Pieve a Nievole Research Center" and "NGICS - New study of geological and Italian city". These data are compared to check local variations, long term trends and correlation with maen annual temperature. The ultimate goal of this work is to understand long term climatic changes in this geographic area. The analysis is performed using a statistical approach and a particular care is used to minimize any effect due to prejudices in case of lack of data.
Keyword: atmospheric effects - site testing - earthquake data - geological model - methods: statistical - location: Pieve a Nievole.
This paper was prepared with the LaTeX
1 Introduction
In this paper we present an analysis of astronomical, geological, meteorological and climatic data releaved in Pieve a Nievole (PT), a little town in north Tuscany region. This study is a part of “NGICS - New study of geological Italian city” a project by Department of Climatology and Geology of TS Corporation Srl.
We present an analysis of measurements obtained from local geological [11] astronomical and meteorological data [4] [5] and compared in order to check local variations of climatological conditions.
1.1 Location
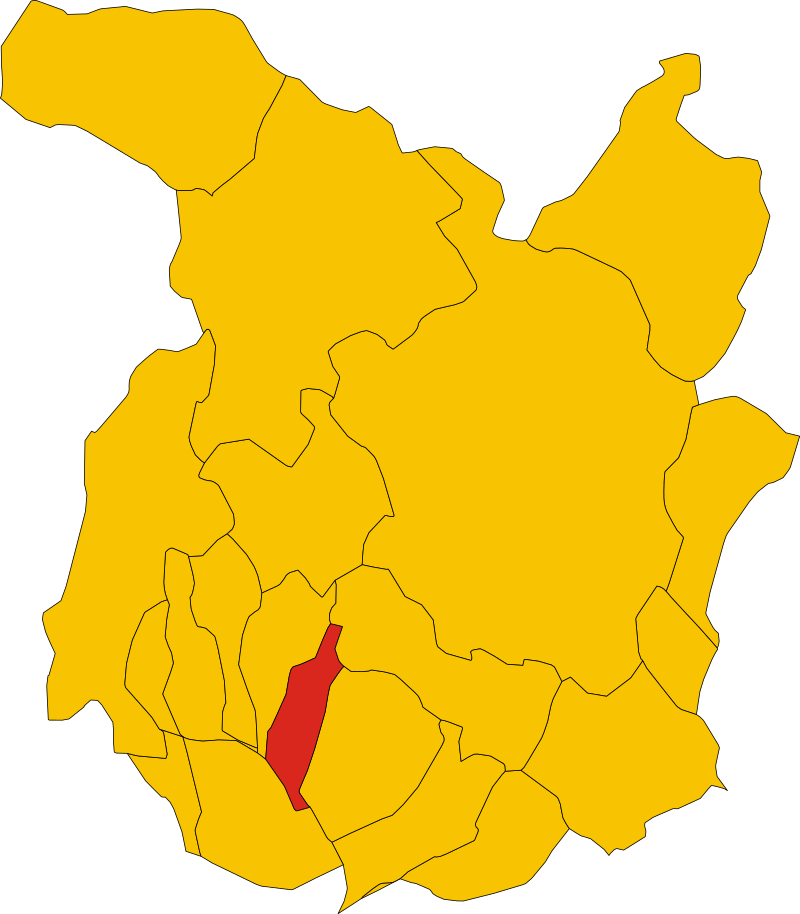
Pieve a Nievole is a small town located north of the Tuscan region in Italy. Here are identifiable altimeter data, the geographic coordinates and seismic data.
Latitudine
Longitude
Altitude mt s.l.
” N
” E
Min 14 - Max 254
Geographic Data of Pieve a Nievole
The geological map of the town is shown in Geological and Seismic data section. [3]
| Seismic Zone | Description |
| 3 | Area with average seismic hazard may occur where earthquakes strong enough. The sub area 3 indicates a value of ag < 0,15g. |
Seismic Data of Pieve a Nievole
2 Annual data analysis
Summers are generally warm and winters are rigid and often winds blow from the north and may last a long time.
The snow appears about one or two times a year, sometimes in large quantities around the appeninical area, moving up to the piedmont areas and rarely up to the coastal areas. The rains dominate the autumn and spring seasons.
The following table identifies climate data assigned by Decree of the President of the Republic n. 412 of 26 August 1993.[2].
Characterized by a fairly humid climate especially in inland and coastal areas, the summer can often record the maximum temperature higher than the district, while in winter with the thermal inversion and the particular conditions in which it occurs, it manages to be the coldest city in the area (obviously compared to the cities in which data is monitored).
Climatic Zone
Day Degrees
D
1.708
Climatic Parameter of Pieve a Nievole
3 Meteo-Climatic Parameter
In this section we describe air temperatures (T), Dew Point, Humidity, Pressure, Day Time and Night Time Variation, Rain’s Days and Fog’s Day, obtained by an accurate analysis of the meteorological data from local data by archive [4]. We analyzed the parameters given in Table 1 and 2.
Should be noted that the values considered are related to the last twenty-four-year average and made available for the period 1990-2014.
Average Annual Temperature
T average warmest (ago-03)
T average coldest (feb-12)
Annual temperature range
Months with average T >
89
Total rainfall 1990-2014 [mm]
26252,48
Rain Days
1868
Fog Days
1052
Storm Days
98
Rain/Storm Days
899
Rain/Snow Days
19
Rain/Fog Days
260
Rain/Thunder/Fog Days
81
Snow Days
9
Wind Speed max Km/h (Mar-1995)
33,06
Wind Speed min Km/h (Nov-2007)
7,00
Rain max mm (Oct-1990)
637,00
Rain min mm (Jul-2009)
1,00
Earthquake Min (2003/06/01)
1,0 Mw
Earthquake Max (2014/10/06)
2,4 Mw
Earthquake Deep Min (2004/10/06)
3,0 Km
Earthquake Deep Max (2005/05/13)
52,0 Km
Parameter of this Study
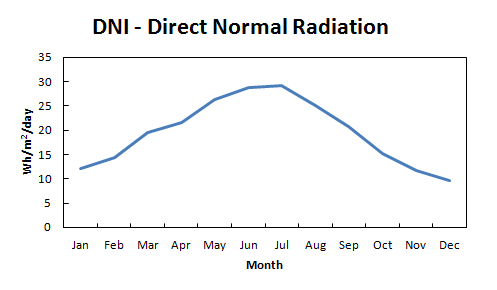
3.1 Solar Radiation Territory
In the study area the values of solar radioation are increasing.
In fact the data irradiation of territory taken from the parameters and the data prepared by the European Union, demonstrate the trend of irradiation for the municipality, visible in next table:
Month
DNI
Month
DNI
Jan
12,05
Feb
14,32
Mar
19,44
Apr
21,54
May
26,24
Jun
28,69
Jul
29,11
Aug
24,99
Sep
20,69
Oct
15,27
Nov
11,67
Dec
9,67
Year
233,68
Direct Normal Irradiance (Wh/m2/day)
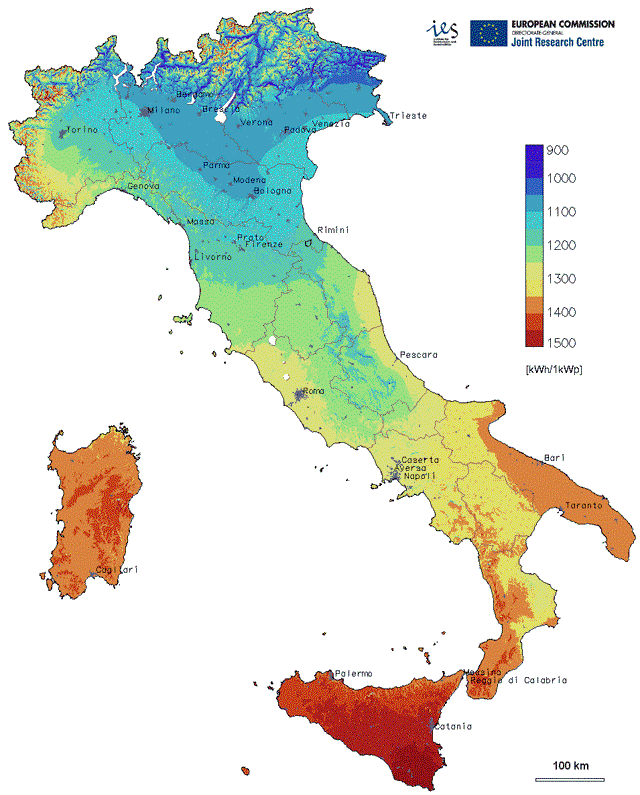
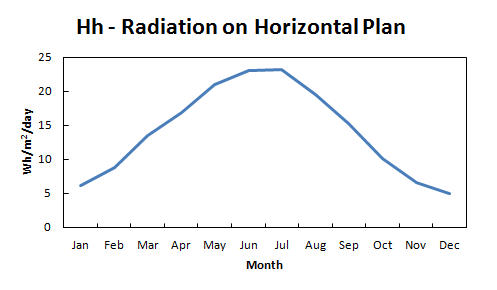
The weather data and the graphs show extrapolated for the territory covered by the study, including a radiation in the range between 1100 and 1200 kWh /1kWp as map prepared by the European Union [13] and visible in figure 17, characterized in over the months, irradiation presented in the graph in Figure 18 and 19, which shows the data of the table above, which shows the territory of Pieve a Nievole, a total irradiance Annual of 233,68 Wh/m2/day.
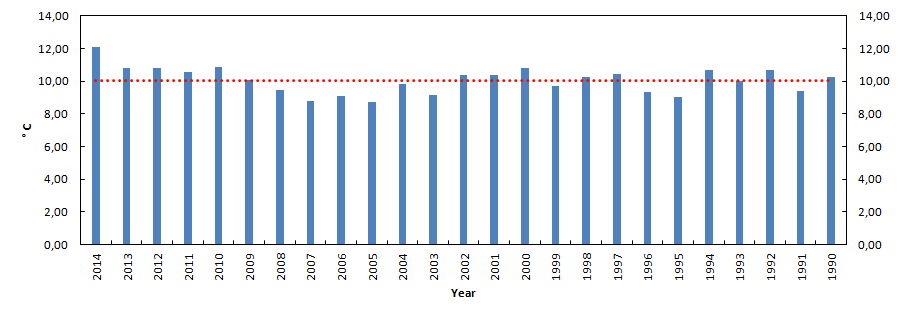
3.2 Temperature
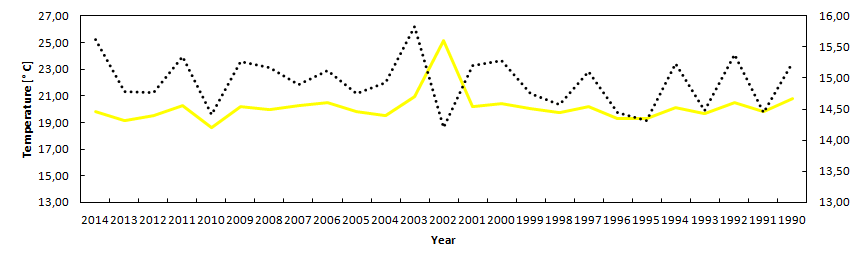
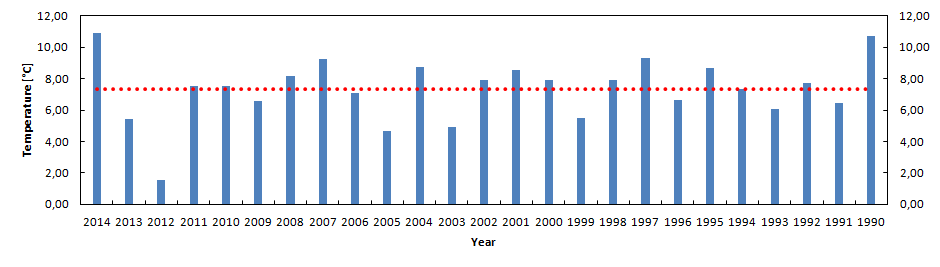
In this section we describe air temperatures (T) obtained by an accurate analysis of the meteorological data. The year average temperature has a tendency to remain stable throughout the study period; next graphics show this evidence:
![[Uncaptioned image]](/html/1910.06101/assets/Media_Temp_mens_su_Media_1990_2014.png) Relationschip of Year Temperature and Average 1990-2014.
Relationschip of Year Temperature and Average 1990-2014.
The values are calculated considering the entire measurement period (1990-2014), drawing on data from the Annuals published by "Il Meteo.it" [4] for the period 1990-2014.
The study shows sudden periods of descent and ascent in the shape of a step from 1990 to 1995, going dows at the end of 1994 and going up around the average in 1997. In the period 1997-2003 the average monthly temperatures were around the average reaching the maximun peak in the August 2003, and the lowest peak in January 2002.
Since 2003 there has been a gradual rise, with the average temperature recorded was lower than the average, to then rise constantly until 2014, the year of the end rewriting of the present study.
![[Uncaptioned image]](/html/1910.06101/assets/Variation_of_Average_Temperature_for_Month.png) Variation of Month Temperature about year 1990-2002 and 2003-2014
Variation of Month Temperature about year 1990-2002 and 2003-2014
The variation in average monthly temperaturees, visible in the previous grph divided into the periods 1990-2002 and 2003-2014, shows the trend of average temperatures. A detailed analysis highlights the following:
-
•
From 1990 to 2002: the variation of occured in the period Apr-May;
-
•
From 2003 to 2014: two period were highlighted where changes were recorded in the Sep-Oct and Nov-Dec.
The graphs shown in Figures 3 and 4 show the performance of the maximum and minimum temperatures proportional to the average of the period of study (1990-2014). The study shows the following trends:
-
•
Minimum temperatures: there was an increase of the values recorded with a higher peak in February 2012, with ;
-
•
Maximum temperatures: evidence for the period 2007-2009 is an increasing trend compared to the 1990-2014 average, while evidence a decrease in the period 1990-1997. The maximum temperature was in August 2003;
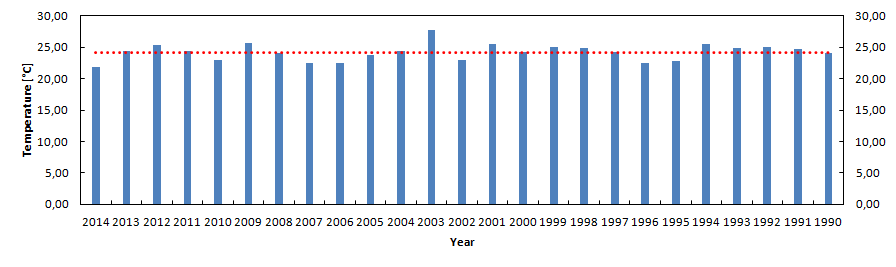
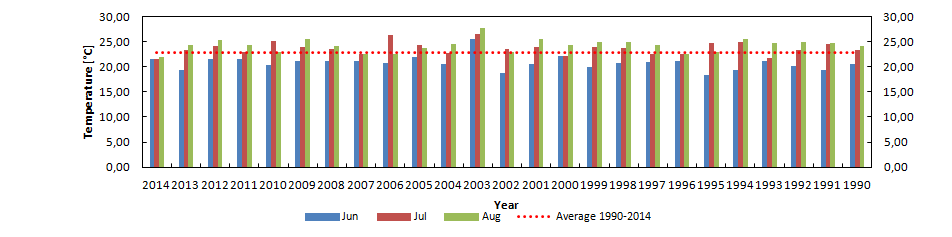
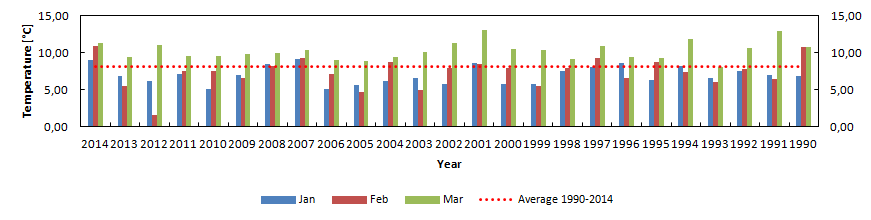
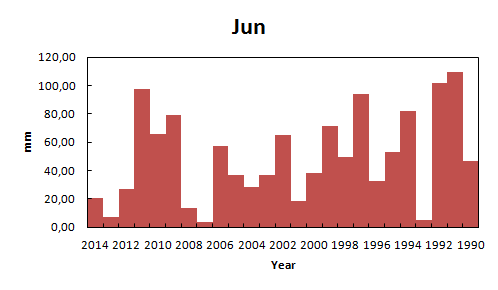
Table 5 shows the trend of the points of maximum temperature expected in the summer quarter (June-July-August) and are shown in Figure 14. Study shows that the month of August 2003 recorded the highest average maximum value in a context in which the entire month recorded in the period 1990-2014 values always above average. Alway Table 6 shows the trend of the points of minimum temperature expected in the winter quarter (January-February-March) and are shown in Figure 15. Study shows that the month of February recorded the highest average minimum value, in a context in which the entire month recorded in the period 1990-2014 values always above average. Studying in particular the months with the values of minimum temperature and maximum minors, the following is noted:
-
•
the month of August (characterized by the presence of the highest value observed in maximum temperatures), shows that trends in temperature has been getting consistently below average for the period 1990 to 2014, while there were two exceedances of this value over the years 2003 and 2012, in agreement with what evident from the graph in Figure 12;
-
•
the month of February (characterization from the the lowest minimum temperature for the period of study), shows that the trend of temperatures has always been, in agreement with what reported in the graph in Figure 13.
3.3 Blackbird days
The day from 29 to 31 January called in the Italian tradition "Blackbird days" are the coldest days of the year. The study showed an upward trend in the reference period, showing an average of .
The following grap shows this trend.
![[Uncaptioned image]](/html/1910.06101/assets/GiorniMerla.png) Blackbird Days from 1990 to 2014.
Blackbird Days from 1990 to 2014.
3.4 Dew point
In this section we describe Dew point obtained by an accurate analysis of the meteorological data. This study showed an average on the dew point of showing that for 14 years the recorded values were above average, as shown in Figure 10, while at the monthly level they were recorded in the study period 6 months over the average, as show in the following graph:
![[Uncaptioned image]](/html/1910.06101/assets/Dewmonth.png) Dew Point for months from 1990 to 2014.
Dew Point for months from 1990 to 2014.
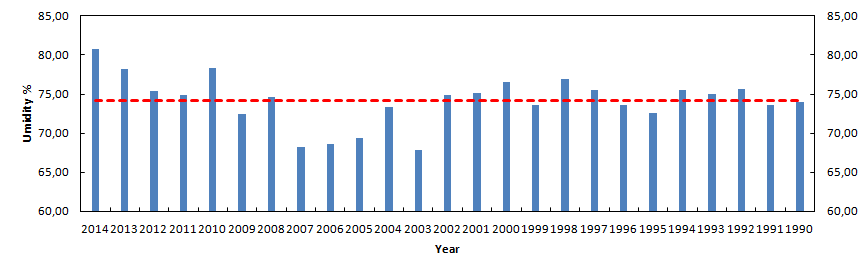
3.5 Humidity
In this section we describe humidity obtained by an accurate analysis of the meteorological data. The study highlights a gap in the annual humidity values equal to 74,17%, calculated according to this formula:
| (1) |
av = annual value, am = average moisture 1990-2014
The graph in Figure 8 shows the trend at the annual level while in the following graph it shows it at a monthly level.
![[Uncaptioned image]](/html/1910.06101/assets/Umiditymonth.png) Humidity Months from 1990 to 2014.
Humidity Months from 1990 to 2014.
The study showed that in the annual period there were 14 years out of a total of 25, while at the monthly level the months above average were 5.
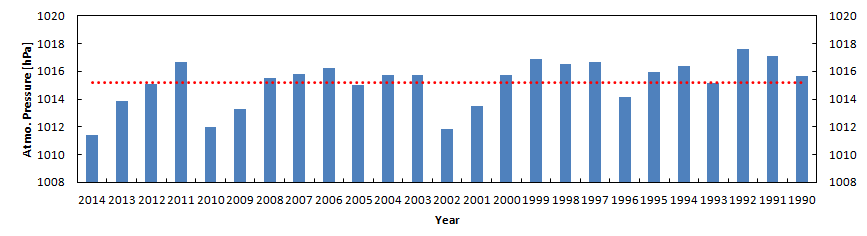
3.6 Pressure
In this section we describe pressure obtained by an accurate analysis of the Pressure data.
The analysis of the data showed an average for the study period of 1015 hPc, a strong monthly increase in the values recorded in Jannuary, Febrary and December, and a monthly decrease in the months of April, May, June and July as shown in the following chart:
![[Uncaptioned image]](/html/1910.06101/assets/Pressuremonth.png) Pressure Months from 1990 to 2014.
Pressure Months from 1990 to 2014.
Analyzing the data at an annual level, we highlight the following:
-
•
an increase in atmospheric pressure over the years: 1990, 1991,1992 (year with the highest level of pressure throughout the study period), 1994, 1995, 1997, 1998, 1999, 2000, 2003, 2004, 2006, 2007, 2008 and 2011;
-
•
a decrease in atmospheric pressure over the years: 1996, 2001, 2002 (the year with the lowest level of pressure throughout the study period), 2009, 2010 2013 and 2014.
In Figure 9 we can see the Pressure Graphics for this study.
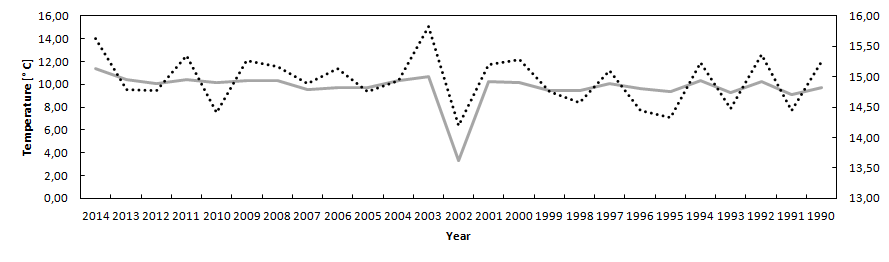
3.7 Day time and night time variation
In this section we describe number of Day time and night time variations obtained by an accurate analysis of the meteorological data.
The annual averages of the differences between day time and night time temperatures have been computed and the results are reported in Table 3. Also in next figure, we can see the plot of oscillations of the seem to reduce the amplitude during the years.
The difference of temperatures, with an average difference of (see table 2) and next figure show these effects.
![[Uncaptioned image]](/html/1910.06101/assets/Media_Escursione_Termica.png) Day time and night time variations (solid line) and Average Day time and Night time variations 1990-2014 (dotted line)
Day time and night time variations (solid line) and Average Day time and Night time variations 1990-2014 (dotted line)
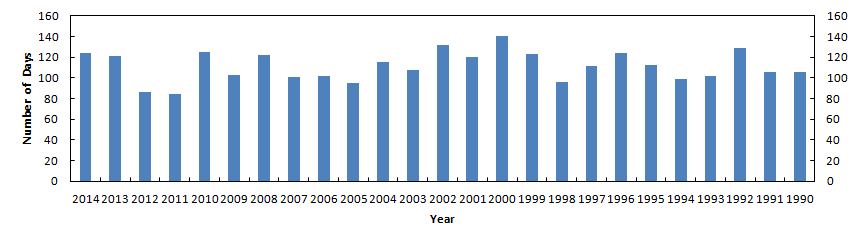
3.8 Rain’s Days
In this section we describe number of Rain’s days obtained by an accurate analysis of the meteorological data.
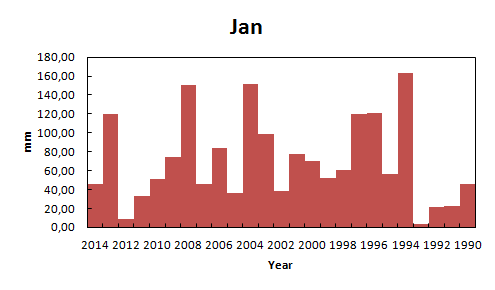
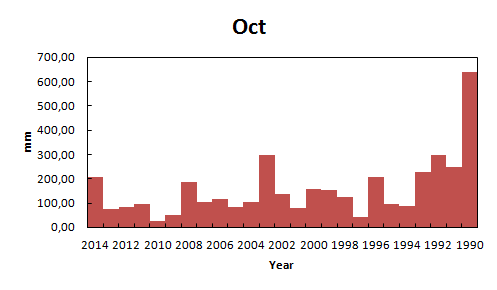
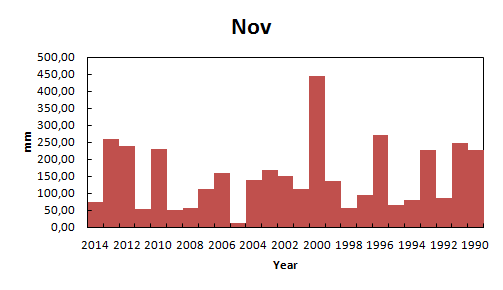
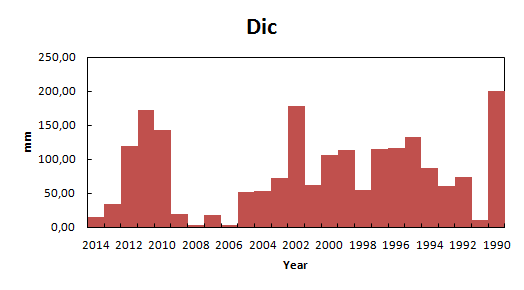
The study showed that if on the one hand at the monthly level the rain were lower than the average - value calculated in 232,17 mm - for a total of 7 months as shown in the following graph,
![[Uncaptioned image]](/html/1910.06101/assets/GiorniPioggiaperMese.png) Days Rain for Month from 1990 to 2014.
Days Rain for Month from 1990 to 2014.
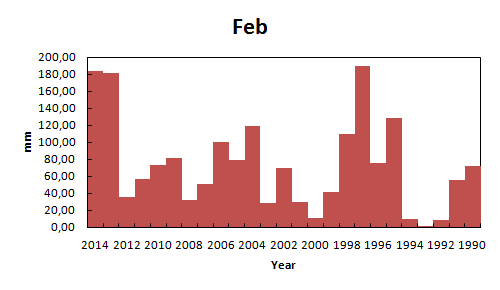
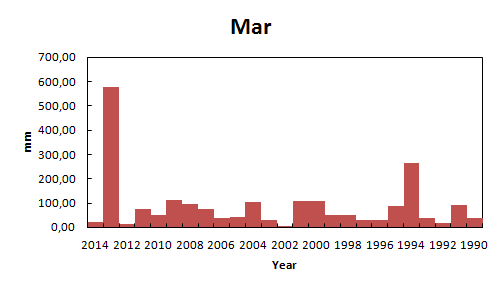
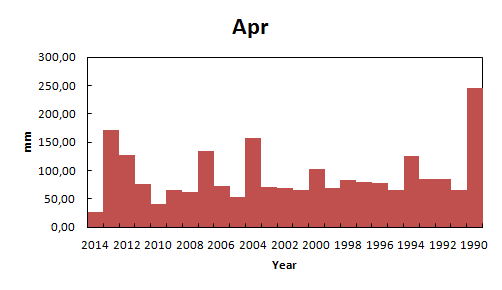
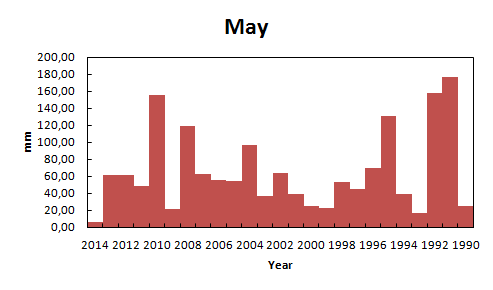
on the other there was an increase in the phenomena extremes at monthly level, as shown in figure 16 where the amounth of ainfall in mm dropped for each single month in the reference period 1990-2014 can be viewed.
The increase in intense rainfall of short duration boosts the risk of flash-food, fast flooding of an area circumscribed morphologically, due to the fast “saturation” of the surface soil that is no longer able to absorb the rain. The episodes of intense precipitation can also determine the phenomena of surface runoff of rainwater with a possible increase in flooding, but also the risk of water pollution (pollutants from agricultural and road runoff).
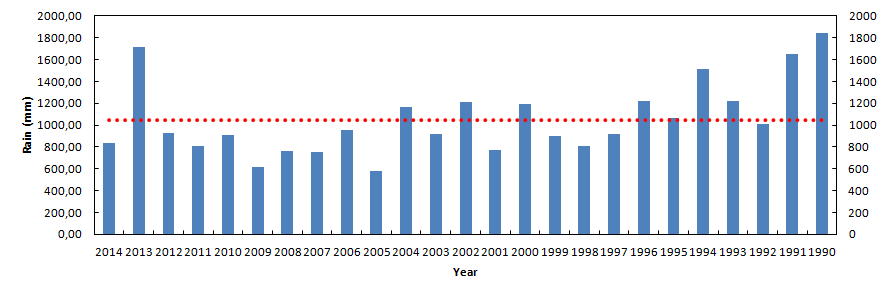
The study period showed an abnormal increase in rainfall. The pie chart shows the ratio between the total mm of rain measured in a year and the total rainfall measured in the period 1990-2014, according to this formula:
| (2) |
a = annual rainfall value, b = total value of the rain period
![[Uncaptioned image]](/html/1910.06101/assets/Percent_of_Rain.png) % of Rain for this study.
% of Rain for this study.
In Figure 6 and 7 we can see the total of rain/year in this study. The values are visible in the table 3. Next pie chart evidence type of rain for this study.
![[Uncaptioned image]](/html/1910.06101/assets/Type_of_Rain.png) Type of Rain for this study.
Type of Rain for this study.
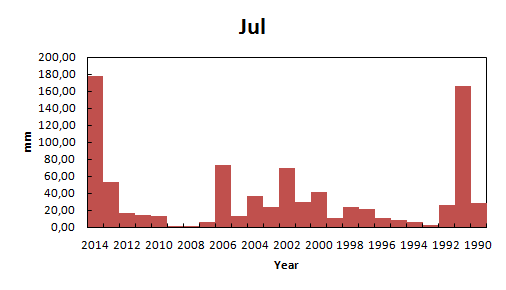
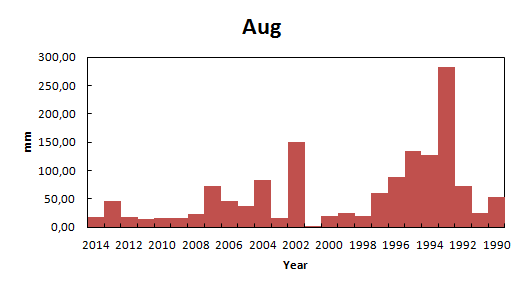
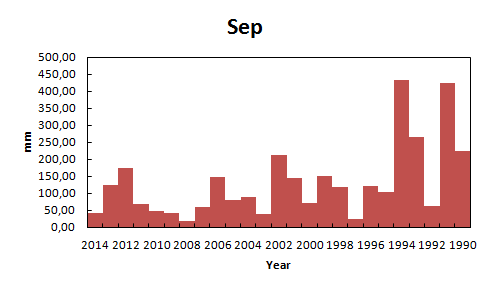
Figure 16 evidence the total rain in mm, for only month.
The study showed an average annual rainfall of 1050,10 mm, with an increase in the years: 1990 (the highest year period mm of rain fell), 1991, 1993, 1994, 1996, 2000, 2002, 2004, and 2013; while at the monthly level the average of 232,17 mm was exceeded in the months of April, September, October and November as shown in the graph at the beginning of this paragraph.
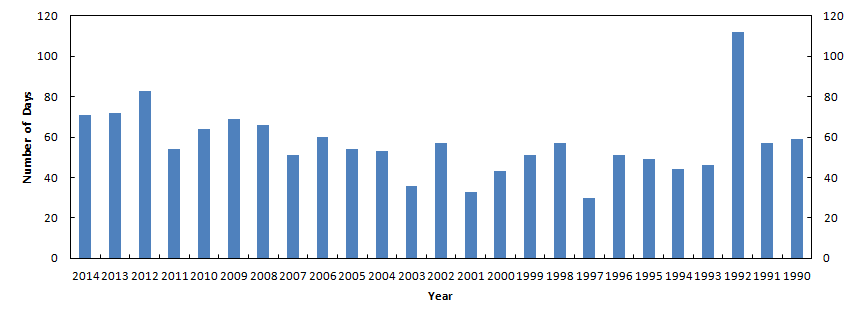
3.9 Fog’s days
In this section we describe number of Fog’s days obtained by an accurate analysis of the meteorological data.
The study showed a trend increase in the presence of days with fog and evidence that October is the first month for number of Fog’s day and July are the laster. Figure 7 we can see the number of Fog days by this study.
![[Uncaptioned image]](/html/1910.06101/assets/GiorniNebbiaperMese.png) Days Fog for Month from 1990 to 2014
Days Fog for Month from 1990 to 2014
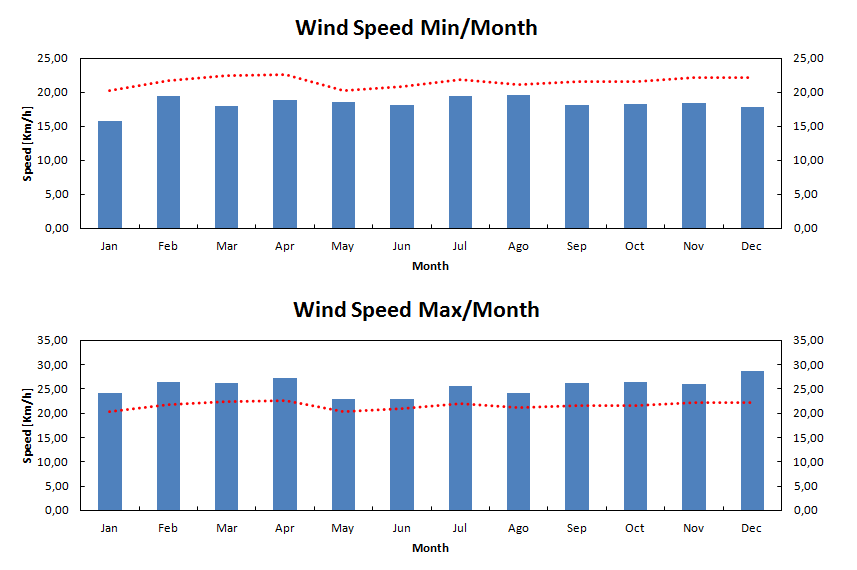
3.10 Wind speed
In this section we describe the wind speed.
In the above image you can see the map of wind speed insistent on the territory of Pieve a Nievole, as seen from the map generated from Atlas wind [6].
The study of daily wind speed has allowed to estimate on a monthly basis throughout the period included in this study:
-
•
a decrease below the average of the period 1990-2014 in the minimun values of wind speed, with values ranging between 16 Km/h (in January), and 19 Km/h in February;
-
•
an increase above the average maximum wind speed, betweenthe minimuof 22 km/h in May and 29 km/h in December.
The study of the period showed that the month of January recorded the greatest variation between the minimum and maximum wind speed, as clearly shownn in the graph of Figure 11.
![[Uncaptioned image]](/html/1910.06101/assets/Mappa_vento_Pieve.png)
Wind Speed Atlant of Pieve a Nievole - PT [6]
4 Geological and Earthquake data
In this section we describe the Geological and Earthquake data.
![[Uncaptioned image]](/html/1910.06101/assets/Fig1.png)
Fig.1: Distribution of the main neogenic and quaternary basins of the Northern Apennines. 1=main overlapping fronts; 2=main faults at the edges of the basins; 3=transverse tectonic lines; 4=minor faults at the edge of the basins (BOSSIO et all. 1992). [3]
The geological area of the present study belongs to the central zone of the orogenic chain of the Apennines northern and is an integral part of the perimediterranean deformation belt, developed in neogenic times and consisting of a complex structure of groundwater and thrust formed in relation to several tectonic phases.
The Apennines is a pitched chain characterized by the superposition of paleogeographic elements more interiors on more external elements; the tectonic story that led to his training has developed continuously and is still in progress, as demonstrated by the continuous seismicity.
In its evolution it is possible to distinguish some periods (tectonic phases) in which the intensity of the deformations is particularly high and such as to leave a trace so summarizable stratigraphic:
-
•
From the Cretaceous to the Middle Eocene (oceanic phase) the progressive closure of the paleo occurs Ligurian-Piedmontese Ocean. The main tectonic phase refers to the middle Eocene and is testified by the important one discrepancy between the Epiligure Succession and the previously deformed Liguridi underlying;
-
•
The deformative phases that followed Oligocene on, occurred in a framework very different geodynamic (continental phase) represented by a collisional regime e post-collisional in which they were progressively involved in the deformation le sequences of the Tuscan and Umbrian foreland with the overhanging deposits of the foredeep.
-
•
During the Oligo-Miocene collision the Ligurian Units override the Units Tuscan and Umbrian Marchigiane. The migration of the deformation front towards the outside has been accompanied by the translation of the Ligurian Units towards the northeast, generating the presence of holistostromes with prevailing Ligurian lands interspersed in flyschoid deposits. The displacement of the deformation front during the Miocene and the Pliocene subsequently involved more domains exteriors of the Apennine foreland (Umbrian domain - Marche and Padano) up to determine the current configuration of the north - Apennine chain;
-
•
From the upper Tortonian in the inner part of the Apennine chain developed gods basins (eg. Mugello basin, Florence-Prato-Pistoia basin, Valdarno basin), which interpreted as generated in relaxing regime. This scheme was explained by an evolutionary model of the chain that included the migration of the eastward compressive front with the consequent establishment of an extension regime in the more areas internal. Recent studies hypothesize reactivations in compression of thrusts, even crustals, during the late Miocene, Pliocene and Pleistocene (Boccaletti and Sani, 1998).
![[Uncaptioned image]](/html/1910.06101/assets/Fig2.png)
Fig. 2: Geological framework of the Northern Apennines (from Boccaletti et al. 1996) [3]
The main tectonic element of the Florence-Prato-Pistoia basin is represented by the system of faults along the line Prato - Fiesole, which consists of a sub-parallel beam of normal faults, arranged in steps and oriented around NW-SE with SW immersion. This system delimits the eastern margin of the basin and is formed by several sub-parallel faults arranged in tiers that in the study area they are completely buried below the lake and alluvial sediments.
The Florence-Prato-Pistoia basin has a fluvial-lacustrine nature attributable to the Pleistocene lower (the upper Pliocene is not excluded), following the formation of a semi-structure-graben regulated by the Fiesole fault system. The maximum depth of the basin is 600 m in the Prato area and gradually decreases towards E to reach the minimum depthin the area of Florence city, where about 50 m of sediments are found.
The current geological configuration of the territory in question represents the final phase of a complex process of transformation of vast geological environments that have over time suffered a slow and deep transformation. The area considered belongs to the geological and structural area of the northern Apennines, reflecting the salient features; there are two styles superimposed tectonics: a plicative-compressive one, related to the Apennine orogenesis, and a rigidistensive one related to the post-orogenic phase.
The first of the two deformation phases, which produced the Apennine pitch structure Northern, caused the wrinkling of the Tuscan Series and the overthrusting of the Liguridi;
the next originated a structure consisting of a series of raised blocks ("horst") and of depressed areas ("graben") arranged parallel to each other and delimited by systems of faults directed with Apennine orientation (NW-SE).
At the end of the Pliocene (Astiano), about 2 million years ago, a rapid regression leads to definitive establishment of a lake environment that includes the depressions of Fucecchio and Bientina communicating with each other: a large lake extends from the Apennine foothills to the ridge of the Montalbano lapping the Pisan Mountains, bordered to the south by the Pliocene hills of Cerreto Do you drive. This basin is affected by a deposition of fluoro-lacustrine villafranchian sediments a mostly fine grain size.
4.1 Geomorphology
The area under examination was analyzed from a geomorphological point of view by photointerpretation in stereoscopic vision and with verification on the ground of the acquired data, in order to discriminate e recognize the set of forms and phenomena that may be of practical interest in relation to them of the realization of the works in project. The elements derived from the photointerpretation result in good agreement with what was found directly on site, in any case the campaign checks and the the results of the geognostic investigations made it possible to complete the indications provided by the photointerpretation, defining a detailed geomorphological picture of the area, represented within the geomorphological cartography attached to the present project.
4.2 Description of the Formsand Processes
Geomorphological analysis identifies and recognizes the various physical forms produced by the agents morphogenetics such as gravity, surface water flow, chemical dissolution the action of wind, of the sea and the work of man. This type of survey allows to reconstruct the dynamic picture of land changes that occur slowly or quickly a depending on the prevalence of physical dynamics over those induced by human activities.
The legend used for cataloging and the description of the geomorphological phenomena was then constructed by differentiating the forms due to the various morphogenetic agents in the section examined:
-
•
Forms and processes due to gravity;
-
•
Forms and processes due to water flow;
-
•
Anthropic forms and processes.
Within these main categories, the activity of the detected forms is taken into account have been distinguished, when possible and significant, in active, quiescent and inactive forms; the first indicate phenomena that may constitute conditions of real risk such as to impose interventions of made safe, even if in a different degree, while inactive forms can constitute situations of potential danger that can eventually degenerate during events exceptional meteorological or improper soil transformation operations. Gravitational processes include landslide and soliflux phenomena, mapped forms are edges and landslide accumulations (quiescent), edges of degradation escarpments and morphological slopes with edge rounded.
The areas have been mapped as regards the forms linked to the flow of water with watercourses in depth, ditches in erosion, edges of river and torrent escarpment, hydrographic networks.
The anthropic processes and forms have been divided into: embankment and / or carry slope edges embankments (roads and railways) and embankments and artificial barriers artificial waterways.
4.3 Side shapes due to gravity
4.3.1 Landslide accumulation
These are accumulations of material generated by movements on the slope. In the investigated area were detected quiescent landslides with rototranslative movement. Quiescent forms are those with gravitational processes not in place, recent, and probably not yet completely stabilized.
4.3.2 Surface affected by soliflux or creep
Soliflux and creep are types of surface movement that can be correlated to plastic deformations of the soil, which can also occur on limited slopes. The slowness of this type of process and the lack of obvious cutting surfaces or detachment niches shapes the terrain into an inconspicuous manner and therefore also the area delimitation of the phenomenon sometimes becomes difficulty. For this reason the phenomenon is not usual, but it is highlighted through the use of a discrete symbology. Areas subject to flow should be treated with caution a due to the possible evolution of the phenomena, which can be equated with active landslides of blanket. In the section in question this type of instability is not directly interfering with the route motorway project.
4.3.3 Degradation slope
These are rough slopes that can be determined by various factors, including simple ones lithological variations or particular structural features of rock masses. This form is generally indicative of precarious equilibrium conditions, or of situations that could give place to instability in the event of incautious human interventions, seismic actions or changes in the erosive capacity of surface waters.
4.3.4 Morphological slope with rounded edge
These are modest variations of slope of a slope that determine the formation of a small step, generally with a very well rounded edge and therefore testify to one current situation of substantial geomorphological equilibrium; such forms may be useful for focus on the recent evolution of the landscape. River and slope forms due to water surface.
The evolutionary geology of the study are is highlighted below, as also indicated in the paper presenting the new research infrastructure as shown below. [1]
From a geological point of view, you can not look at the area of the Pieve a Nievole town, without inserting it into a wider contest that includes the whole surrounding flat area.
The area affected by the project is a flat area characterized by the presence of the large "palude of Fucecchio" whose drainage occurred in various historical epoche. This type of area is frequent in Tuscany, and is a phenomenon resulting from the genetic phenomenon due to the reduction of the comprehensive efforts that have originated in the Apennine chain. The beginning of the evolution of the area can be summarized as follows:
-
•
Middle-upper Pliocene (from 4 to 2 Million Years ago)
If Italy is on a larger scale conceived as already defined in the main orographic characteristics, the situation seen in the area covered by the present study is different, as this area consists of a slope with a slight slope crossed by rivers that descend from the north.
-
•
Lower Pleistocene (Villafranchiano Superiore from 2 to 0.7 million years ago)
This period is characterized by the progressive lifting of the area due to a progressive subsidence, linked to the phenomena of migration to the east of the comprehensive efforts responsible for the birth of the Apennines. The consequence of these events was the birth of a lake in which the paleo rivers brought sediments, while the ground due to the effect of subsidenze continued to lower until it touches 400 meters below sea level.
At the end of this period, probably due to a glacial event, the sea level was lowered, until it came to an offset of the coast, not unlike the current configuration.
In this period also the lakes present disappeared, and specifically in the area affected by the project, this phenomenon due to the lower subsidence compared to the sedimentary contribution, determined a reduction rather than a disappearance of the lake basin of Pescia-Empoli In this period, the residual "Fucecchio lake area" turned into a swamp.
-
•
Middle-upper Pleistocene (from 700,000 to 8,800 years ago)
In this period the area still affected by elevation, assumed the current configuration.
There were no substantial orographic changes except for a drift of the swamp that occupied the eastern side.
-
•
Holocene (from 8,800 years to current date)
In this perimeter the variations are almost all of an anthropic nature. In fact, during the "Leopoldino period" we can see the reclamation of the Fucecchio marsh which has reduced its extinction and regulated the waters.
4.4 Earthquake
The municiplay of Pieve a Nievole is characterized by a territory with low seismicity,
![[Uncaptioned image]](/html/1910.06101/assets/Mappa_pericolosita_sismica.png)
Seismic Hazard Map (MPS) of Tuscany. The acceleration values refer to a return of 475 years (INGV2004). The city of Pieve a Nievole is highlighted in black on the map. [14]
in fact in table A attached to the Decree of 01/14/2008 draw up by the Ministry of Infrastructures, the seismic hazard estimates are highlighted and from these the response spectrum was determined elastic (horizontal and vertical) of the seismic actions highlighted in the following graph.
![[Uncaptioned image]](/html/1910.06101/assets/Spettro_risposta.png)
Chart show the Ag, Fc, Tc values for the return period TR in years. Solid lines are the normative spectra, dashed line the spectra of S1-INGV project from which they are derived. [15]
In next figure we can see the number of Earthquake in Pieve a Nievole, and table evidence the number of Earthquake event by year.
![[Uncaptioned image]](/html/1910.06101/assets/Sismi.png)
Number of Earthquake for 1990 to 2014
Year
N. of Events
Year
N. of Events
2014
6
2013
2
2012
1
2011
4
2010
0
2009
1
2008
0
2007
0
2006
2
2005
1
2004
0
2003
0
2002
1
2001
0
2000
3
1999
0
1998
0
1997
0
1996
0
1995
0
1994
1
1993
2
1992
1
1991
0
1990
0
Number of Earthquake in Pieve a Nievole by Year
The study evidence that the major number of Earthquake are production on deep from 5 to 10 Km. Next graphics evidence this.
![[Uncaptioned image]](/html/1910.06101/assets/Rapporto_magnitude_Profondita.png)
Magnitudo/Deep for 1990 to 2014
5 Conclusion
We presented for the first time an analysis of geological and longterm temperature data directly obtained from Pieve a Nievole local meteorological site, inside urban concentration and well above the inversion layer.
The data analysis above all those related to annual rainfall, to their regimen and the change of these indices over time indicates that the area is recorded increase the contribution of rainfall and its concentration in the most rainy periods.
The extremes of this trend over time if confirmed, would lead to a radical change in climate of the area that would no longer be characterized by the absence of the dry season, but rather by a rainy season with heavy and often heavy rainfall and a dry season with characteristics similar to those of the dry seasons of the Mediterranean climate.
The inversion of Pieve a Nievole arouses contrasting effects among citizens, as it is a phenomenon particularly popular in the middle of a hot summer when at least in the early morning you are able to get much lower temperatures and refreshing, while in winter it is seen as a phenomenon inconvenient dates the low temperatures and possible fog and frost that usually occur in parallel.
Given the geology structure of the rocks and the territory, and highlighted the amount of railfallin the period presented in this study (highlighted in section 3.7 and in Table 3), it is recommended further attention in the monitorng of climatic phenomena, in order to prepare the necessary and appropriate measure to protect the population and existing infrastructure.
6 Acknowledgments
We would like to thank Dr.ssa Filomena Barra for her helpful suggestions and support to made the paper more complete. The constructive comments are highly appreciated.
| Year | Jan | Feb | Mar | Apr | May | Jun | ||||||
| Min | Max | Min | Max | Min | Max | Min | Max | Min | Max | Min | Max | |
| 2014 | -1 | 15 | 2 | 17 | 3 | 21 | 3 | 22 | 7 | 26 | 10 | 34 |
| 2013 | -2 | 15 | -3 | 15 | 0 | 16 | 6 | 25 | 7 | 24 | 11 | 32 |
| 2012 | -4 | 14 | -7 | 17 | 1 | 24 | 4 | 27 | 5 | 26 | 10 | 33 |
| 2011 | -3 | 15 | -1 | 15 | -2 | 18 | 4 | 23 | 7 | 30 | 14 | 30 |
| 2010 | -3 | 13 | -4 | 16 | 0 | 18 | 3 | 24 | 9 | 26 | 13 | 32 |
| 2009 | -4 | 15 | -3 | 16 | -2 | 18 | 7 | 22 | 8 | 30 | 13 | 31 |
| 2008 | -1,9 | 16 | -5 | 17,6 | -0,2 | 20 | 2 | 22,4 | 6 | 32 | 13 | 33 |
| 2007 | -1 | 19 | -2,7 | 16,5 | -1 | 19,5 | 4 | 26 | 9 | 31,6 | 12,6 | 34,4 |
| 2006 | -5,5 | 18 | -4 | 18 | -3 | 18 | 2 | 25 | 6,5 | 28 | 8 | 34 |
| 2005 | -5 | 15 | -5 | 14 | -6 | 19,5 | 2 | 25 | 7,6 | 28,5 | 7 | 33 |
| 2004 | -4 | 20 | 0,8 | 15,4 | -3,4 | 20,2 | 3 | 21 | 5,8 | 24,5 | 12 | 30 |
| 2003 | -4 | 16,4 | -4,2 | 15 | 0,4 | 20,4 | -5 | 23,4 | 8 | 31 | 14,6 | 34,6 |
| 2002 | -6 | 17,4 | -1 | 16,8 | 1 | 21,6 | 0,8 | 24 | 5,60 | 26,8 | 11,40 | 37,6 |
| 2001 | -2 | 17 | -3 | 17,8 | 1,8 | 22 | -2 | 23,4 | 9,6 | 28 | 8 | 33 |
| 2000 | -6 | 14,3 | -2,2 | 18,2 | -2,6 | 19,8 | 2 | 25 | 9,6 | 28,6 | 12 | 31,4 |
| 1999 | -4,2 | 14,8 | -6 | 15 | -2 | 22,2 | 4 | 23 | 8 | 29 | 10 | 29,4 |
| 1998 | -4 | 16 | -4 | 18,4 | -2 | 20 | 4,6 | 24 | 6,8 | 29 | 10,8 | 33 |
| 1997 | -6,8 | 16 | -2,2 | 19 | -1 | 21 | -1,6 | 21,4 | 7 | 29 | 10,1 | 31 |
| 1996 | -4 | 16 | -3,8 | 15 | -2,6 | 18 | 3,8 | 23 | 7 | 25,6 | 10 | 30 |
| 1995 | -5 | 16,6 | -3,2 | 15,4 | -1,2 | 17 | -0,6 | 22 | 7 | 25 | 8 | 31,4 |
| 1994 | -2,2 | 20 | -3,6 | 16,8 | 1 | 20 | 0,6 | 25 | 6,80 | 29 | 8,70 | 31,2 |
| 1993 | -7 | 15,4 | -8 | 17,6 | -4 | 18,8 | 3,8 | 25,6 | 7,5 | 28,6 | 12,6 | 31 |
| 1992 | -4,2 | 17,6 | -4 | 19 | -1,4 | 21,4 | 4,4 | 25,6 | 6,8 | 29,6 | 11,8 | 31 |
| 1991 | -6 | 17 | -5 | 19,4 | 1 | 23,6 | 2,2 | 24 | 4 | 28 | 9 | 31 |
| 1990 | -5 | 16,6 | -2,2 | 21 | -3 | 23,2 | 2,6 | 24,2 | 6 | 27,2 | 8,2 | 35 |
| Year | Jul | Aug | Sep | Oct | Nov | Dec | ||||||
| Min | Max | Min | Max | Min | Max | Min | Max | Min | Max | Min | Max | |
| 2014 | 14 | 32 | 13 | 30 | 10 | 28 | 5 | 26 | 6 | 21 | -4 | 18 |
| 2013 | 13 | 35 | 15 | 34 | 12 | 32 | 9 | 25 | -2 | 22 | -2 | 15 |
| 2012 | 15 | 35 | 14 | 36 | 11 | 31 | 5 | 26 | 5 | 19 | -3 | 17 |
| 2011 | 15 | 34 | 15 | 38 | 11 | 32 | 5 | 28 | -1 | 21 | -2 | 19 |
| 2010 | 15 | 34 | 12 | 32 | 9 | 29 | 3 | 25 | 1 | 20 | -4 | 17 |
| 2009 | 14 | 35 | 17 | 37 | 13 | 31 | 2 | 27 | 2 | 20 | -6 | 16 |
| 2008 | 13 | 32 | 15 | 32 | 7 | 33 | 7 | 26 | 0 | 20 | 0 | 16 |
| 2007 | 12 | 34 | 13 | 34,6 | 9 | 29 | 1,8 | 27,4 | -1,4 | 21 | -4 | 16 |
| 2006 | 16 | 35 | 13 | 32 | 12 | 31,5 | 6,5 | 26 | -1 | 19 | -3 | 18 |
| 2005 | 15 | 39 | 11 | 33,5 | 11 | 34 | 6,5 | 24,5 | 7 | 21,5 | -5 | 16 |
| 2004 | 12 | 33 | 15 | 33 | 9 | 34 | 11 | 25 | -1 | 24 | -3 | 17,5 |
| 2003 | 16 | 34,6 | 16,2 | 38,2 | 10 | 32 | 2,8 | 27 | 3,8 | 20,2 | -4,4 | 18,2 |
| 2002 | 14 | 33 | 14 | 31,8 | 6 | 29,2 | 7,6 | 25,2 | 2,8 | 22 | 0,2 | 16 |
| 2001 | 14,8 | 36 | 15 | 36,4 | 8 | 27 | 9 | 27 | -3 | 20 | -5 | 16 |
| 2000 | 10,6 | 34 | 14,4 | 36 | 11,6 | 30 | 7,8 | 26,8 | 2 | 20,2 | -1,8 | 18,4 |
| 1999 | 14,6 | 35 | 15,6 | 35 | 13 | 32 | 5,6 | 26,4 | -6,8 | 23 | -5 | 16 |
| 1998 | 11 | 35 | 12 | 35 | 9 | 31 | 6 | 22 | -3,2 | 23 | -5 | 15 |
| 1997 | 13 | 34 | 14 | 35 | 9 | 32 | 2 | 28 | 2 | 20 | -4 | 16 |
| 1996 | 11 | 33 | 14 | 32 | 8 | 26 | 4,8 | 23,4 | 1 | 21 | -6 | 15,4 |
| 1995 | 14 | 36 | 10,2 | 32 | 6 | 28 | 3 | 26,2 | -2,6 | 20 | -6 | 17,6 |
| 1994 | 15,4 | 34,1 | 16,8 | 35 | 8 | 30,2 | 3 | 26,3 | 4 | 22,2 | -2,4 | 18 |
| 1993 | 11 | 35,2 | 13 | 36 | 9,6 | 31,7 | 6 | 24,4 | 0,4 | 20 | -3,7 | 17 |
| 1992 | 13,2 | 35 | 16,6 | 36,8 | 9 | 31 | 6,7 | 23,6 | -0,8 | 21,2 | -2 | 17 |
| 1991 | 13 | 35 | 12 | 34 | 14 | 31,6 | 2,8 | 26,2 | 2,8 | 20 | -5,2 | 13,6 |
| 1990 | 14 | 34 | 14 | 36 | 9 | 29 | 9 | 30,2 | -2,6 | 20 | -3 | 14 |
| Year | Jan | Feb | Mar | Apr | May | Jun | Jul | Aug | Sep | Oct | Nov | Dec |
| 2014 | 7 | 6 | 10 | 8 | 10 | 11 | 8 | 9 | 10 | 9 | 6 | 7 |
| 2013 | 7 | 8 | 7 | 9 | 8 | 11 | 11 | 12 | 9 | 7 | 8 | 9 |
| 2012 | 10 | 9 | 13 | 9 | 11 | 11 | 12 | 12 | 11 | 9 | 8 | 7 |
| 2011 | 7 | 8 | 9 | 10 | 12 | 9 | 10 | 12 | 11 | 10 | 11 | 9 |
| 2010 | 7 | 8 | 8 | 9 | 10 | 10 | 11 | 9 | 10 | 8 | 6 | 6 |
| 2009 | 8 | 9 | 9 | 8 | 12 | 10 | 12 | 12 | 11 | 10 | 9 | 7 |
| 2008 | 8 | 10 | 9 | 11 | 11 | 11 | 11 | 11 | 11 | 9 | 7 | 7 |
| 2007 | 8 | 9 | 9 | 13 | 11 | 10 | 13 | 11 | 12 | 11 | 10 | 10 |
| 2006 | 10 | 10 | 10 | 12 | 12 | 14 | 13 | 11 | 10 | 11 | 9 | 9 |
| 2005 | 9 | 9 | 9 | 10 | 11 | 12 | 12 | 12 | 10 | 9 | 9 | 8 |
| 2004 | 8 | 7 | 9 | 9 | 10 | 10 | 12 | 10 | 12 | 7 | 9 | 7 |
| 2003 | 8 | 12 | 12 | 11 | 13 | 12 | 11 | 11 | 11 | 9 | 7 | 8 |
| 2002 | 11 | 9 | 12 | 10 | 10 | 12 | 11 | 10 | 9 | 9 | 6 | 6 |
| 2001 | 7 | 10 | 7 | 11 | 11 | 13 | 11 | 12 | 11 | 10 | 8 | 8 |
| 2000 | 9 | 12 | 10 | 9 | 11 | 13 | 12 | 13 | 12 | 9 | 6 | 7 |
| 1999 | 9 | 11 | 11 | 10 | 11 | 12 | 13 | 11 | 12 | 9 | 10 | 8 |
| 1998 | 8 | 12 | 11 | 9 | 12 | 12 | 13 | 11 | 10 | 9 | 8 | 7 |
| 1997 | 9 | 9 | 12 | 11 | 12 | 10 | 12 | 11 | 12 | 9 | 7 | 8 |
| 1996 | 7 | 9 | 10 | 10 | 10 | 12 | 12 | 12 | 10 | 10 | 7 | 8 |
| 1995 | 10 | 9 | 9 | 10 | 9 | 11 | 12 | 11 | 10 | 12 | 9 | 8 |
| 1994 | 9 | 9 | 11 | 10 | 10 | 11 | 13 | 11 | 9 | 10 | 8 | 7 |
| 1993 | 6 | 6 | 8 | 13 | 17 | 21 | 22 | 24 | 20 | 16 | 10 | 9 |
| 1992 | 10 | 11 | 11 | 10 | 13 | 10 | 12 | 12 | 11 | 7 | 8 | 8 |
| 1991 | 11 | 9 | 11 | 12 | 11 | 12 | 13 | 12 | 11 | 9 | 7 | 12 |
| 1990 | 13 | 11 | 12 | 11 | 12 | 12 | 12 | 13 | 11 | 9 | 10 | 9 |
| Average 1990-2014 | 8,49 | 9,36 | 9,98 | 10,15 | 11,27 | 11,55 | 12,15 | 11,78 | 11,07 | 9,38 | 8,13 | 7,90 |
| Year | Jan | Feb | Mar | Apr | May | Jun | Jul | Ago | Sep | Oct | Nov | Dec | Tot | %Year | |
| 2014 | 62 | 45,50 | 183,10 | 21,10 | 26,60 | 6,20 | 20,40 | 177,40 | 18,00 | 43,50 | 205,10 | 74,70 | 15,20 | 836,80 | 3,19% |
| 2013 | 152 | 119,70 | 181,30 | 575,50 | 172,30 | 61,80 | 7,00 | 53,50 | 46,90 | 124,80 | 76,10 | 260,10 | 34,80 | 1713,80 | 6,53% |
| 2012 | 39 | 9,30 | 36,10 | 14,80 | 127,40 | 61,60 | 27,30 | 17,20 | 19,00 | 173,60 | 83,80 | 239,70 | 119,00 | 928,80 | 3,54% |
| 2011 | 52 | 32,70 | 57,00 | 75,80 | 76,70 | 48,50 | 97,30 | 14,50 | 14,10 | 68,00 | 95,20 | 53,60 | 171,70 | 805,10 | 3,07% |
| 2010 | 59 | 51,30 | 73,00 | 51,90 | 41,60 | 155,30 | 65,80 | 13,80 | 15,80 | 48,00 | 24,60 | 228,90 | 143,30 | 913,30 | 3,48% |
| 2009 | 57 | 74,10 | 81,40 | 113,60 | 66,10 | 22,00 | 79,50 | 1,00 | 15,80 | 42,70 | 51,40 | 51,60 | 19,00 | 618,20 | 2,35% |
| 2008 | 67 | 150,00 | 31,60 | 96,50 | 62,90 | 118,60 | 13,40 | 1,00 | 24,00 | 17,80 | 185,40 | 56,60 | 3,00 | 760,80 | 2,90% |
| 2007 | 68 | 45,30 | 50,70 | 76,90 | 134,50 | 62,80 | 4,00 | 6,60 | 73,70 | 60,50 | 103,40 | 113,90 | 18,30 | 750,60 | 2,86% |
| 2006 | 80 | 84,40 | 99,90 | 38,60 | 72,20 | 55,60 | 57,30 | 73,00 | 45,90 | 148,90 | 116,60 | 160,30 | 3,00 | 955,70 | 3,64% |
| 2005 | 48 | 36,80 | 79,40 | 40,70 | 53,30 | 54,10 | 36,90 | 13,30 | 38,10 | 78,90 | 81,90 | 13,20 | 51,20 | 577,80 | 2,20% |
| 2004 | 97 | 151,60 | 118,50 | 106,00 | 157,60 | 96,20 | 28,20 | 36,50 | 83,70 | 88,30 | 106,00 | 138,60 | 53,10 | 1164,30 | 4,44% |
| 2003 | 77 | 98,80 | 28,00 | 30,90 | 70,30 | 36,30 | 36,80 | 24,40 | 16,90 | 40,00 | 297,60 | 167,80 | 72,80 | 920,60 | 3,51% |
| 2002 | 101 | 38,70 | 69,80 | 6,20 | 69,30 | 64,28 | 64,90 | 70,00 | 151,20 | 212,70 | 136,60 | 150,70 | 178,90 | 1213,28 | 4,62% |
| 2001 | 64 | 77,20 | 29,40 | 108,70 | 65,50 | 39,70 | 18,90 | 29,70 | 3,00 | 143,90 | 78,70 | 112,00 | 62,00 | 768,70 | 2,93% |
| 2000 | 100 | 70,30 | 10,40 | 106,70 | 102,30 | 24,80 | 38,30 | 41,50 | 20,60 | 71,40 | 159,10 | 443,70 | 105,60 | 1194,70 | 4,55% |
| 1999 | 75 | 52,10 | 41,20 | 49,60 | 68,90 | 22,40 | 71,40 | 11,00 | 25,70 | 149,30 | 153,70 | 137,50 | 114,10 | 896,90 | 3,42% |
| 1998 | 67 | 60,60 | 109,40 | 50,70 | 82,80 | 52,70 | 49,50 | 23,50 | 20,70 | 118,10 | 125,70 | 56,10 | 54,90 | 804,70 | 3,07% |
| 1997 | 76 | 120,20 | 189,10 | 29,60 | 80,60 | 45,60 | 94,30 | 21,10 | 60,40 | 23,30 | 40,60 | 95,80 | 114,30 | 914,90 | 3,49% |
| 1996 | 102 | 121,30 | 75,50 | 28,90 | 78,40 | 70,00 | 32,90 | 10,90 | 89,10 | 120,20 | 206,00 | 271,50 | 116,20 | 1220,90 | 4,65% |
| 1995 | 89 | 56,60 | 129,00 | 87,90 | 65,10 | 130,80 | 53,20 | 8,70 | 134,70 | 103,30 | 94,40 | 66,30 | 132,70 | 1062,70 | 4,05% |
| 1994 | 126 | 163,50 | 10,30 | 266,20 | 126,10 | 39,00 | 82,00 | 6,00 | 127,50 | 432,70 | 89,00 | 81,50 | 86,50 | 1510,30 | 5,75% |
| 1993 | 102 | 3,00 | 2,00 | 39,70 | 85,50 | 16,70 | 5,50 | 2,50 | 282,60 | 266,50 | 229,30 | 226,00 | 61,40 | 1220,70 | 4,65% |
| 1992 | 84 | 21,20 | 8,20 | 17,10 | 84,80 | 157,60 | 101,90 | 26,60 | 72,60 | 62,20 | 295,40 | 86,10 | 73,80 | 1007,50 | 3,84% |
| 1991 | 137 | 22,10 | 55,70 | 92,60 | 66,40 | 176,30 | 109,60 | 166,10 | 25,00 | 425,00 | 249,80 | 247,60 | 10,40 | 1646,60 | 6,27% |
| 1990 | 154 | 45,90 | 71,90 | 39,40 | 245,20 | 25,20 | 46,50 | 28,40 | 54,20 | 223,10 | 637,00 | 228,20 | 199,80 | 1844,80 | 7,03% |
| Average 1990-2014 | 85,31 | 70,09 | 72,88 | 86,62 | 91,30 | 65,76 | 49,71 | 35,13 | 59,17 | 131,47 | 156,90 | 150,48 | 80,60 | 26252,48 | |
| Year Average | 1050,099 |
| Day | Jan | Feb | Mar | Apr | May | Jun | Jul | Ago | Sep | Oct | Nov | Dec | Average | Min | Max |
|---|---|---|---|---|---|---|---|---|---|---|---|---|---|---|---|
| 1 | 21,08 | 21,63 | 26,08 | 23,60 | 18,92 | 19,21 | 22,64 | 21,64 | 22,54 | 18,25 | 25,88 | 22,32 | 21,98 | 18,25 | 26,08 |
| 2 | 20,44 | 20,00 | 22,75 | 23,80 | 19,12 | 18,87 | 23,92 | 20,04 | 22,25 | 22,25 | 25,52 | 21,96 | 21,74 | 18,87 | 25,52 |
| 3 | 18,64 | 19,58 | 22,33 | 21,75 | 22,24 | 20,25 | 23,32 | 20,32 | 21,00 | 26,33 | 19,12 | 23,28 | 21,51 | 18,64 | 26,33 |
| 4 | 22,29 | 21,33 | 23,83 | 22,25 | 22,40 | 22,96 | 22,20 | 19,84 | 25,04 | 19,96 | 22,72 | 22,21 | 22,25 | 19,84 | 25,04 |
| 5 | 21,58 | 21,25 | 24,63 | 21,83 | 20,17 | 21,54 | 23,76 | 21,44 | 22,20 | 21,13 | 24,16 | 23,24 | 22,24 | 20,17 | 24,63 |
| 6 | 21,35 | 20,83 | 22,33 | 24,25 | 20,21 | 22,00 | 20,68 | 21,60 | 19,56 | 18,83 | 24,64 | 20,42 | 21,39 | 18,83 | 24,64 |
| 7 | 18,96 | 20,21 | 22,92 | 27,30 | 20,92 | 21,21 | 22,56 | 20,44 | 19,96 | 20,79 | 23,88 | 18,67 | 21,48 | 18,67 | 27,30 |
| 8 | 18,75 | 23,00 | 24,00 | 20,92 | 19,63 | 21,00 | 25,48 | 20,76 | 21,44 | 20,08 | 22,80 | 21,04 | 21,58 | 18,75 | 25,48 |
| 9 | 17,04 | 24,71 | 24,56 | 23,08 | 21,08 | 20,33 | 21,48 | 20,68 | 22,64 | 20,21 | 19,76 | 26,04 | 21,80 | 17,04 | 26,04 |
| 10 | 15,83 | 20,50 | 22,04 | 22,64 | 18,50 | 21,71 | 23,36 | 21,36 | 21,60 | 21,04 | 20,16 | 23,96 | 21,06 | 15,83 | 23,96 |
| 11 | 19,17 | 21,63 | 19,60 | 25,58 | 18,50 | 21,79 | 24,16 | 23,48 | 20,80 | 19,50 | 23,96 | 20,52 | 21,56 | 18,50 | 25,58 |
| 12 | 20,17 | 19,79 | 21,00 | 25,25 | 19,96 | 21,52 | 21,84 | 22,76 | 23,52 | 22,60 | 23,08 | 17,76 | 21,60 | 17,76 | 25,25 |
| 13 | 20,46 | 24,83 | 21,08 | 23,29 | 22,08 | 20,52 | 21,12 | 20,60 | 26,16 | 21,56 | 21,75 | 17,76 | 21,77 | 17,76 | 26,16 |
| 14 | 19,63 | 19,50 | 18,00 | 23,96 | 21,08 | 20,72 | 22,20 | 21,04 | 26,12 | 20,32 | 21,83 | 19,52 | 21,16 | 18,00 | 26,12 |
| 15 | 22,96 | 20,44 | 18,56 | 22,42 | 19,17 | 21,20 | 22,20 | 19,92 | 23,52 | 21,68 | 20,83 | 28,60 | 21,79 | 18,56 | 28,60 |
| 16 | 19,54 | 24,75 | 24,28 | 24,67 | 20,83 | 20,24 | 20,76 | 20,12 | 19,32 | 21,08 | 23,75 | 27,68 | 22,25 | 19,32 | 27,68 |
| 17 | 18,21 | 21,79 | 22,04 | 23,58 | 18,54 | 20,92 | 20,40 | 21,24 | 18,16 | 24,08 | 24,29 | 25,52 | 21,56 | 18,16 | 25,52 |
| 18 | 17,71 | 21,54 | 21,88 | 23,48 | 20,29 | 20,78 | 21,96 | 19,52 | 19,00 | 25,08 | 23,92 | 20,44 | 21,30 | 17,71 | 25,08 |
| 19 | 20,38 | 20,79 | 21,56 | 23,20 | 22,96 | 21,13 | 21,28 | 20,16 | 18,72 | 23,64 | 24,79 | 18,64 | 21,44 | 18,64 | 24,79 |
| 20 | 18,96 | 20,83 | 23,56 | 22,83 | 22,21 | 22,64 | 21,56 | 21,00 | 20,64 | 20,36 | 23,42 | 21,60 | 21,63 | 18,96 | 23,56 |
| 21 | 17,71 | 20,88 | 22,52 | 23,38 | 22,54 | 20,35 | 19,48 | 21,04 | 20,40 | 22,16 | 24,33 | 22,21 | 21,42 | 17,71 | 24,33 |
| 22 | 22,63 | 22,33 | 22,24 | 19,96 | 20,38 | 21,67 | 20,40 | 20,16 | 20,08 | 20,28 | 23,21 | 21,59 | 21,24 | 19,96 | 23,21 |
| 23 | 21,96 | 21,96 | 20,28 | 21,92 | 20,17 | 19,75 | 20,96 | 19,64 | 22,68 | 21,88 | 22,67 | 23,04 | 21,41 | 19,64 | 23,04 |
| 24 | 20,17 | 21,25 | 23,96 | 20,72 | 19,70 | 18,17 | 22,20 | 19,88 | 22,33 | 20,04 | 21,04 | 23,70 | 21,10 | 18,17 | 23,96 |
| 25 | 21,33 | 20,17 | 22,46 | 21,24 | 19,92 | 18,71 | 20,68 | 22,88 | 23,32 | 20,16 | 18,38 | 23,22 | 21,04 | 18,38 | 23,32 |
| 26 | 24,13 | 22,92 | 22,64 | 18,84 | 19,26 | 20,21 | 21,08 | 20,56 | 23,64 | 21,72 | 19,25 | 25,00 | 21,60 | 18,84 | 25,00 |
| 27 | 22,00 | 23,87 | 25,20 | 20,84 | 20,91 | 20,61 | 21,28 | 20,88 | 21,52 | 22,08 | 18,58 | 24,57 | 21,86 | 18,58 | 25,20 |
| 28 | 20,50 | 22,71 | 22,32 | 19,76 | 19,87 | 22,71 | 20,24 | 23,13 | 20,38 | 21,40 | 19,04 | 23,74 | 21,32 | 19,04 | 23,74 |
| 29 | 20,88 | 26,29 | 24,16 | 20,04 | 19,48 | 21,88 | 22,36 | 22,88 | 19,54 | 23,00 | 18,88 | 19,48 | 21,57 | 18,88 | 26,29 |
| 30 | 21,83 | 20,84 | 21,36 | 19,41 | 21,46 | 21,75 | 23,76 | 18,50 | 24,40 | 20,00 | 21,13 | 21,31 | 18,50 | 24,40 | |
| 31 | 22,88 | 22,44 | 19,30 | 22,13 | 24,20 | 21,60 | 19,70 | 21,75 | 19,30 | 24,20 | |||||
| Average | 20,29 | 21,77 | 22,45 | 22,59 | 20,31 | 20,87 | 21,92 | 21,19 | 21,55 | 21,53 | 22,19 | 22,21 | Average | 15,83 | 28,60 |
| Min | 15,83 | 19,50 | 18,00 | 18,84 | 18,50 | 18,17 | 19,48 | 19,52 | 18,16 | 18,25 | 18,38 | 17,76 | 21,04 | ||
| Max | 24,13 | 26,29 | 26,08 | 27,30 | 22,96 | 22,96 | 25,48 | 24,20 | 26,16 | 26,33 | 25,88 | 28,60 | 22,25 | ||
| Year | Jan | Feb | Mar | Jun | Jul | Aug |
|---|---|---|---|---|---|---|
| 2014 | 9,03 | 10,88 | 11,27 | 21,45 | 21,56 | 21,92 |
| 2013 | 6,85 | 5,45 | 9,40 | 19,27 | 23,42 | 24,37 |
| 2012 | 6,11 | 1,55 | 11,00 | 21,50 | 24,03 | 25,31 |
| 2011 | 7,08 | 7,54 | 9,56 | 21,60 | 22,98 | 24,34 |
| 2010 | 5,13 | 7,55 | 9,50 | 20,40 | 25,04 | 23,00 |
| 2009 | 6,98 | 6,55 | 9,85 | 21,10 | 23,85 | 25,60 |
| 2008 | 8,45 | 8,19 | 9,95 | 21,05 | 23,58 | 24,05 |
| 2007 | 9,08 | 9,28 | 10,42 | 21,17 | 22,60 | 22,52 |
| 2006 | 5,14 | 7,08 | 8,96 | 20,80 | 26,24 | 22,50 |
| 2005 | 5,69 | 4,67 | 8,89 | 21,90 | 24,27 | 23,68 |
| 2004 | 6,11 | 8,74 | 9,42 | 20,51 | 22,74 | 24,42 |
| 2003 | 6,51 | 4,91 | 10,07 | 25,61 | 26,58 | 27,75 |
| 2002 | 5,70 | 7,90 | 11,30 | 18,80 | 23,50 | 22,90 |
| 2001 | 8,65 | 8,54 | 13,10 | 20,46 | 23,95 | 25,58 |
| 2000 | 5,76 | 7,92 | 10,45 | 22,12 | 22,12 | 24,23 |
| 1999 | 5,82 | 5,50 | 10,40 | 20,04 | 23,90 | 25,00 |
| 1998 | 7,53 | 7,92 | 9,20 | 20,79 | 23,63 | 24,89 |
| 1997 | 8,09 | 9,30 | 10,89 | 20,91 | 22,60 | 24,25 |
| 1996 | 8,61 | 6,61 | 9,43 | 21,09 | 22,49 | 22,54 |
| 1995 | 6,30 | 8,69 | 9,35 | 18,45 | 24,63 | 22,85 |
| 1994 | 8,26 | 7,35 | 11,81 | 19,34 | 24,90 | 25,51 |
| 1993 | 6,51 | 6,09 | 8,09 | 21,21 | 21,81 | 24,81 |
| 1992 | 7,56 | 7,73 | 10,70 | 20,13 | 23,31 | 25,00 |
| 1991 | 6,97 | 6,45 | 12,98 | 19,35 | 24,47 | 24,69 |
| 1990 | 6,89 | 10,74 | 10,76 | 20,55 | 23,31 | 24,05 |
| Average 1990-2014 | 6,99 | 7,33 | 10,27 | 20,78 | 23,66 | 24,23 |
References
- [1] Tasselli, D. Ricci, S., Bianchi P., "PAN.R.C. - A New Level 3 Biosafety and Astrobiology Laboratory in Pieve a Nievole (PT)", arXiv:1811.05201v1 [astro-ph.IM], 2018.
- [2] Ente per le Nuove Tecnologie, l’Energia e l’Ambiente, “Tabella dei gradi/giorno dei Comuni italiani raggruppati per Regione e Provincia, Legge 26 agosto 1993, n. 412, allegato A”, 1 marzo 2011, p. 151.
- [3] Prof. L. Carmignani, Prof. G. Cornamusini, Dott. I. Callegari, “Mappa Geologica di Pieve a Nievole (PT)”, Università di Siena, Dipartimento di Scienze della Terra - Centro di GeoTecnologie, Foglio 262.
- [4] IlMeteo.it “Archivio Dati Meteo Pieve a Nievole (PT)”, IlMeteo.it.
- [5] Eumetsat “Archivio Dati Meteo Pieve a Nievole (PT)”, Eumetsat.
- [6] Atlantedelvento “Archivio Dati Atlante Eolico”, http://www.atlanteeolico.it.
- [7] Autorità di Bacino Fiume Arno “Complessi Idrogeologici Bacino del Fiume Arno”, Autorità di Bacino Fiume Arno.
- [8] Della Vedova et al. “Geothermal structure of Tyrrhenian Sea. Mar. Geol. 55, 271–289”, 1994
- [9] Arisi Rota et Fichera “Magnetic interpretation connected to Geomagnetic provinces: the Italian case history. 47th Meeting European Association of Exploration Geophysicists Proc.”, 1985
- [10] Buonasorte et al. “Tectonic structures and geometric setting of the Vulsini Volcanic Complex. Per. Mineral., 56: 123-136”, 1987a
- [11] F. Barberi, Buonasorte G., R. Cioni, Fiordelisi A., Foresi L., S. Iaccarino, Laurenzi MA , Sbrana A., L. Vernia, Villa IM “Plio-Plesitocene geological evolution of the geothermal area of Tuscany and Latium. Mem. Descr. Carta Geol. D’It. XLIX (1994), pp 77-134”
- [12] Iaccarino et al. “Osservazioni stratigrafiche sul bordo orientale del Bacino di Radicofani. Mem. Descr. Carta Geol. D’It. XLIX”, 1994
- [13] European Commission “Map of Solar Irradiation”, 2012
- [14] INGV “Seismic Hazard Map (MPS) of Tuscany”, 2004
- [15] INGV “S1-INGV Project (http://esse1.mi.ingv.it/ntc.html)”, 2008
- [16] Boccaletti, M. & calamita, F. et all, "Evoluzione dell’Appennino Tosco-Umbro-Marchigiano durante il Neogene", Giornale di Geologia, Sez.3, vol.48/1-2, 1986
- [17] Capecchi, F. & Pranzini, G., "Studi geologici e idrogeologici della pianura di Pistoia", Boll.Soc.Geol. It. 94, 1975
- [18] De Stefani C., "I dintorni di Monsummano e Montecatini in Val di Nievole", Boll. Soc. Geol. It. 42-52, 1887
- [19] Frazzuoli, M. & Maestrelli-Manetti O. , "I nuclei Mesozoici di Monsummano, Montecatini Terme e Marliana (provincia di Pistoia)", 1973
- [20] Ghelardoni, R., "Spostamento dallo spartiacque dell’Appennino Settentrionale in corrispondenza di catture idrografiche", Atti Soc. Sc. Nat., Mem. Ser. A, 65, 1958
- [21] Arrighi, A. & Bertogna, A. & Naef, S., "Montalbano: geologia, flora, fauna, storia e arte", Cnsorzio Interprovinciale per il Montalbano, 1993
- [22] Horizon 2020 - Work Programme 2018-2020, European research infrastructures (including e-Infrastructures), 2016.