Formation of N-rich field stars in the high-density building blocks of the Galactic bulge
Abstract
Recent observational studies of the Galactic bulge by APOGEE have revealed that about 1% of the bulge stars have rather high nitrogen abundances ([N/Fe]). We here numerically investigate in what physical conditions these N-rich stars (NRS) can be formed in spherical and disky stellar systems with stellar masses of that are the bulge’s building blocks. The principal results are as follows. A large fraction () of new stars formed from interstellar medium polluted (ISM) by ejecta of asymptotic giant branch stars can have [N/Fe] within stellar systems, if the gas mass fraction of ISM () is low (). The mass fraction of NRS among all stars () can be higher than % within 0.5 Gyr timescale of star formation, if the mean stellar densities () of the systems are higher than pc-3. The [N/Fe] distributions depend on , , and age distributions of their host stellar systems. NRS have compact and disky spatial distributions within their host systems and have rotational kinematics. Based on these results, we propose that the vast majority of the bulge’s NRS originate not from globular clusters (GCs) but from its high-density building blocks. We suggest that NRS in the Galactic stellar halo have the same origin as those in the bulge. We also suggest that low-density dwarf spheroidal and gas-rich dwarfs are unlikely to form NRS. GCs are not only the formation sites of NRS.
keywords:
galaxies:ISM – galaxies:evolution – stars:formation1 Introduction
Recent observational studies of chemical abundances of the Galactic bulge stars by APOGEE have discovered field stars with rather high nitrogen abundances with [N/Fe] (Schiavon et al. 2017, S17). Since the observed C, N, and Al abundances of these N-rich stars (referred to as “NRS” from now on) are very similar to those of the so-called second generation (2G) stars in globular clusters (GCs) of the Galaxy (e.g., Carretta et al. 2009), the authors suggested that the origin of NRS is closely related to the destruction (disintegration) of globular clusters (GCs) within the Galactic bulge (S17). However, this GC destruction scenario for NRS can explain the observed significant fraction of NRS among the bulge stars (% for the bulge mass of ; S17), if GCs with a typical total mass of 2G stars being per GC (e.g., Carretta et al. 2009) are completely destroyed to release their inner 2G stars to the bulge region.
The required large number of destroyed GCs appears to be highly unrealistic, given that the present-day number of GCs (; Harris 1996). This can be dubbed as “over destruction problem” in this scenario. S17 first pointed out this over destruction problem and suggested that these NRS originated from the earlier generations of stars formed in the central region of the Galaxy. The observed apparently unimodal [Fe/H] distribution with the peak location around [Fe/H] was also suggested to be hardly explained by simple GC destruction processes, because the Galactic GC system is known to have a bimodal [Fe/H] distribution (S17). Thus, the observed properties of NRS strongly suggest that GCs are not the major host stellar systems of NRS in the bulge.
Previous one-zone chemical evolution models of the Galaxy showed that [N/Fe] can become maximum () around [Fe/H] (e.g., Fig. 9 in Chiappini et al. 2003). Therefore, the observed [N/Fe] of NRS appears to be hard to be reproduced in previous models in which N-rich ejecta from stars are mixed well with interstellar medium (ISM). There are two possible mechanisms for the formation of NRS: one is star formation almost “directly” from N-rich ejecta of asymptotic giant branch (AGB) stars (“AGB scenario”). Here new stars are formed from gas from AGB stars without mixing with ISM, after the gas is cooled down and trapped gravitationally by stellar systems. The other is star formation from gas polluted heavily by N-rich stellar winds of massive OB stars (“OB wind scenario”). Such NRS can be formed from ejecta from AGB stars, if the ejecta is not so much diluted by N-poor interstellar medium (ISM) during the formation of GCs (e.g., Fig. 1 in Bekki et al. 2007, B07). Furthermore, such NRS can show anti-correlations between N and C and between Al and Mg, depending on the models of AGB yields (B07). Our previous hydrodynamical simulations of star formation in GC-forming giant molecular clouds demonstrated that (i) NRS can be formed from gas heavily polluted by stellar winds of massive OB stars before the explosion of Type II supernovae (SNe II) and (ii) these stars show higher and CN anti-correlation (Bekki & Chiba 2007; BC07). Thus, these two promising mechanisms would need to be investigated in the context of the Galactic bulge formation.
It should be noted here that NRS were discovered not only in the Galactic bulge but also in the stellar halo (e.g., Martell & Grebel 2010, MG10; Koch et al. 2019). As discussed by these authors, the origin of NRS in the halo can be understand in the context of GC destruction like the NRS of the bulge. However, the required number of GCs to reproduce the observed mass fraction of NRS (CN-strong stars) in the halo () is again a bit too large (e.g., MG10). Therefore, it is fair to say that the origin of NRS in the halo is yet to be fully understood. If NRS both in the Galactic halo and bulge were all formed from GC destruction, then the Galaxy should have almost 550 GCs ( destroyed and survived) initially, which appears to be quite unreasonable (“over-population problem”; Koch et al. 2019).
| Symbol | Physical meaning |
|---|---|
| NRS (nrs) | N-rich stars with [N/Fe] |
| ns | new stars formed from gas |
| total mass of old stars | |
| total mass of new stars (“ns”) | |
| total mass of NRS | |
| total gas mass | |
| total gas mass accumulated in a system | |
| mass fraction of NRS () | |
| mass fraction of new stars () | |
| gas mass fraction | |
| mass ratio of NRS to new stars () | |
| size of a stellar system | |
| half-mass radius | |
| surface gas density | |
| mean stellar density within | |
| mean stellar density within | |
| threshold for NRS formation | |
| threshold gas density for star formation | |
| fraction of rotational energy | |
| dilution radius (for gas mixing) | |
| gravitational softening length | |
| mean stellar age (w.r.t. the start of a simulation) | |
| duration of star formation |
| Model | () | (kpc) | comments | |
|---|---|---|---|---|
| SA1 | 1.0 | 0.003 | fiducial | |
| SA2 | 0.7 | 0.003 | ||
| SA3 | 1.3 | 0.003 | ||
| SA4 | 2.0 | 0.003 | ||
| SA5 | 2.5 | 0.003 | ||
| SA6 | 3.0 | 0.003 | ||
| SA7 | 3.5 | 0.003 | ||
| SA8 | 4.0 | 0.003 | ||
| SA9 | 5.0 | 0.003 | ||
| SA10 | 1.0 | 0.0003 | ||
| SA11 | 1.0 | 0.001 | ||
| SA12 | 1.0 | 0.01 | ||
| SA13 | 1.0 | 0.03 | ||
| SA14 | 1.0 | 0.1 | ||
| SA15 | 1.0 | 0.3 | ||
| SA16 | 1.0 | 0.003 | ||
| SA17 | 1.0 | 0.003 | No dilution | |
| SA18 | 1.0 | 0.003 | atom cm-3 | |
| SA19 | 1.0 | 0.003 | atom cm-3 | |
| SA20 | 1.0 | 0.003 | atom cm-3 | |
| SA21 | 3.2 | 0.003 | ||
| SA22 | 10.0 | 0.003 | ||
| SA23 | 3.2 | 0.1 | ||
| SA24 | 0.1 | 0.003 | UCD model | |
| SA25 | 1.0 | 0.003 | ||
| SA26 | 0.3 | 0.003 | ||
| SA27 | 0.3 | 0.1 | ||
| SA28 | 0.7 | 0.003 | ||
| SA29 | 1.0 | 0.003 | ||
| SA30 | 3.0 | 0.003 | ||
| SA31 | 1.0 | 0.003 | atom cm-3 | |
| SA32 | 1.0 | 0.003 | ||
| SA33 | 0.3 | 0.003 | ||
| SA34 | 1.0 | 0.003 | ||
| SNS1 | 1.0 | 0.003 | no star formation | |
| SADM1 | 1.0 | 0.003 | with dark matter | |
| SADM2 | 3.2 | 0.003 | ||
| SADM3 | 1.0 | 0.003 | ||
| SADM4 | 1.0 | 0.003 | ||
| SAR1 | 1.0 | 0.003 | ||
| SAR2 | 1.0 | 0.003 | ||
| SB1 | 1.0 | 0.003 | ||
| SB2 | 3.2 | 0.003 | atom cm-3 | |
| SB3 | 3.2 | 0.003 | ||
| SC1 | 1.0 | 0.003 | ||
| SC2 | 1.0 | 0.003 | atom cm-3 | |
| DA1 | 3.2 | 0.003 | disk model | |
| DA2 | 3.2 | 0.1 | ||
| DA3 | 10.0 | 0.003 | LSB | |
| DA4 | 3.2 | 0.003 | LSB | |
| DA5 | 1.0 | 0.003 | ||
| DA6 | 1.0 | 0.003 | ||
| DB1 | 3.2 | 0.003 | ||
| DB2 | 1.0 | 0.003 |
NRS have been observed in other types of galaxies outside the Local Group. For example, one of ultra-compact dwarf galaxies (UCDs) in M60 (M60-UCD1, “the densest galaxy”) is observed to have [N/Fe]=0.61, (Strader et al. 2013), which clearly demonstrates that this UCD has NRS. Furthermore giant elliptical galaxies are observed to have moderately high [N/Fe] (up to ) and their [N/Fe] are higher in more luminous elliptical galaxies (Schiavon 2007). Given that these [N/Fe] are estimated from integrated spectroscopic properties of their entire populations including both major N-normal/N-poor stars and NRS, the observed moderately high [N/Fe] indeed implies that they also contain a significant fraction of NRS. Thus, the physical understanding of the origin of NRS can possibly lead astronomers to understand the origin of NRS in these galaxies too.
The purpose of this paper is thus to investigate how NRS can be formed in the Galactic bulge using our original hydrodynamical simulations with a new model for mixing of ejecta from AGB stars. As discussed in §2, the AGB scenario is more promising than OB wind one in the sense that the observed in the Galactic bulge can be more readily reproduced in the AGB scenario without invoking an unrealistic stellar initial mass function (IMF). We therefore investigate (i) and (ii) [N/Fe] distributions for the simulated stars in the context of the AGB scenario. Since the chemodynamical evolution of the Galactic bulge is very complicated and yet to be understood (e.g. Barbury et al. 2018), we consider two possible scenarios for the bulge formation in the present study. One is “merger scenario” in which the bulge is formed from merging of massive building blocks of the bulge such as stellar clumps developed through global disk instability (e.g., Noguchi 1998; Elmegreen et al. 2013) or low-mass dwarf-like galaxies formed from density fluctuation in the early universe. The other is “in site scenario” in which the bulge is formed from an inner disk of the Galaxy through bar instability.
One of key parameters in the present study is the total stellar masses () of stellar systems hosting NRS. The mass function of the building blocks depends on whether the bulge was formed from dwarf-like galaxies or stellar clumps (e.g., Cote et al. 2000; Genel et al. 2012; Mandelker et al. 2014; Tamburello et al. 2015; Inoue & Yoshida 2019). For example, the latest cosmological simulations by Inoue & Yoshida (2019) have shown that the stellar clumps, which can be the building blocks of the bulge, have stellar masses ranging from to in disk galaxies at . The mass function of stellar clumps in their simulations appears to be quite flat (see their Fig. 5), though the number of massive stellar systems with is small. If the mass function of dwarf-like building blocks is described as a power-law function with the slope of like the Local Group dwarf galaxies (e.g., Cote et al. 2000), then such massive stellar systems should be rare. Considering these previous works, we will investigate the formation of NRS for a wide range of .
The plan of the paper is as follows. We describe the models for spherical and disky systems that are building block of the bulge and the details of the new numerical simulations in §2. We present the results of numerical simulations of the formation of NRS in stellar systems with different model parameters in §3. Based on these results, we provide several implications of the present results in the context of NRS observed in the Galactic halo and in other galaxies in §4. We do not discuss much about the latest observational results on the kinematics of NRS (e.g., Fernández-Trincado et al. 2019a, b; Savino & Posti 2019), because we focus exclusively on the formation processes of NRS in the present paper. Although there are many recent chemical and dynamical studies of the Galactic bulge formation (e.g., Shen et al. 2010; Bekki & Tsujimoto 2011; Grieco et al. 2012; Martinez-Valpuesta et al. 2013; Ness et al. 2013; Di Matteo et al. 2014; Athanassoula et al. 2017; Debattista et al. 2019; Matteucci et al., 2019). we do not discuss the results of these in the present study.
| SF model | (Gyr) | (Gyr) |
| comments | ||
| A | 1 | 0.5 |
| B | 0.6 | 0.5 |
| C | 1 | 0.25 |
| D | 2 | 0.5 |
| E | 2 | 1.0 |
2 The model
2.1 NRS formation in the Galactic building blocks
In the present study, we adopt a scenario in which the Galactic bulge can be formed from merging of galactic building blocks that are either stellar clumps developed in the young disk of the Galaxy (e.g., Noguchi 1998; Elmegreen et al. 2013; Inoue & Saitoh 2012; Tamburello et al. 2015; Bounaud 2016) or dwarf-like galaxies. Many previous works investigated the formation and evolution of galactic bulges through minor and major mergers of galactic building blocks (e.g., Brooks & Christensen 2016 for a recent review). In this scenario, NRS can be formed in these building blocks, and during the merging of the building blocks, they can become the member stars of the bulge. In the previous works of the bulge formation in clumpy galaxies, the formation of NRS in stellar clumps and mergers was not investigated at all.
We therefore investigate the formation of NRS in stellar systems with the total stellar masses of (e.g.,Inoue & Saitoh 2012 for stellar clumps) various sizes (e.g., Tamburello et al. 2015) by adopting somewhat idealized models for the chemodynamical evolution of the systems. Recent hydrodynamical simulations of the Galaxy formation have demonstrated that the origin of the observed bimodal distribution of the Galactic disk stars on the map can be naturally explained in the context of star formation of massive clumps in the early dynamical history of the Galaxy (Clarke et al. 2019). Fig. 18 of their paper shows that the clump masses in the Galaxy range from to , which are similar to other recent works. The “Clump 2” in their Fig. 17 shows a bursty star formation with the duration of Gyr followed by a low level of star formation: this Clump 2 can correspond to the present better models for the formation of NRS. Brook et al. (2004) showed that the Galactic thick disk can be formed from hierarchical merging of massive stellar clumps at high . The stellar clumps in their simulations (see Fig. 4 of their paper) can also correspond to the host stellar systems of NRS.
Self-consistent simulations that describe both (i) the clump formation within disks and dwarf galaxy formation in cosmological simulations and (ii) the NRS formation within clumps and dwarfs should be done in our future works, because it is currently a time-consuming and numerally costly task to do owing the necessary new mixing method for ISM and AGB ejecta. For comparison, we also investigate the formation of NRS in the context of the bulge formation from a thin stellar disk through bar instability. In this scenario, NRS can be formed in the central region of the initial thin disk under some physical conditions. For convenience, the physical meanings for symbols that are often used for the Galactic building blocks are summarized in Table 1.
2.2 Basic mechanisms: AGB or OB wind scenarios
Nitrogen abundances in ejecta from AGB and stellar winds of OB stars can be rather high ([N/Fe]). Accordingly, if these ejecta can be converted into new stars without much dilution by N-poor ISM, the stars can have high [N/Fe]. Such formation processes of NRS were already discussed by previous works on the chemical evolution of forming GCs in the context of the AGB scenario (e.g., B07; D’Ercole et al. 2010) and the OB wind one (BC07). We first try to discuss which of the two is more promising in explaining the origin of NRS in the Galactic bulge and thus is worth a detailed investigation. The most crucial observational constraint on any theory of NRS formation is in the Galactic bulge (S17). The total mass of ejecta of AGB stars in a stellar system can be as large as % of the total mass of the stellar system (e.g., see Fig.1 in Bekki 2011; B11). Therefore, if these N-rich AGB ejecta can be converted into new stars, then the observed can be readily reproduced in the AGB scenario.
On the other hand, BC07 showed that is rather small (), even if the top-heavy IMF with the power-law slope of is adopted for star formation in the OB wind scenario. This is mainly because although a large fraction () of ISM can have high [N/Fe] () due to chemical pollution by N-rich stellar winds of first-generation OB stars, such N-rich gas cannot be converted efficiently into new stars owing to the strong feedback effects of OB stars and SNe II. Possibly, can be significantly higher if these feedback effects are severely suppressed in some particular environment. However, it seems highly unlikely that can be as high as in this OB wind scenario. We therefore conclude that the AGB scenario is more promising than the OB wind one and thus needs to be investigated exclusively in the present paper.
A key question in the AGB scenario is how AGB ejecta cannot be diluted by N-poor ISM to a large extent in galaxy environments. In normal star-forming, gas-rich galaxies, AGB ejecta can be mixed well and rapidly with ISM so that [N/Fe] of the ISM cannot increase significantly. Furthermore, N-poor ejecta from SNe II (e.g., [N/Fe] for [Fe/H]) can also reduce [N/Fe] of the ISM significantly. Therefore, if dilution of AGB ejecta by ISM and reduction of [N/Fe] by SNe II are both severely suppressed, NRS can be possibly formed almost directly from AGB ejecta. Since the wind velocity of AGB ejecta is rather low ( km s-1), it is reasonable and realistic to assume that these AGB ejecta can be all retained in galaxy-scale stellar systems.
2.3 Necessity to adopt the new AGB particle method
In almost all particle-based chemodynamical simulations of galaxy-scale systems like our own ones (e.g., Bekki 2013, B13), ejecta from a star (e.g., SNe II and AGB star) is assumed to be shared by its surrounding (neighboring) gas particles with the total number being several tens. Accordingly, the increase of the total mass of nitrogen () for a gas particle around one AGB star is as follows:
| (1) |
where and are the total mass of nitrogen ejected from the AGB star and the total number of gas particle around the star, respectively. In these simulations, one stellar particle is assumed to consist of stars with different masses and it can eject gas as SNe I, SNe II, and AGB stars with different masses at different times. The mass fraction of AGB ejecta in one star particle () is time-evolving and small (). Therefore, if [N/Fe]=0 for all gas particles, [N/Fe]=1 for AGB ejecta, , and , then [N/Fe] in one neighboring gas particle can increase [N/Fe] from 0 to 0.26.
Even in this extreme case of (i.e., all gas from all AGB stars can be ejected simultaneously an unrealistic assumption), the maximum possible increase of [N/Fe] is not enough to explain the observed [N/Fe] of NRS. In real simulations, is considered for different mass ranges of AGB stars so that the increase of [N/Fe] can be much smaller than the above 0.26: this can be dubbed “numerical dilution” in particle-based hydrodynamical simulations. In one-zone chemical evolution models, this artificial dilution can be more serious, because AGB ejecta is assumed to be mixed well with all gas in a galaxy. Bekki (2019, B19) has adopted a new “AGB particle” method in which new AGB particles can be ejected from a star when the star enters into its AGB phase. In this AGB particle method, a new star can be converted directly from an AGB particle so that the numerical dilution problem can be avoided. This AGB particle method has been recently adopted by Bekki & Tsujimoto (2019, BT19) in which rather high [N/Fe] () observed in the Galactic GC Cen can be reproduced well. It should be noted here that Cen has long been considered to be the nucleus of a defunct dwarf galaxy that is one of building blocks of the Galaxy (e.g., Freeman 1993). Thus we here adopt the new AGB particle method in our hydrodynamical simulations for the formation of NRS.
2.4 Initial stellar systems
We assume that an initial stellar system has either a Plummer spherical density profile (e.g., Binney & Tremaine 1987) or an exponential disk profile with a total stellar mass (), and a size (). In a Plummer model, the scale length () of the system is determined by the formula
| (2) |
where G is the gravitational constant and is a central velocity dispersion. The above equation is appropriate for systems with no initial angular momentum (i.e., dynamically supported only by velocity dispersion). However, it is highly likely that the building blocks of the Galactic bulge have global rotation, which should be considered in the present study.
We therefore introduce the parameter, , which is the ratio of rotational energy () to total kinetic energy () in a stellar system as follows:
| (3) |
Here we assume that all stars in a system has an angular speed of and thereby estimate for . Since the rotational energy of a stellar particle is simply , where and are the stellar mass and the distance of the star from the center of its host stellar system, respectively, can be easily derived for a given . Each component of the 3D velocity of a star is reduced by a factor of so that the total kinetic energy of the system can be the same as the initial value. Although we investigate the models , 0.3, and 0.7, we shows almost exclusively the results of those with . This is because the present key results () do not depend so strongly on : we focus on the importance of other parameters in the formation of NRS. Models with different and , which combine to determine the mean stellar density (), are investigated in the present study so that the importance of can be clearly elucidated.
In an exponential disk model, the radial () and vertical () density profiles of the stellar disk are assumed to be proportional to with scale length and to with scale length , respectively. In addition to the rotational velocity caused by the gravitational field of disk, the initial radial and azimuthal velocity dispersions are assigned to the disc component according to the epicyclic theory with Toomre’s parameter = 1.5 so that the disk can be stabilized against axisymmetric gravitational instability.
The stellar disk is assumed to be embedded in a massive dark matter halo with the density profile described by the so-called NFW profile (Navarro, Frenk & White 1996) derived from CDM simulations The adopted NFW profile is as follows:
| (4) |
where , , and are the spherical radius, the characteristic density of a dark halo, and the scale length of the halo, respectively. The -parameter (, where is the virial radius of a dark matter halo) and are chosen appropriately as 16 for the low-mass dwarf with the total mass of and kpc. A number of spherical systems are also assumed to have dark matter.
A stellar system is formed in a single starburst with the canonical Salplter IMF with the power-law slope () of , the lower mass cut-off () of , and the upper mass cut-off () of . The stellar system is assumed to have a mean age of and an age dispersion of : this is an age with respect to the starting time of a simulation (not an age with respect to the present time). This corresponds to the duration of the starburst in the stellar system. The age distribution of stars in the system is assumed to be a Gaussian with a mean age of and a dispersion of . We mainly investigate the models with Gyr and Gyr, though other models with different combinations of and are also investigated.
2.5 Gas and star formation
We investigate star formation from AGB ejecta mixed with ISM using our original chemodynamical simulations codes that can be run on GPU clusters (B13, Bekki 2015). The code combines the method of smoothed particle hydrodynamics (SPH) with calculations of three-dimensional self-gravitating fluids in astrophysics and incorporate various physics of ISM such as metallicity-dependent radiative cooling, chemical enrichment by SNe Ia, SNe II, and AGB stars, dust growth and destruction, and formation on dust grains. Since the details of the code are given in B13, we just briefly describe it in this paper.
An initial stellar system is assumed to have cold gas with a mass of that is left from the formation of the system itself. The gas mass fraction () is a key parameter that can control the formation processes of NRS in the system, because dilution of AGB ejecta by a large amount of ISM can prevent the formation of NRS. The initial distribution of the gas is assumed to follow the distribution of the stellar system. The initial [Fe/H] and [N/Fe] are set to be and , respectively, and this initial [Fe/H] corresponds to the peak [Fe/H] in the observed [N/Fe] distribution of NRS in the Galactic bulge (S17). When the mass density of a SPH gas particle exceeds a threshold value for star formation (), then the particle is converted into a collisionless “new star” particle as follows:
| (5) |
where is set to be atom cm-3 for most models. Since the present results can depend on , we will also investigate the models with atom cm-3 that corresponds to the typical mass density of the core of a GMC (e.g., Bergin & Tafalla 2007) and those with and atom cm-3.
In the present study, SN feedback effects are not included (i.e., “switched off”) for the following two reasons. First, we focus on the global parameters of stellar systems (e.g., , ) that can control the [N/Fe] distributions of new stars rather than on details of SN feedback effects in this preliminary study. Second, the star formation rates (SFRs) in most models are rather low ( yr-1), which implies that the maximum possible mass of stars in the star formation ( is rather low (e.g., Weidner et al. 2013, W13). This means a rather small number of massive stars with and thus a much less effect of SN feedback on ISM. Furthermore, collisions between molecular clouds, which can be a major trigger for the formation of massive stars with in gas-rich environments (e.g., Fukui et al. 2017), are highly unlikely in gas-poor environments in dense stellar systems. Since we recognize the important of SNe II in the evolution of [N/Fe], we plan to investigate this issue in our future papers.

2.6 AGB particle method
We consider that all AGB stars with can eject gas with a wind velocity of km s-1 and the chemical abundances consistent with the adopted chemical yield table. In the present study, we use [N/Fe] calculated for metal-poor AGB stars by Fishlock et al. (2014, F14) in order to estimate [N/Fe] of new stars. In the AGB particle method (B19) adopted in the present chemodynamical simulation, soon after a new star enters into its AGB phase, just one new SPH gas particle (“AGB gas particle”) is ejected from the star with its initial speed of 10 km s-1 with respect to the star. Accordingly, the present simulation with this new mixing method is quite different from other chemodynamical simulations of galaxies in which neighboring gas particles around the AGB star cannot have the same chemical abundances as the AGB ejecta because mixing of AGB ejecta and the gas particles at the time of gas ejection is always assumed.
In the new mixing method, the AGB gas particle can initially have the original chemical abundances of AGB ejecta (mixing with ISM at the time of gas ejection is not assumed). This N-rich AGB particle can be mixed with its surrounding ISM and thereby change its chemical abundances. only if there are gas particles within the “dilution” (“mixing”) radius (, which is later described) for the AGB particle. The search of neighboring gas particles around AGB stars is therefore done at each time step in a simulation. If the gas particle has no neighboring gas particles and have higher than , the new star formed from the gas can have chemical abundances that are the same as those of AGB winds. Therefore, new stars formed directly from AGB ejecta can be identified as NRS. New stars that are formed from AGB ejecta without much dilution by ISM can also be identified as NRS.
Each stellar particle represents a collection of stars with a particle mass: stellar particles are not literally stars in galaxy-scale simulations. According, stellar particles that represent progenitor of AGB stars can eject gas particles when they enter into their AGB phases. The main-sequence lifetime () is allocated for each stellar particle, and accordingly th stellar particle has dependent on stellar masses. In the present study, corresponds to the starting time of a simulation, and the age of a stellar particle is measured from the starting time :th stellar particle with its age of is born at . Therefore, gas particles can be ejected from th stellar particle when the following condition is met:
| (6) |
Therefore, th stellar particle has already died out (i.e., gas ejection has been completed) at the starting time of a simulation, if is shorter than . This can happen for stellar particles that represent massive AGB stars with short lifetimes in some models.
We consider that AGB gas particle can change its chemical abundances owing to diffusion of metals, if it has neighboring gas particles. We model this diffusion process based on the recent results from hydrodynamical simulations of turbulent diffusion (Greif et al. 2009). We introduce a “diffusion radius” () within which the chemical abundances of all particles within can be the same owing to the efficient diffusion of metals. We mainly investigate the models with , where is the gravitational softening length for gas particles, which can control the spatial resolution of a simulation. However we investigate the models with (no diffusion), , and and show only some of the results, because is not so important in the formation of NRS in comparison with other model parameters.
2.7 Parameter study
We describe the results of 53 representative models with different parameters in the present study, and the model parameters are summarized in Table 2. The first character in a model identification (ID) number (e.g., “S” in SA1) describes whether the model is a spherical (“S”) or disky (“D”) system. The second character (e.g., “A” in SA1) in the model ID represents the ID number of the star formation model. The parameters for star formation models are summarized in Table 3. For comparison, spherical models with dark matter are investigated, and the ID names of the models contain “DM” in the third and fourth characters (e.g., SADM1). The models without star formation (labeled as “SNS1”) is investigated so that we can better understand how AGB ejecta can be accreted within stellar systems.
Although we investigate the models with different (=0, 0.3, and 0.7), we describe the results of the models with almost exclusively, because the present results do not depend strongly on . The models with (without rotation) and 0.7 (more rotation) are labeled as SAR1 and SAR2, respectively: all other spherical models have . We choose this , because the Galactic bulge is observed to have such rotational kinematics (e.g., Fig. 11 in Ness et al. 2013). The models with different , (), , , , , and are investigated, though is most extensively investigated in comparison with other parameters.
We mainly show the results of the fiducial model SA1 with , kpc, , Gyr, Gyr, and atom cm-3, because this gas-poor models shows a typical behavior of NRS formation in the present study. The initial total numbers of particles in a stellar system are are , where is the initial gas mass fraction in the system: for , for example. The total number of gas particles increase dramatically with time due to the ejection of gas particles from AGB stars. The mass and size resolutions are and 5 pc, respectively, in the fiducial model.
The disk models with , kpc, kpc, Gyr, Gyr, corresponds to the progenitor disk of the Galactic bulge. Although it is unlikely that this massive stellar disk is formed from a single giant starburst, we investigate this model in order to discuss “in situ” formation of NRS within the bulge’s progenitor disk. For comparison, we also investigate a massive spherical stellar system with , Therefore, if the formation of NRS in these spherical and disky models are demonstrated in the present study, then it means that “in situ” formation of NRS is possible.
One of key properties of NRS is the mass fraction of NRS among all stars initially in a system, which is defined as follows:
| (7) |
where is the total mass of NRS with [N/Fe]. Here we assume that there are no NRS in the old stars of a system. In addition to , the mass ratio of NRS to all new stars () is also investigated in detail and is defined as follows:
| (8) |
where is the total mass of news stars. If this is quite low in a stellar system, it would be difficult for observations to find NRS among a limited number of stars that can be observed for the system. We also investigate the mass fraction of new stars in a stellar system, which is defined as follows ():
| (9) |
Although we investigate stellar systems with star formation models AE, we describe the results of the models A, B, and C in detail: those for D and E are not described. This is because stellar systems with the models D and E show rather small (i.e., less than the required 0.01). In these D and E models with Gyr, massive and intermediate-mass AGB stars () are assume to have finished gas ejection at the starting time of a simulation. Therefore, the total mass of AGB eject that can be accumulated within a system is rather small () so that cannot exceed the required . This means that stellar systems should retain AGB ejecta from a wide mass range to form a large fraction NRS a constraint for the formation of NRS in the AGB scenario.
3 Results
3.1 Massive spheroidal systems
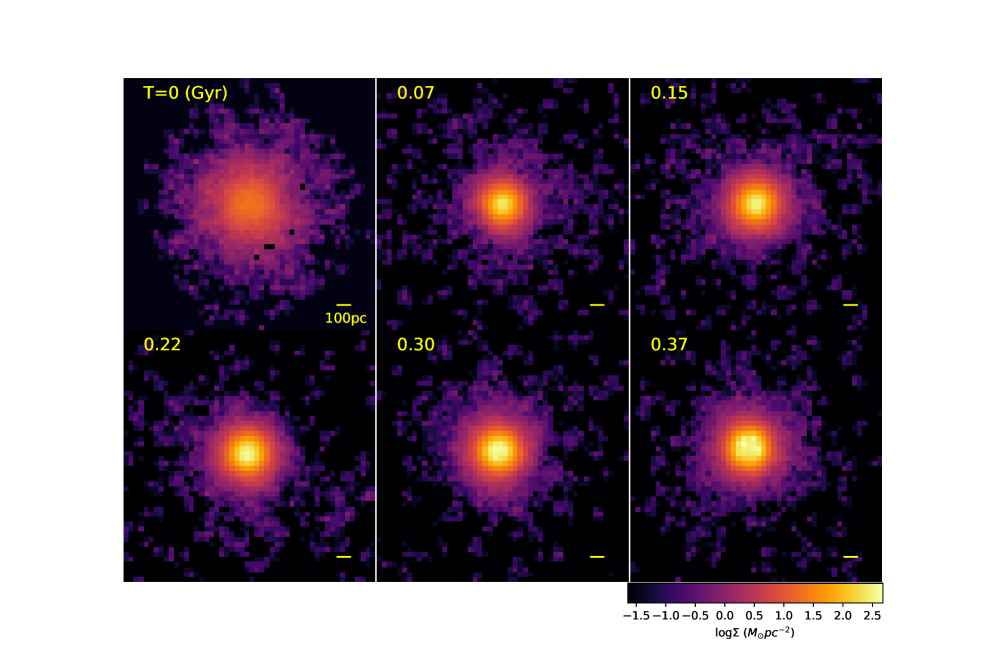
Figs. 1 and 2 show the 2D maps of the projected total gas density of ISM () at six selected time steps in the the spherical model SNS1 without star formation in which the parameter values are exactly the same as those in the fiducial model SA1. Since star formation is not included in this model, it can more clearly show how the spatial distribution of original ISM mixed with AGB ejecta evolves with time in the deep potential well of the system. Clearly, gradually increases due to the continuous ejection of gas from AGB stars with different masses within the system. The system can develop a thick disk-like structure with pc-2 within Gyr. Gas ejected from AGB stars can fall onto the thick gas disk so that the disk can grow slowly.
The formation of the thick gas disk is closely related to the initial angular momentum of the stellar system with (i.e., rotational energy of stars being 30% of the total kinetic energy of the system). Therefore, it is possible that the gas disk become more compact for the models with smaller . As described later, new stars can be formed steadily in the gas disk composed of original ISM and AGB ejecta so that the stars can have disky kinematics.

The time evolution of gaseous distribution in the fiducial model SA1 with star formation is essentially the same as that shown in Figs. 1 and 2 for SNS1 without star formation Fig. 3 shows the time evolution of (i) the total mass of gas that is the sum of the original ISM and the total mass of gas ejected from AGB stars (), (ii) that of new stars , (iii) mass ratio of new stars to the original stellar mass (), and (iv) star formation rate (SFR) in the fiducial model SA1. The initial (spiky) higher SFR () is due to star formation of original ISM that is not mixed with AGB ejecta. This star formation corresponds to the formation of N-poor ([N/Fe]) stars. The increase of gas mass due to continuous ejection of gas from AGB stars is gradual in the stellar system, and consequently, the SFR can be kept low ( yr-1). The system can have only after Gyr long continuous conversion of ISM by star formation. The timescale for a system to have can be shorter than Gyr in some models (e.g., 0.37 Gyr for SB1).

Recent theoretical studies of star formation have suggested that there can be a strong relation between a SFR and a maximum possible mass of stars (, the upper mass cut-off in the IMF) in a star-forming galaxy (e.g., W13). The predicted SFR relation (e.g., Fig. 1 in Bekki et al. 2017) implies that can be for the derived rather low SFR. Such a possible low means a smaller number of SNe II that can expel ISM from a stellar system owing to the energetic feedback effects. Therefore, the rather low SFR in the fiducial model suggests that SNe II does not influence the evolution of ISM so much. Since [N/Fe] of SNe II can be quite small ([N/Fe] for low-metallicity; BT19), the possibly very small number of SNe II means that SNe II cannot lower [N/Fe] of ISM that is enriched by AGB ejecta.
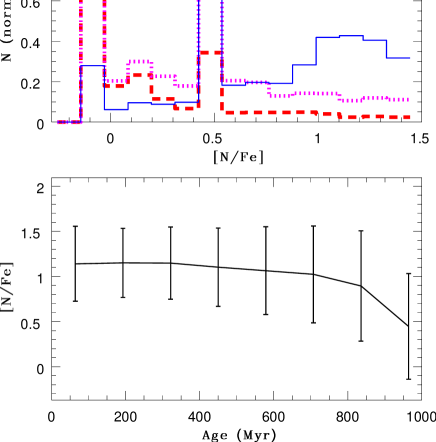
Fig. 4 shows that there is a distinct peak around [N/Fe] in the [N/Fe] distribution, which reflects that a large fraction of AGB ejecta can be converted into new stars without much dilution by N-poor original ISM. There is also a weak peak around [N/Fe], which corresponds to star formation from gas ejected from AGB stars with lower masses. Since the adopted [N/Fe] is rather high ([N/Fe]) for masses lower than , new stars formed almost directly from AGB ejecta can have rather high [N/Fe] in the present study. The weak peak around [N/Fe] is due to the formation of new stars from original ISM with low [N/Fe]. A key physical process here is that new stars are formed from AGB ejecta that is gravitationally trapped by the stellar system and cooled down to form high-density gaseous regions. If AGB winds are all removed from the systems, then the [N/Fe] distribution of new stars formed from ISM simply reflects the original ISM abundance (i.e., low [N/Fe]).
The peak location of the [N/Fe] distribution reflects the mass range of AGB stars whose ejecta is efficiently converted into new stars without much dilution by ISM. The [N/Fe] peak fiducial model means that ejecta from AGB stars with contributes significantly to the formation of NRS. It should be noted here, however, that the location of the peak can be changed significantly, if different yield tables for AGB stars are adopted. For example, the predicted [N/Fe] for different masses of AGB stars are different between F14 and Ventura et al. (2013, V13) that has been often used in chemical evolution studies of GCs: [N/Fe] is for intermediate AGB stars () with in V13 whereas it is in F14. The significantly larger [N/Fe] for AGB winds in V13 implies that the peak position of the simulated [N/Fe] distribution moves to the higher [N/Fe], if the present chemodynamical models adopt the AGB yields from V13. This further implies that the fraction of NRS () for lower metallicities can be lower in chemodynamical simulations with AGB yields from V13, if gas from AGB stars is the major gaseous fuel for the formation of NRS.
Since the predicted AGB yields are significantly different over a wide range of stellar masses between F14 and V13, it could be possible that the details of the simulated [N/Fe] distributions can be also different between models with AGB yields from F14 and V13. Currently, there is an uncertainty in the observed [N/Fe] distribution of the Galactic bulge owing to the upper limit of [N/Fe] in the ASPCAP spectral library (S17). Therefore, it is not possible whether the derived [N/Fe] peak around and the shape of the [N/Fe] distribution are consistent with the corresponding observations. If a large number of stars with [N/Fe] are found in future observational studies with a better spectral library for [N/Fe], then they can be used for a strong constraint for theoretical models of NRS formation.
The age-[N/Fe] relation of new stars in this model is almost flat for ages younger than Myr, though the relation shows large dispersion for all age bins over Gyr evolution of the system. Different local regions of ISM are polluted by AGB winds to different degrees so that they can have quite different [N/Fe] over Gyr evolution of the system: chemical pollution by AGB winds proceeds in an inhomogeneous way. This is a physical reason why the dispersion of [N/Fe] in each age bin can be quite large. New stars older than Myr shows a decreasing [N/Fe] with increasing ages. Mean [N/Fe] in ISM can increase slowly and steadily in the early evolution of the system in the first few 100 Myrs. Therefore, new stars formed from ISM can show lower [N/Fe] in the first few 100 Myrs.
Fig. 5 compares the simulated [N/Fe] distributions between nine representative spherical stellar systems with different parameters. Structural parameters for the stellar systems are exactly the same as those in the fiducial model (i.e., and kpc), yet other parameters (e.g., are different. The model SA18 with atom cm-3 show a much smaller number of NRS in comparison with SA19 with atom cm-3 SA20 with atom cm-3. In the present model, [N/Fe] of original N-poor gas particles can increase due to their mixing with AGB (through dilution) before the particles are converted into new stars. Therefore, if the duration of “gas phase” is longer, then original N-poor gas particles can increase their [N/Fe] to a larger extent. Thus, the models with lower , in which gas phase is typically shorter, can have a smaller number of NRS.
The strongest peaks in the [N/Fe] distributions are not around [N/Fe] in SA19 and SA20, as shown in the fiducial model, but they are shifted to higher [N/Fe]. In these models with rather high , there is a very small number of N-poor stars ([N/Fe]), because original N-poor gas particles with initially small [N/Fe] can be converted into new stars only after their [N/Fe] becomes rather high due to mixing with AGB ejecta. Although these two models SA19 and SA20 show slightly higher (0.94 and 0.98, respectively) than the fiducial model SA1, their are and , respectively. which are significantly lower than SA1. Thus, the model SA20 with , which is less than 0.01, might not be useful to discuss the observed in the Galactic bulge and halo.
The models with different and show different [N/Fe] distributions, which reflect the relative contribution of high- and intermediate-mass AGB stars. The model with smaller Gyr ( Gyr) shows a distinct peak around [N/Fe] and a smaller fraction of NRS with [N/Fe]. This model also has larger () and (0.96) thus . This larger is due to the participation of a wider mass range (thus a larger mass fraction) of AGB stars in star formation: ejecta from AGB stars with ages older than 0.1 Gyr can be mixed with ISM. However, the model with Gyr ( Gyr, and atom cm-3 shows the strongest peak around [N/Fe]=1.1 and (by a factor of lower than the above model). Again, should not be too high to construct a model that shows larger .
The models with Gyr and Gyr does not have NRS with [N/Fe] for two different . This is mainly because star formation is assume to occur only after N-rich ejecta of AGB stars with masses lower than has been removed from the stellar systems completely. This model would not be so appropriate for a comparison with the observed of the Galactic bulge, because is low ( for atom cm-3). The model with much more efficient dilution ( pc) shows a very small fraction of stars with [N/Fe], because original N-poor gas particles are converted into new stars only after pollution by AGB stars. The model with dark matter halo has an almost identical [N/Fe] distribution to the fiducial model, which suggests that the dark matter potential does not influence the dilution process of AGB ejecta and the star formation process in the stellar system with .
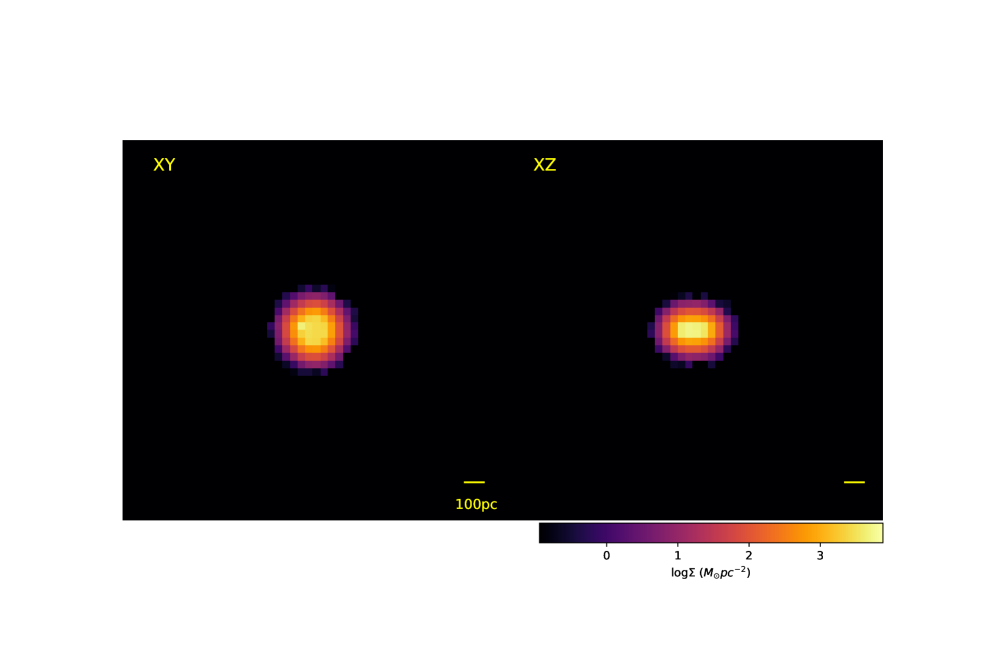
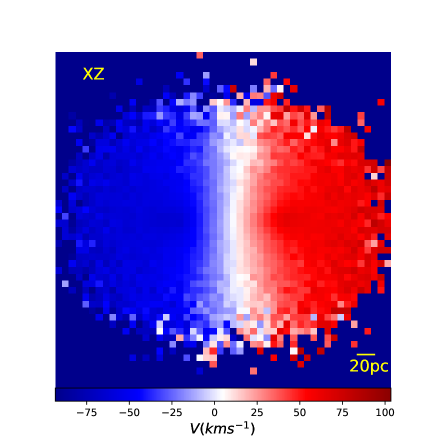
Fig. 6 demonstrates that the distribution of new stars at Gyr in the fiducial model is rather compact and flattened with the central density as high as pc-2. The vast majority of the new stars reside within the central 200 pc of the original stellar system. Since almost 90% of the stars are NRS, this result means that NRS are the dominant stellar populations in the central region of the system. Fig. 7 clearly shows that NRS has rotational kinematics with the maximum circular velocity of km s-1 and a sign of cylindrical rotation in the - projection, which reflect the dissipative formation of a gas disk from accreted AGB ejecta. This rotational kinematics can be seen in all models of the present-study, because the original stellar systems are assumed to have initial rotation.
3.2 Parameter dependence
The present results depend on , , , , , , and initial stellar distributions in stellar systems. Among these, it is found that the initial mean stellar density of a system () is a key parameter that controls at the final time step of a simulation. Since observational studies of galactic mass-size relations often derive a scaling relation between the half-mass radius () and the mean stellar density at (), we here clarify the relation between and estimated from the adopted Plummer model as follows:
| (10) |
Accordingly, is used to discuss possible in various types of galaxies based on the observed mass-size relations of galaxies.
We mainly describe how the present results depend on , , and stellar distributions of stellar systems, because other parameters are not so important as these three for . For example, the models with (SADM12) and without dark matter show similar , and does not depend on (SA1, SAR1, and SAR2). The model SADM4 with shows () that is quite different from derived in the models with yet without dark matter (). The physical reason for this no star formation is that AGB ejecta cannot be retained in the systems due to their shallow gravitational potentials. This means that low-mass dwarf galaxies need to be embedded in massive dark matter halos to form NRS.

3.2.1 Mean stellar mass density ()
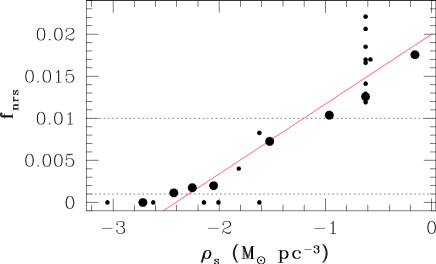
As shown in Fig. 8, the models with higher () are likely to have larger . Furthermore, there is a threshold ( pc-3) above which can be larger than 0.01: this threshold is referred to as (or at ). Therefore, we can consider that if stellar systems meet the following condition, then is possible:
| (11) |
The models with and kpc can have very small (), which implies that low surface brightness dwarf galaxies are unlikely to have NRS. For an illustrative purpose, we derive as a function of using the results for the fiducial models and those in which model parameters other than are the same as those in the fiducial model (shown as big filled circles in Fig. 8). The functional form of can be written as follows:
| (12) |
This can be rewritten for as follows:
| (13) |
Fig. 9 describes the star formation histories of models with different for , Gyr, and Gyr. Clearly, SFRs in lower are systematically lower owing to the low mass densities of the newly developed gas disks embedded in spherical systems. In some models with rather low , no star formation is possible (i.e., no NRS). The low-mass models with can show star formation (but an order of yr-1) only if they are very compact ( pc). The UCD model with and pc shows relative high SFR and larger (0.015). This result suggests that UCDs are likely to constrain NRS in their central regions. The model with and kpc, however, shows a much lower SFR and a lower than the UCD model which confirms that is a key parameter for NRS formation.
3.2.2 Initial gas mass fraction ()
Fig. 10 demonstrates that the strongest peaks in [N/Fe] distributions can be around [N/Fe]=0.5 only in the models with . In gas-rich models with , the vast majority of new stars are formed from original N-poor gas particles that cannot be so heavily polluted by AGB ejecta. Consequently, only gas-poor models can have a large fraction () of NRS in their new stars. The total mass of new stars can be larger than in the very gas-rich model with , however, is small (). The mean SFR is high ( yr-1) in this model so that the adopted assumption of no SNe cannot be realistic according to the -SFR relation (W13). It is likely that ejecta with low [N/Fe] from SNe II can significantly lower [N/Fe] of ISM in this gas-rich model. The model with and pc show a much smaller fraction of NRS with [N/Fe] than SA1.
3.2.3 Disk vs spheroid: in situ formation
Fig. 11 describes the [N/Fe] distributions of “in situ” spheroidal and disk models in which the Galactic bulge is assumed to be formed in a single burst. The massive spheroidal stellar systems with and kpc can have a large fraction of NRS among all new stars () and their [N/Fe] distributions are similar to that of the fiducial model. There is no significant difference in the [N/Fe] distributions and () between these models with and without dark matter, which again confirms that dark matter cannot influence the formation of NRS. The dependence of [N/Fe] distributions on , , and in these models are very similar to those derived for the models with . Intriguingly, the low-density model with kpc (corresponding to a LSB) shows a peak around [N/Fe] and . All new stars are formed from original gas particle polluted by AGB ejecta, though the total mass is only .
The disky stellar systems can form NRS within their central regions for the models with with and and finally have . This suggests that the formation of NRS is possible, even if the Galactic bulge was formed from a bar instability in an initially thin disk. These disky models also show parameter dependences of the result on and that are similar to those found in the spheroidal models. The low-density model with (yet the same mass of dark matter as the above DA1) and kpc shows a single peak around [N/Fe]=0.8 and a very small total mass of new stars ( corresponding to ). This suggests that although LSBs can have NRS, their possibly very low would make it hard for observers to find them.


4 Discussion
4.1 Effects of SNe Ia on [N/Fe] distributions
Ejecta from SNe Ia can significantly change [Fe/H] of ISM in the building blocks of the Galactic bulge, if it is gravitationally trapped by the blocks and then mixed with ISM. However, the present study did not consider star formation of such mixed gas at all. Accordingly, we here discuss how SNe Ia can possibly change the [N/Fe] of NRS formed from ISM by assuming that (i) stellar systems have a canonical IMF (as adopted in the present study), (2) 3% of stars with become binary stars that explode as SNe Ia, and (ii) iron is ejected from one SNe Ia. For an adopted canonical IMF, about SNe Ia is expected for stellar system. This is lower than estimated for the Large Magellanic Cloud (LMC; Maoz & Badenes 2010). If we adopt , the total mass of iron ejected from all possible SNe Ia over the Hubble time in a stellar system with is stellar system. If the total mass of the ISM () in the stellar system is and if its metallicity is [Fe/H], then the total mass of iron in the ISM is about .
Therefore, if only % () of ejecta from all possible SNe Ia is mixed with the ISM, then the total iron mass in the ISM can become by a factor of larger than the original mass: [N/Fe] of stars formed from the ISM can be significantly decreased. If is , then is required to significantly increase [N/Fe] of stars. However, it should be stressed here that (i) only a fraction of all SNe Ia can explode in less than 1 Gyr corresponding to the formation timescale of NRS in the present scenario and (ii) SNe Ia ejecta with high ejection velocity is unlikely to be trapped by gravitational potentials of low-mass stellar building blocks. We can estimate the fraction of SNe Ia that explode within less than 1 Gyr () by adopting the delay time distributions for SNe Ia () adopted in our previous chemical evolution models of the LMC (Bekki & Tsujimoto 2012). If , then . However, If the prompt SNe Ia model is adopted (), then . Accordingly, only [10-50]% of ejecta from all SNe Ia can be mixed with ISM within Gyr.
Since the escape velocities of stellar systems with masses less than that are considered in the present study is much lower than km s-1 (an order of magnitude for the ejection velocity of gas from SNe Ia), it is possible that most ejecta from SNe Ia can escape from the systems. Therefore, it is likely that only a tiny fraction of ejecta from all SNe Ia can be mixed well with ISM in low-mass stellar systems. It is not possible for the present study to present a more quantitative discussion on how much amount of iron ejecta from SNe Ia can be mixed with ISM without hydrodynamical simulations for the mixing of SNe Ia ejecta with ISM. It is thus our future study to numerically investigate how [N/Fe] distributions of low-mass stellar systems can be influenced by SNe Ia.
4.2 The origin of NRS in the Galactic bulge
We have demonstrated that in stellar systems can be as high as , which is only slightly lower than the observed for the Galactic bulge by S17 (), though there are required conditions for . Furthermore, a few models (e.g., SB1 and DB1 with Gyr) can show up to . Accordingly, the present study strongly suggests that NRS in the bulge can originate from NRS initially in its building blocks: the Galactic bulge was formed from massive stellar clumps () initially with NRS. Since NRS can be formed in the building blocks as field stars, there is no/little need to invoke a large number of dissolved GCs with NRS in explaining the observed . It is possible that N-rich 2G stars originating from dissolved GCs can be a minor population in NRS of the bulge.
However, can be as high as after Gyr continuous formation of NRS in stellar systems. It could be possible that SNe II or SNe Ia can truncate the star formation or reduce [N/Fe] of ISM from where NRS can be formed. If such truncation of star formation occurs, then can be significantly reduced. This possibly low can be avoided if the IMF of NRS is top-light and bottom-heavy. For example, if the IMF of a host stellar system of NRS is a top-heavy with , , and , and if that of NRS is a bottom-heavy one with , , and , the mass fraction of low-mass stars with among all stars formed is 0.27 for the host system and 0.68 for NRS. Accordingly the present-day can be even if it was at the time of NRS formation. Thus, the possibly low would not be a serious problem in the present scenario.
The observed [N/Fe] distribution of the bulge stars shows a peak around [Fe/H], which is not consistent with the peak location of the MDF of the Galactic GC system (S17). Although the present study has not yet provided a clear explanation for the peak location, it is possible that this [Fe/H] reflects the typical metallicity of the bulge’s building blocks. It is beyond the scope of this paper to quantify the mean and dispersion of [Fe/H] among the stars of the bulge’s building blocks. Chemical enrichment can proceed in high-density ISM, because more efficient star formation in denser gas can end up with more rapid chemical enrichment. Therefore, if only high-density building blocks can form NRS in the present scenario, the typical metallicity of the building blocks could be higher.
If star formation from ISM polluted heavily by AGB stars can continue even after stars with start to pollute ISM, then ISM within stellar systems can have higher abundances of -process elements due to the high abundance in the AGB winds (e.g., [La/Fe] for in F14). Accordingly, if such low-mass AGB stars contribute to the chemical pollution of ISM, then NRS can possibly show significant enhancement in [La/Fe] and [Ba/Fe]. If only more massive AGB stars can contribute to the chemical enrichment, then the level of such -process enhancement should be minor (e.g., [La/Fe] for ; F14). Currently, it is not observationally clear whether NRS have higher [La/Fe] and [Ba/Fe] in comparison with N-normal/N-poor bulge stars. Thus, [La/Fe] and [Ba/Fe] in NRS combine to provide strong constraints on (i) a mass range of AGB stars that contribute to the chemical enrichment of ISM by AGB winds and therefore (ii) the formation timescale of NRS.
In the present study, we have focused exclusively on the AGB scenario, but did not discuss the OB wind scenario at all. As shown in BC07, the fraction of N-rich gas ([N/Fe]) can be high (), however, such N-rich gas cannot be converted efficiently into new stars within star-forming molecular clouds owing to the strong feedback effects of SNe II. If this N-rich gas is recycled into ISM (without being expelled by SNe II) in massive and dense stellar systems with much deeper gravitational potentials than molecular clouds, then NRS could be formed from such gas. This possible retention of N-rich gas originating from star-forming clouds would needs to be investigated in our future studies. NRS formed from such N-rich gas cannot show abundance enhancement in -process elements as shown in the AGB scenario: [La/Fe] and [Ba/Fe] of NRS can be used to distinguish between the two scenarios for NRS formation.
4.3 Formation of NRS in the Galactic stellar halo
The Galactic stellar halo is observed to have N-rich (“CN-strong”) stars with the fraction being among all stars of the halo (e.g., MG10; Koch et al. 2019). The similarity in chemical abundances between the NRS and 2G stars in the Galactic GCs has led astronomers to think that their origin is related to GC destruction in the Galaxy. However, as suggested by the above authors, a large number of GCs with 2G stars should be destroyed to explain the observed significant fraction of NRS. If the total mass of the halo is and if the mass fraction of 2G stars in GCs is typically 0.5 for a typical GC mass of , then means that GCs should be completely destroyed. Since the required number of GCs is significantly larger than the currently observed one (), this GC destruction scenario cannot properly explain the observed . Furthermore, NRS are observed to exist even in the outer part of the halo ( kpc), where tidal destruction of GCs is highly unlikely. Thus, this scenario is not so promising for the origin of NRS in the halo.
The present new results suggest that if most of the halo’s building blocks have mean stellar densities higher than the required threshold stellar density () for the formation of NRS, then the observed can be naturally explained in the present scenario. We accordingly suggest that the vast majority of NRS in the halo can originate not from GCs but from its high-density building blocks initially with NRS. The presence of NRS in the outer halo region ( kpc) can be due to tidal stripping of stars of the high-density building blocks. Intriguingly, is very similar between the bulge and the halo, which can be also naturally explained by the present scenario.
4.4 Stellar densities of galaxies as a key parameter for NRS
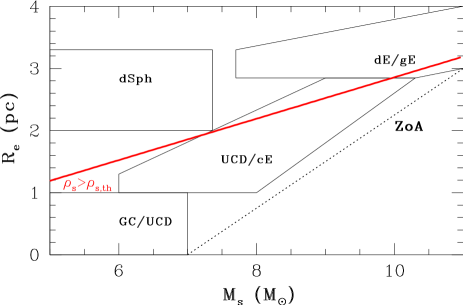
The present study has shown that can be significant () only in stellar systems with pc-3, which means should be higher than pc-3 at the half-mass radii. This threshold stellar density () can be used to discuss whether dwarf spheroidal galaxies (dSph) can form NRS based on the observed size-mass relation (e.g., Fig. 1 in Forbes et al. 2014). Most of dSphs have 100 pc1000 pc and , which means pc-3 pc-3. Although only massive ( and more compact ( kpc) dSphs can have higher than , such dSphs are rare (e.g., F14): only two dSphs appear to have . Therefore, it is unlikely that dSphs can have .
Although Recent observational studies indeed have tried to find NRS in nearby dwarf galaxies (e.g., Sculptor dwarf spheroidal), they did not find NRS (e.g., Salgado et al. 2019). Hasselquist et al. (2017) have found that only one of many stars in Sagittarius dwarf galaxy shows [N/Fe] (see Fig. 3 in their paper). These results are consistent with the prediction of the present study, because the stellar mass densities of these dwarf spheroidal galaxies are rather low. Compact elliptical galaxies (cEs) and UCDs are highly likely to have , because they have quite small (F14). Massive () yet compact ( kpc) dwarf elliptical galaxies (dEs) are also likely to have , and indeed there are a number of such objects seen in F14. Although spectroscopic confirmation of the presence of NRS in these galaxies with high is formidable, such observational studies are valuable for the origin of NRS.
A remaining question is whether stellar systems with any masses can have a significant fraction of NRS as long as they have . If is lower than , then, AGB winds cannot be retained is stellar systems so that new stars cannot be formed from AGB ejecta (B11). On the other hands, if stellar systems are massive enough to retain a large amount of warm/hot gas ( K) within them, then AGB ejecta will be thermally heated up due to interaction with such warm/hot gas. Accordingly, it would be unlikely that the AGB ejecta can finally form local high-density regions from where NRS can be formed. Accordingly, there could be a mass range for which NRS can be formed from AGB ejecta after its mixing with ISM. Fig. 12 briefly illustrates which stellar systems are more likely to have significant fractions of NRS ().
4.5 NRS in elliptical galaxies
Giant elliptical galaxies with -band magnitude () of mag are observed to have [N/Fe] and [N/Fe] is observed to be higher for smaller (i.e., brighter elliptical galaxies; Schiavon 2007). These [N/Fe] values for elliptical galaxies are based on the integrated spectroscopic results for the entire galaxies. Therefore, even if mass fractions of NRS are significant () in these galaxies, the average [N/Fe] can be small, because the vast majority of the stars have lower [N/Fe]. If an elliptical galaxy consists of NRS with [N/Fe]=1 and N-normal stars with [N/Fe]=0 and if their mass fractions are 0.05 and 0.95, respectively, the average [N/Fe] is . Therefore, the observed [N/Fe]=0.2 implies that bright elliptical galaxies can have a large fraction of NRS. The higher [N/Fe] in more luminous elliptical galaxies implies that more luminous elliptical galaxies were formed from a larger fraction of high-density galactic building blocks initially with NRS.
Recent theoretical and observational studies have suggested that the ultraviolet (UV) upturn of giant elliptical galaxies can be closely related to disintegration of massive GCs that are building blocks of the galaxies, because such GCs can have He-rich stars. (Bekki 2012; Goudfrooij 2018). Since NRS should have also high in the present scenario, they can be also responsible for the origin of the UV upturn that can be caused by a significant fraction of He-rich stars. If giant elliptical galaxies were formed from multiple merging of high-density galactic building blocks, they should be able to have a significant fraction of He-rich stars too. Therefore, the origin of the UV-upturn is closely related to the formation of NRS within the building blocks of giant elliptical galaxies.
5 Conclusions
In order to elucidate the origin of N-rich stars with [N/Fe] (NRS) observed in the Galactic bulge, we have adopted a new scenario of NRS formation and thereby investigated in what physical conditions such stars can be formed. In the scenario, NRS were first formed in the building blocks of the bulge (e.g., stellar clumps; Noguchi 1998; Elmegreen et al. 2013) and then become the members of the bulge after merging of these building blocks. We have first investigated whether NRS can be formed from interstellar medium (ISM) mixed with N-rich ejecta from (i) stellar winds of massive OB stars or (ii) asymptotic giant branch (AGB) stars and found that AGB ejecta is more promising in explaining the observed fraction of NRS in the bulge.
Therefore, using our original numerical simulations with a new mixing model of AGB ejecta, we have investigated the details of star formation processes from ISM polluted by AGB stars in massive spherical and disky stellar systems that are the building blocks of the bulge. Since we have investigated this for the first time, we have assumed that (i) a stellar system is formed in a single starburst and (ii) new stars can be formed after most of the original gas is swept away by energetic Type II supernovae (SNe II) events during the formation of the systems. In this preliminary study, we have adopted an assumption that there are no SNe Ia and SNe II events during the formation of NRS. Non-inclusion of these SNe events would lead the present study to over-estimate the fraction of NRS (), because iron production from these SNe can decrease [N/Fe] of stars formed from ISM polluted by such events.
The key parameters in this first parameter study are (i) the total masses of the stellar systems (), (ii) the mean stellar densities (, where is the size of a galaxy), (iii) the gas mass fraction of ISM (), (iv) the mean ages of the stellar populations (), and (v) the duration of the initial starbursts (). We have mainly investigated how the mass fractions of NRS among all stars () depend on these key parameters and how the simulated [N/Fe] can be determined by the parameters. The principal results are as follows:
(1) NRS can be formed in spherical stellar systems with masses of when an enough amount of AGB ejecta is accumulated within the systems so that the ISM densities can be rather high ( atom cm-3). This formation process of NRS from ISM heavily polluted by AGB ejecta is essentially the same as that of NRS within GCs (e.g., B07; D’Ercole et al. 2010). However, the required ( pc-3) for NRS formation is much lower than the typical GC density ( pc-3 for and pc or pc). Accordingly, GCs are not the only formation sites of NRS. The systems should have smaller () so that the new stars can be dominated by NRS. The [N/Fe] distributions in the new stars is quite diverse depending on the mixing processes of AGB ejecta with N-poor ISM.
(2) The total masses of NRS formed in spherical stellar systems
over Gyr timescale of star formation
can be larger than % of the total stellar masses,
if their are
larger than pc-3.
(or pc-3).
This means that the mass fractions of NRS among all stellar populations
can be significant
only in high-density galactic building
blocks, and accordingly
they are unlikely to be formed in low-mass dwarf spheroidal and elliptical
galaxies on their size-mass relation.
If the stellar initial mass function (IMF) during the formation of NRS
is top-light or steeper than that for their host stellar systems,
then the present-day mass fraction of low-mass NRS
() can be as high as or even
higher than .
(3) Star formation rates (SFRs) during the formation of NRS
are rather low ( yr-1)
in models with low .
Theoretical predictions on the relation between SFRs and the maximum
possible mass of stars ()
in star formation (W13) imply that
the IMF during the formation
of NRS can be rather top-light (; a smaller
number of massive SNe II).
Collisions of molecular clouds that can trigger massive star formation
(e.g., Fukui et al. 2017) are also unlikely to occur in gas-poor systems.
It is therefore unlikely that N-poor ejecta ([N/Fe]) from SNe II
can significantly lower [N/Fe] of ISM from where NRS can be formed, even
if ISM is polluted by such ejecta.
(4) Although NRS can be formed in gas-rich stellar systems
(), the mass fraction of NRS among new
stars is rather small () due to efficient dilution of N-rich ejecta
by a large amount of N-poor ISM.
SFRs in such gas-rich systems are rather high, and cloud-cloud
collisions that trigger massive star formation is highly likely within the systems.
Accordingly
can be also high, which ends up with a larger mass
fraction of SNe II. This implies that
ejecta with low [N/Fe] from
SNe II can significantly lower [N/Fe] of ISM in gas-rich dwarfs
with high SFRs.
Therefore, if such chemical enrichment by SNe II is included in
the present gas-rich models, then the formation of NRS should be
severely suppressed. It is thus highly unlikely that gas-rich dwarf galaxies
can have NRS.
(5) NRS can be formed within disks with
embedded in massive dark matter
halos (“in situ formation”),
and can be higher than in some models
with low .
These suggest that if the Galactic bulge was formed from an initially
thin disk through bar instability, it can have a fraction of NRS
in its inner region ( pc).
Both spherical and disky stellar systems show rather compact distributions
and rotational kinematics in NRS.
It is yet to be understood how the kinematics of NRS looks like,
if the bulge was formed from merging of such high-density stellar systems
with central NRS. Recent observational results on the kinematics
of NRS (e.g., Fernández-Trincado et al. 2019a, b;
Savino & Posti 2019) will be able to be used to
discuss this point in our future study.
(6) The present results for disky and spherical systems thus suggest
that NRS in the bulge can be formed either from their
high-density building blocks
(e.g., stellar clumps) with
or from a stellar disk: there is no need to
invoke the destruction of too many GCs ()
with the so-called “second generation” (2G) stars with high [N/Fe]
in explaining the origin of [N/Fe].
We suggest that although 2G stars in GCs can become NRS in the bulge,
the contribution of such GC destruction processes in the formation
of NRS of the bulge
can be minor.
(7) NRS observed in the Galactic halo can be formed from
the destruction of high-density
building blocks (dwarf-like galaxies)
initially with NRS. Given that the mass fraction
of NRS can be as large as 0.02,
the observed mass/number fraction of NRS in the halo can be readily explained by
the formation of the halo by merging of the building blocks.
Accordingly, the destruction of
a larger number () of GCs with
2G stars with high [N/Fe] is not required to explain
the origin of NRS in the halo.
(8) The formation processes of NRS observed
in ultra-compact dwarfs (UCDs)
and giant elliptical galaxies can be essentially the same as those
for the Galactic bulge. One of the prediction from the present model
is that NRS in the bulge, UCDs, and elliptical galaxies should
have higher . The observed He-rich stars in the Galactic bulge
(e.g., Nataf & Gould 2012) and the UV-upturn
phenomena in elliptical galaxies, which can be caused helium enhancement
(e.g., Ali et al. 2018; Goudfrooij 2018), can have the same origin as NRS.
(9) The present study did not investigate of stellar systems
in the context of the OB wind scenario, because is likely to be
very low owing to the removal of N-rich ejecta from ISM by SNe II.
However, unlike GC-forming molecular clouds,
massive building blocks of the bulge
can possibly retain N-rich ISM polluted by OB winds
under some physical conditions
(e.g., deeper gravitational potentials). Accordingly,
the OB wind scenario would also need to be investigated for the
better understanding of the origin of NRS.
6 Acknowledgment
I (Kenji Bekki; KB) am grateful to the referee for constructive and useful comments that improved this paper.
References
- (1) Ali, S. S., et al., 2018, MNRAS, 480, 2236
- (2) Athanassoula, E., et al. 2017, MNRAS, 467, L46
- (3) Barbuy, B., Chiappini, C., Gerhard, O., 2018, ARA&A, 56, 223
- (4) Bekki, K., 2011, MNRAS, 412, 2241 (B11)
- (5) Bekki, K., 2012, ApJ, 747, 78
- (6) Bekki, K., 2013, 432, 2298 (B13)
- (7) Bekki, K., 2015, MNRAS, 449, 1625
- (8) Bekki, K., 2019, A&A, 622, 53
- (9) Bekki, K.; Campbell, S. W.; Lattanzio, J. C.; Norris, J. E., 2007, MNRAS, 377, 335
- (10) Bekki, K., Chiba, M., 2007, ApJ, 665, 1164 (BC07)
- (11) Bekki, K., Tsujimoto, T., 2011, MNRAS, 416, L60
- (12) Bekki, K., Tsujimoto, T., 2012, ApJ, 761, 180
- (13) Bekki, K., Jerabkova, T., Kroupa, P., 2017, MNRAS, 471, 2242 (BJK17)
- (14) Bekki , K., Tsujimoto, T., 2019, submitted to ApJ (BT19)
- (15) Bergin, E. A., Tafalla, M., 2008, ARA&A, 2007, 45, 339
- (16) Binney, J., Tremaine, S., 1987 in Galactic Dynamics.
- (17) Brook, C. B., et al., 2004, ApJ, 61, 894
- (18) Bournaud, F., 2016, ASSL, 418, 355
- (19) Brooks, A., Christensen, C., 2016, ASSL, 418, 317
- (20) Carretta, E., Bragaglia, A., Gratton, R. G., Lucatello, S., 2009, A&A, 505, 117
- (21) Chiappini, C., etg al. 2003, MNRAS, 339, 63
- (22) Clarke, A., et al., 2019, MNRAS, 484, 3476,
- (23) Debattista, V. P., et al. 2019, MNRAS, 485, 5073
- (24) D’Ercole, A., D’Antona, F., Ventura, P., Vesperini, E., McMillan, S. L. W., 2010, MNRAS, 407, 854 (D10)
- (25) Di Matteo, P. et al. 2015, A&A, 577, 1
- (26) Elmegreen, B., et al., 2013, ApJ, 774, 86
- (27) Fernández-Trincado, J., G., et al. 2019a, in preprint, arXiv:1904.05369
- (28) Fernández-Trincado, J., G., et al. 2019b, in preprint, arXiv:1904.05370
- (29) Fishlock, C. K., et al., 2014, ApJ, 797, 44 (F14)
- (30) Forbes, D. A., et al., 2014, MNRAS, 444, 2993
- (31) Freeman, K., 1993, in Smith G. H., Brodie J. P., eds, ASP Conf. Ser.Vol. 48, The Globular Clusters-Galaxy Connection. Astron. Soc. Pac.,San Francisco, p. 608
- (32) Fukui, Y., et al. 2017, PASJ, 69, L5
- (33) Genel, S., et al. 2012, ApJ, 745, 11
- (34) Goudfrooij, P., 2018, ApJ, 857, 16
- (35) Greif, T. H., Johnson, J. L., Klessen, R. S., & Bromm, V. 2009, MNRAS, 399, 639
- (36) Grieco, V., et al., 2012, A&A, 548, 60
- (37) Hasselquist, S., et al. 2017, AJ, 845, 162
- (38) Harris, W. E., 1996, AJ, 112, 1487
- (39) Inoue, S., Saitoh, T., 2012, MNRAS, 422, 1902
- (40) Inoue, S., Yoshida, N., 2019, MNRAS, 488, 4400
- (41) Koch, A., Grebel, E. K., Martell, S. L., 2019, A&A, 625, 75
- (42) Mandelker, N., et al. 2014, MNRAS, 443, 3675
- (43) Martell, S. L., Grebel, E. K., 2010, A&A, 519, 14 (MG10)
- (44) Martinez-Valpuesta, I., Gerhard, O., 2013, ApJ, 766, L3
- (45) Matteucci, F., et al., 2019, MNRAS, 487, 5363
- (46) Maoz, D., Badenes, C., 2010, MNRAS, 407, 1314
- (47) Mckenzie, M., Bekki, K., 2018, MNRAS, 479, 3126
- (48) Nataf, D. M., Gould, A. P., 2012, ApJL, 751, L39
- (49) Navarro, J. F., Frenk, C. S., White, S. D. M., 1996, ApJ, 462, 563 (NFW)
- (50) Ness, M., et al., 2013, MNRAS, 432, 2092
- (51) Noguchi, M., 1998, Nature, 392, 253
- (52) Cote, P., et al., ApJ, 5433, 869
- (53) Tamburello, V., et al., 2015, MNRAS, 453, 2490
- (54) Salgado, C., Da Costa, G., Norris, J. E., Yong, D., 2019, MNRAS, 484, 3093
- (55) Savino, A., Posti, L., 2019, A&A, 624, L9
- (56) Schiavon, R. P., 2007, ApJS, 171, 146
- (57) Schiavon, R. P., et al., 2017, MNRAS, 465, 501
- (58) Shen, J., et al. 2010, ApJL, 720, L72
- (59) Strader, J., et al. 2013, ApJL, 775, L6
- (60) Ventura, P., et al. 2013, MNRAS, 431, 3642 (V13)
- (61) Weidner, C., Kroupa, P., Pflamm-Altenburg, J., 2013, MNRAS, 434, 84 (W13)