Structures of solid hydrogen at 300K
Abstract
We present results predicting experimentally measurable structural quantities from molecular dynamics studies of hydrogen. In doing this, we propose a paradigm shift for experimentalists – that the predictions from such calculations should be seen as the most likely hypotheses. Specifically, the experimental results should be aiming to distinguish between the candidate low-energy structures, rather than aiming to solve the simplest structure consistent with the data. We show that the room temperature X-ray diffraction patterns for hydrogen phases I, III, IV and V are very similar, with only small peaks denoting symmetry-breaking from the hcp Phase I. Because they incorporate atomic displacements the XRD patterns implied by molecular dynamics calculations are very different from those arising from the static minimum enthalpy structures found by structure searching. Simulations also show that within Phase I the molecular becomes increasingly confined to the basal plane and suggest the possibility of an unusual critical point terminating the Phase I-III boundary line.
Solid hydrogen has proved to be one of the most challenging topics in high-pressure physics, both theoretically and experimentally. At room temperature, information about the crystal structure is available largely through indirect methods such as spectroscopyGoncharov et al. (1998, 2001); Loubeyre et al. (2002); Dalladay-Simpson et al. (2016); Howie et al. (2012a); Zha et al. (2012); Howie et al. (2015); Gregoryanz et al. (2003). With the exception of two neutron diffraction studies Glazkov et al. (1988); Goncharenko and Loubeyre (2005) at 30GPa, structural studies are confined to X-ray studies Hemley et al. (1990); Loubeyre et al. (1996); Akahama et al. (2010a, b) which are largely insensitive to molecular orientation. To exploit these studies fully, it is important to have models for the crystal structure. In recent years, ab-initio structure-search methods have been highly successful at determining the possible classical ground state structuresPickard and Needs (2007, 2009); Pickard et al. (2012); Li et al. (2013); Monserrat et al. (2016). These have shown a panoply of possible phases, typically with large unit cells and low symmetry, often very close in energy.
The calculations have an unquantifiable uncertainty associated with the choice of functionalAzadi and Foulkes (2013); Clay III et al. (2014); Drummond et al. (2015); Azadi and Ackland (2017). Furthermore, the effects of quantum nuclear-motion are significant, with zero-point energy being much larger than typical energy differences between structures. So despite all this work, no consensus has emerged for the crystal structure of any high pressure phase. Nevertheless, some patterns have emerged which suggest the calculated structures are consistent with the major experimental findingsMagdău et al. (2017a).
Since the discovery of a Raman-active phonon, Phase I of hydrogen has been accepted as a hexagonal close-packed (hcp) structure of rotating molecules. On cooling at pressure, a transformation occurs to a “broken symmetry” Phase II, characterised by a discontinuous change in H2 vibron frequency and the appearance of several low-frequency modes. This transition occurs at temperatures and densities where quadrupole interactions become significant, and these are likely to be the driving force. The I-II transformation has no distinctive signature in X-ray diffraction Loubeyre et al. (1996), suggesting that it is an orientational ordering of the hydrogen molecules on the hcp lattice. Many of the most stable candidate structures from density functional theory (DFT) calculation are in this category.Pickard and Needs (2007); Geng et al. (2012)
At higher pressures, above 160GPa at low-T, pronounced weakening in vibron frequency and further changes in the low frequency spectra heralds Phase III. It is debatable whether there is any signature of this phase in X-ray diffraction: at most it is a small distortion or modulation of the hcp structure. Perhaps the most distinctive signature of Phase III is the sudden appearance of a strong infrared signal, indicating that the structure has broken inversion symmetry. At still higher pressures, darkening of the samples suggests a bandgap closure in a molecular phase, and reflectivity reveals a transition to a metallic phase, predicted by DFT to be initially molecular then a low-coordinated atomic solid. Ultimately, hydrogen will metallize and the molecular bonds will break, though it is unclear whether these processes are simultaneousHolst et al. (2008); Lorenzen et al. (2010).
At room temperature, the Phase I transforms first to phase III at around 180GPa, then to a Phase IV at around 230GPa which has not been observed at low temperature. Phase IV is characterized by the appearance of a second, (and possibly third) high frequency vibronHowie et al. (2012b, a); Zha et al. (2013); Loubeyre et al. (2013). Under further pressurization, the two vibrons remain and changes in the low frequency Raman spectra may indicate transformations to further phases IV’ and V. It is assumed that metallization will occur, but this has not been observed at room temperature.
We have spent several years making comparisons between DFT data and the spectroscopic data, using lattice dynamics and molecular dynamics, including path integral methodsMagdău and Ackland (2013); Magdău and Ackland (2014); Ackland and Magdău (2015); Howie et al. (2014); Ackland and Magdău (2014); Magdău et al. (2017a, b); Magdău and Ackland (2017). We have used different exchange-correlation functionals and different treatments of anharmonicity, and our conclusion is that these methods are not sufficiently accurate to obtain quantitative agreement for transition pressures or vibrational frequencies. Nevertheless, in this paper we will present some predictions about crystal structures which are experimentally measurable.
.1 ab initio molecular dynamics
Structure search algorithms work well for low temperature phases with harmonic phonons, but even at room temperature hydrogen is far from harmonic. Ab initio molecular dynamics (AIMD) is able to probe this region. Limitations on timescales and system sizes mean that accurate free energy calculations are impossible, however, just as with structure search, AIMD can reveal symmetry and structure of candidate phases.
Most previous AIMD was done with the PBE functional Perdew et al. (1996). However, it is now becoming obvious that this de facto standard functional has a specific failing: it overstabilizes metallic structures relative to molecular ones. This can be traced to a design feature - PBE does not reproduce the energy in the limit of large . This does not usually cause problems: when studying metallic phases, the high regime is not sampled, and in comparing molecular phases the error cancels out. It is only in the specific case of a molecule-metal transition that it becomes critical. In this work we also use the BLYP functionalLee et al. (1988); Becke (1988) which, though simple, does capture the high limit and gives a better description of H2 molecular dissociation.
.1.1 Phases
Experimentally, four numbered phases have been reported based on spectroscopy. In addition, two “primed” sub-phases have been identified, giving a sequence I-I’-III-IV-IV’-V. The broken symmetry phase II and metallic phases have been observed only at at low temperatures.
Previous MD on phases of hydrogen at 300K suggests only Phase III involves harmonic (or even anharmonic) oscillations about well-defined atomic positions: all other phases have molecular rotation, reorientation and at higher pressures significant rebonding. All of them can be characterised by molecular “motifs” located on “hexagonal close packed” lattice sites. This underlying P63/mmc space group provides the highest possible symmetry - changes to the motifs lower this symmetry.
Surprisingly, previous calculations were done in the NVT ensemble, so that the crystallographic measurable, the ratio, has not previously been calculated. For close-packing of hard spheres, the c/a ratio is . Cohesion in solid hydrogen arises primarily from van der Waals forces which drop off as . The Lennard-Jones potential captures this behavior, and stabilizes the hcp structure with .Loach and Ackland (2017)
.2 AIMD runs
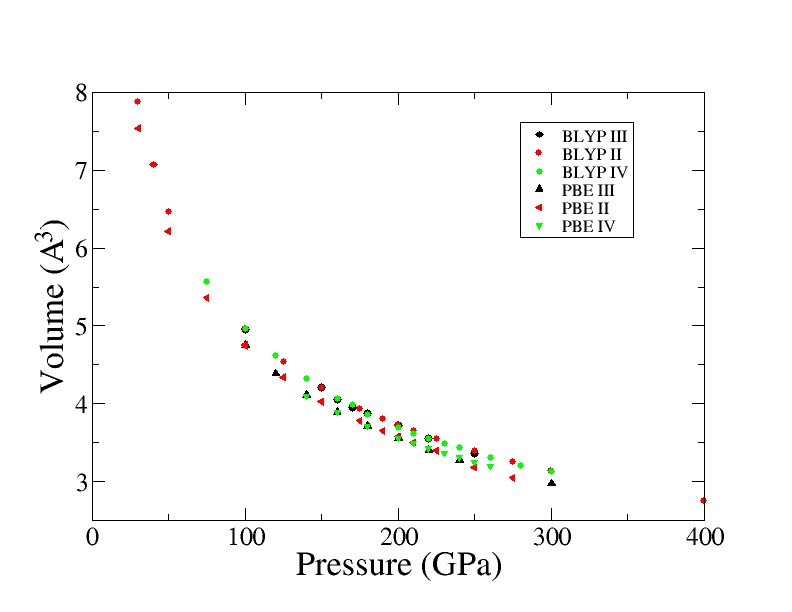
We ran a large number of molecular dynamics calculations to evaluate the various structures. The same sequence of phases are observed independent of exchange-correlation functional. Compared with PBE, the BLYP functional gives systematically higher pressures at a given density (Fig.3). It also makes better defined hydrogen molecules with higher vibrational frequencies.
Calculations were initiated from different candidate structures identified from previous Ab-Initio Random Structure Search, AIRSS, calculations for phase II, III and IV candidatesPickard and Needs (2007, 2009). None of those low-symmetry structures remained stable at 300K, all transformed to higher symmetry structures. Nevertheless, based on average molecular positions some distinct structures were observed which can be assigned to non-metallic phases I, III, IV, V plus a molecular metallic phase and atomic metal .
.2.1 Finite Size Effects
The complexity of phases III, IV and V mean that they are extremely sensitive to finite size effects. As shown in Table 1, only phases compatible with the initial conditions are observed. e.g. the phase IV candidate is hexagonal a four layer repeat with six atoms per layer - self evidently, only super-cells with multiples of 24 atoms can find this structure, while the candidate requires a multiple of six hexagonal layers.
Furthermore, there is a probability of finding a layer with incorrect stacking. This is of order , where is the excess free energy per atom in the mis-stacked layer and N the number of atoms per layer. Evidently, this goes to zero at large - mis-stackings never occur in thermodynamic equilibrium. However, in finite systems it may happen: with 12 atoms per layer, even fluctuations between and occur. We found that with less than 54 atoms per layer spurious fluctuations between types of layer at the size of the system do still occur, which gives a spuriously high mean-squared displacement.
For a simulation to even have the possibility of correctly describing Phase IV, it should accommodate both and candidates, and have layers containing a multiple of 6 atoms. To also prevent spurious fluctuations required a minimum of 648 atom (i.e. 54 atoms per layer). This cell size was used in the region of the phase transition.
Finite size effects are generally regarded as a problem, but if properly understood they can be turned to advantage. Specifically, by adjusting the cell size to be incompatible with the stable phase, we can probe metastable phases. This enables us to predict experimental signatures for all candidate phases, and thus determine whether they could be distinguished by diffraction or spectroscopy.
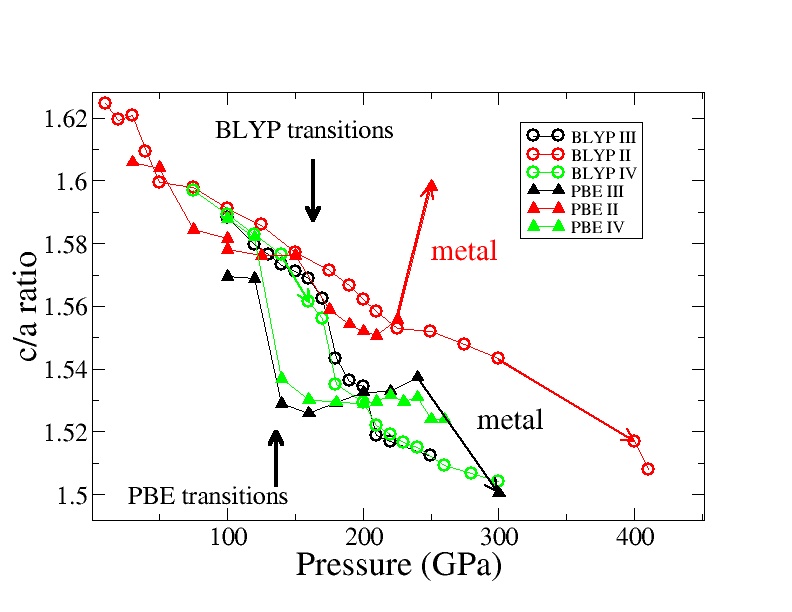
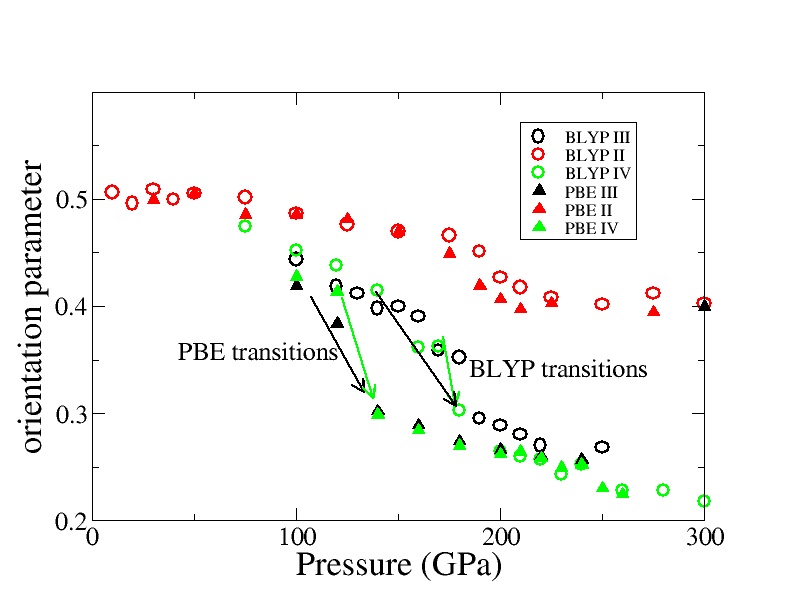
All the cells considered can transform into Phase I, which allows us to determine whether the transitions are first order. We monitor three order parameters, the density, the ratio and the angle between the molecules and the c-axis.
At the lowest pressures Phase I comprises freely rotating H2 molecules. Fig.2 shows that, as expected, at low pressures tends to the ideal ratio but gets smaller under pressure. To understand why this might be, we examined the cosine of between the molecular axis and the -axis (Fig.4). For a free rotor, this would average 0.5. This is the case at low pressure, but even within Phase I, as the pressure increases, the molecule increasingly rotates in the plane. This reduction of has been observed by X-ray differactionLoubeyre et al. (1996); Akahama et al. (2010a) at low temperature, and can now confidently be ascribed to the molecule changing from spherical to toroidal. The torus is still compatible with the P6, so this symmetry breaking of the molecule does not require a structural phase transition.
This change from spherical to torus rotation is not observed in NVT ensemble simulations with ideal , emphasizing the importance of choice of ensemble.
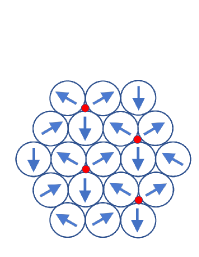
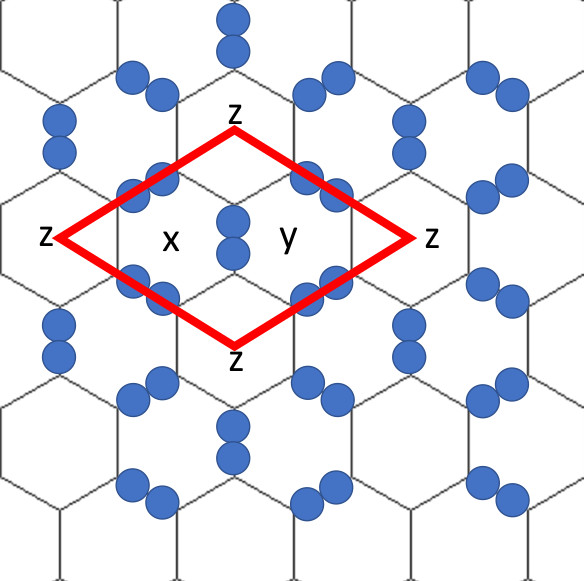
At higher pressures there is a transformation to Phase III. Structure searching has revealed a number of candidate structures which were initially described by reference to the nuclear positions as different stackings of “distorted Graphite-like layers”. However, considering the molecular (rather than atomic) positions reveals that this is just an hcp lattice with the minimum of broken symmetry required for molecular orientation (Fig.1(a). The molecular dynamics shows a similar orientational order (see Fig.1b).
To understand the highest pressure structures, fig. 5 relate the observed structures to the simple MgB2 structure with a hydrogen molecule on the Mg site (a triangular “B” layer) and hydrogen atoms on the boron sites ( a graphitic layer “G”). This structure has alternating layers, so the c-glide symmetry is broken and the space group becomes P. In the molecular dynamics, this MgB2 structure is recognised on average at very high pressures. However it is energetically highly unstable to formation of molecules: the trajectories cannot be described in terms of harmonic oscillations: the boron lattice site is not a local maximum of energy.
The structures observed for phases IV, IV’ and V are described in terms of symmetry-breaking from MgB2 so as to form molecules in the layers. There are multiple ways of doing this (Figure 5). The molecules in these layers tend to remain in plane, meaning that the c/a ratio falls further.
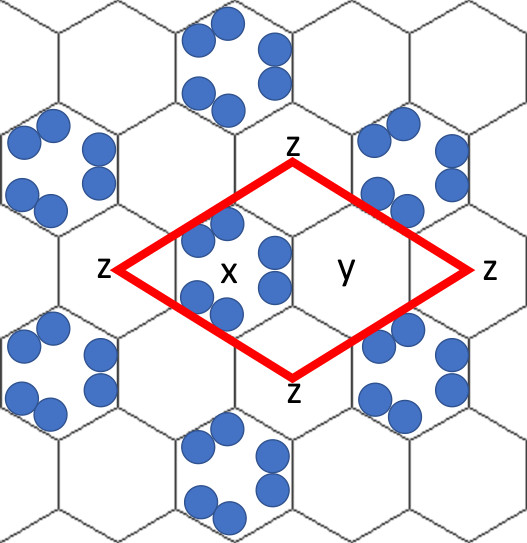
In figure 1 we show a schematic of how a layer in Phase III emerges from Phase I. The large circles represent molecular locations on a perfect close packed plane. We observe that the molecules in Phase I come to lie in the plane at high pressure. Now, assume that each in-plane molecule points towards a gap between neighbour and is not aligned with its neighbours. These two rules are sufficient to uniquely define all the molecule orientations, as shown by the arrows. Figure 1 also shows a picosecond time-average from 648-atom BLYP simulation at 180GPa, assigned Phase III. Although the non-centrosymmetric motif is clear, there are frequent local rotations and reorientations.
This ordering leads to a 3-molecule repeating cell, and spontaneously breaks inversion symmetry. This broken symmetry means that the molecule moves off the hcp site and acquires a dipole moment. This dipole moment is responsible for the strong IR signal which is a key signature of Phase III. The movement off-site might be detectable by X-ray scattering, but new peaks associated with it are weak, and it only induces a small change in relative intensity of the three main peaks compared with hcp.
Furthermore, there are two non-equivalent sites for the next layer (2/3rds unmarked, 1/3rd red circles). Consequently, a 3D unit cell must be based on (at least) two of these 3-molecule 2D layered cell The lowest energy structures identified by ab initio structure search for Phase III, C and P6122, involve a 4 and 6 layer repeat of this layer.
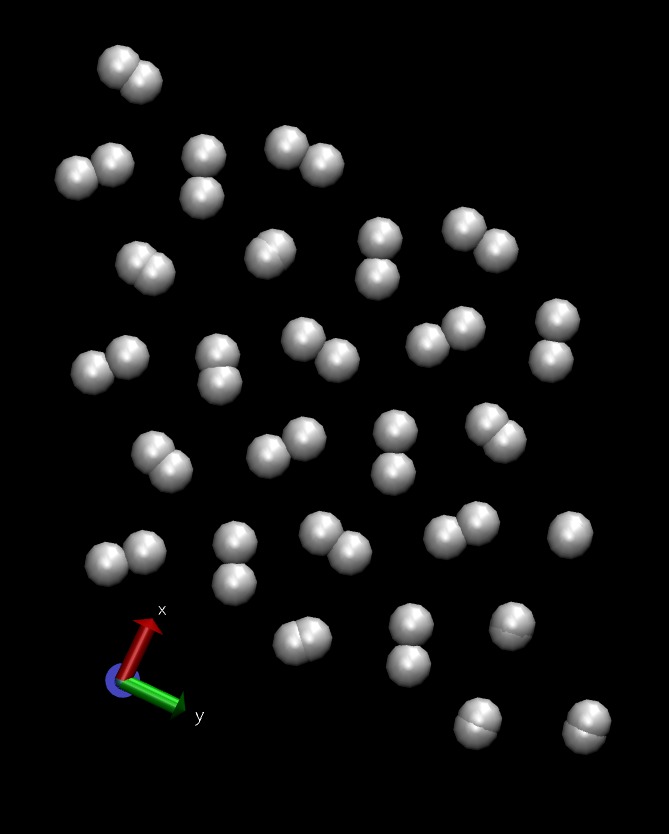
Determination of the high temperature structures was done by layer-by layer ab oculo analysis using vmd. In addition to snapshots or movies proved, two analyses proved extremely useful.
-
•
Plots of time-averaged atomic positions. The -layers image as a triangular lattice with two atoms coincident at each lattice site. The layers image as a large triangular lattice with six atoms coincident at each site. The layers typically image as separate atoms, similar to a snapshot, although after many picosecond the pattern is destroyed by diffusion within this layer.
-
•
Dot-plots for all atoms, at all times. The -layers image as spheres or small donuts, the layers image as triple-arcs or large donuts, with some evidence of six- and three-fold rotational symmetry, the layers image as separate atoms.
We carried out limited path Integral molecular dynamics, which show relatively little qualitative change from the classical picture, the main effect being a wider variation in molecular length due to zero-point energy. There is some small effect on the phase boundaries.
.2.2 Simulated Crystallography
We have calculated the diffraction pattern from the positions of the atoms from a sample of MD runs. in phases I, III, IV and V. This was done by combining the positions from the final 2ps of the MD trajectory and treating the supercell as a single cell with P1 symmetry. The resulting assemblage of approximately 50000 atomic positions thus models not only the average positions of the atoms within the structure but also the atomic displacements, including anisotropy and anharmonicity, about these average positions. The calculations were done using the GSAS-II program Toby and von Dreele (2013) and assumed a standard hydrogen form factor and an X-ray wavelength of 0.7 Å.
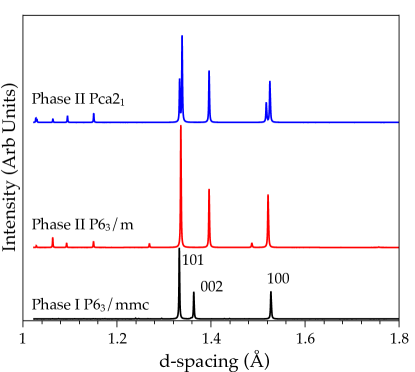
Figure 6 shows that at 140GPa, the XRD patterns for two lowest energy candidate structures for Phase II P63/m and Pca21 are similar, the distinguishing feature being a small peak splitting in Pca21 or small additional peaks in P63/m. XRD of either supercell gives 3 significant diffraction peaks, which can readily be indexed as (100) (002) and 101) from an hcp structure. In the 300K MD, simulations started in either structure transform to an identical hindered-rotor hcp Phase I.
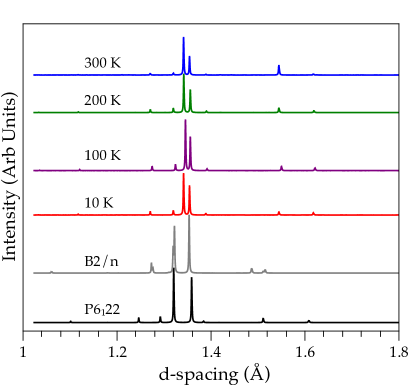
Phase III is stable at 190GPa, and Fig.7 shows that again the two zero-temperature candidate structures P and B (sometimes called by its alternative setting C) have similar 2-peak patterns, being distinguished only by weak reflections. In the MD, the two-peak pattern persists, but unusually as the temperature increases, a third small peak grows in prominence, while other small peaks vanish. On simulated cooling, the XRD pattern transforms continuously from being characteristic of phase I, to characteristic of Phase III, which is consistent with the gradual onset of short ranged orientational order.
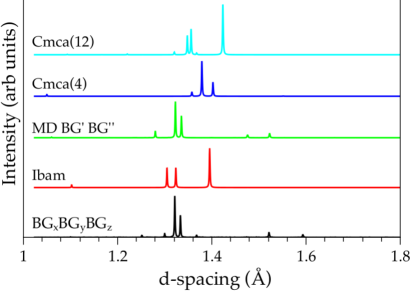
There are several candidates for Phase IV, which can be simulated separately by making supercells incompatible with the other. Fig.8 shows the calculated diffraction pattern from two of them, and again the two candidate give near identical patterns with a very close doublet and a third peak at lower angle. Ignoring the small peaks, would be possible to index these peaks to hcp, with an anomalously small ratio as shown in Fig.2. Fig.8 also shows that a very strong additional peak appears with the Ibam structure which corresponds to symmetric graphitic layers, a candidate for Phase V which is stable in MD above 400GPaMagdău and Ackland (2013); Magdău et al. (2016). This is perhaps the first phase which can be easily distinguished from hcp with XRD data.
The original 1935 prediction of metallic hydrogen by Wigner and HuntingdonWigner and Huntington (1935) is based on free electron theory, and analysis of metallic hydrogen is still based on this premiseDias et al. (2016). Since hydrogen has no core electrons, a free-electron phase of solid hydrogen would have a featureless X-ray diffraction pattern. However, calculations using DFT show that the electrons are still well localized, and X-ray diffraction from metallic hydrogen will be nearly as strong as from molecular phases111Ingo Loa, private communication.
Very recently, a report of the experiments simulated in this work has appearedJi et al. (2019). In this paper, the sharp turn of the c/a ratio at the transition from Phase I - IV at around 200GPa is observed. This is the signature of the phase transformation from hcp to a multilayer hexagonal structure, with the appearance of a second vibron. The experiment rules out any of the lower symmetry zero-temperature structures found from structure searching as being candidates for Phase IV.
Ji et al attribute their results to a P structure. This would be a unique example of an isostructural electonic transition between two non-metallic phases. We have reproduced the band structure and recalculated this structure using BLYP, find it to be energetically unstable at all pressures, as it is with PBE. The associated variation in is shown in Fig. LABEL:fig:cova and diffraction pattern in Fig.7, both are in qualitative disagreement with Ji et al’s own XRD data: in particular the c/a ratio of the proposed structure increases with pressure, whereas the XRD indicates a decrease. Furthermore, the P structure in unstable in MD, transforming spontaneously to the normal Phase I, or lower symmetry III and IV structures previously identified.
.3 Discussion and Conclusions
We have carried out extensive molecular dynamics simulations of high pressure hydrogen at room temperature using two different exchange correlation functionals. The functionals give the same sequence of phases, but with a difference of 20-30GPa in pressure. The sequence of phases, I-III-IV-V is in accordance with experiment, with the pressure calculated using in BLYP closer agreement. Molecular rotation (or disorder) increases the symmetry so that the calculated diffraction pattern for Phases III and IV is much more similar to Phase I than to their zero-temperature relaxed structures previously taken as exemplars.
Under pressure the free rotors of Phase I become more and more inhibited, with the molecules preferentially rotating in-plane. This loss of sphericity causes a drop in the c/a ratio away from ideal. In phase III, the rotation stops and the molecules lie in plane, however the diffraction pattern structure is still close to hcp with a still-lower c/a ratio. A 3% drop in the c/a ratio and change in its pressure-slope accompanies the transformation.
Our simulated XRD patterns, and the implied variation in the c/a ratio, are in excellent agreement with recent XRD data. The room temperature, high pressure phases of hydrogen can therefore confidently be ascribed to hexagonal structures with inhibited rotors, up to at least 250GPa.
GJA acknowledges the support of the European Research Council Grant Hecate Reference No. 695527
References
- Goncharov et al. (1998) A. F. Goncharov, R. J. Hemley, H.-K. Mao, and J. Shu, Phys.Rev.Letters 80, 101 (1998).
- Goncharov et al. (2001) A. F. Goncharov, E. Gregoryanz, R. J. Hemley, and H.-K. Mao, Proceedings of the National Academy of Sciences 98, 14234 (2001).
- Loubeyre et al. (2002) P. Loubeyre, F. Occelli, and R. LeToullec, Nature 416, 613 (2002).
- Dalladay-Simpson et al. (2016) P. Dalladay-Simpson, R. T. Howie, and E. Gregoryanz, Nature 529, 63 (2016).
- Howie et al. (2012a) R. T. Howie, C. L. Guillaume, T. Scheler, A. F. Goncharov, and E. Gregoryanz, Phys. Rev. Letters 108, 125501 (2012a).
- Zha et al. (2012) C. S. Zha, Z. Liu, and R. J. Hemley, Phys. Rev. Letters 108, 146402 (2012).
- Howie et al. (2015) R. T. Howie, P. Dalladay-Simpson, and E. Gregoryanz, Nature materials 14, 495 (2015).
- Gregoryanz et al. (2003) E. Gregoryanz, A. F. Goncharov, K. Matsuishi, H.-K. Mao, and R. J. Hemley, Phys.Rev.Letters 90, 175701 (2003).
- Glazkov et al. (1988) V. Glazkov, S. Besedin, I. Goncharenko, A. Irodova, I. Makarenko, V. Somenkov, S. Stishov, and S. Shilshtein, JETP Letters 47, 763 (1988), ISSN 0021-3640.
- Goncharenko and Loubeyre (2005) I. Goncharenko and P. Loubeyre, Nature 435, 1206 (2005).
- Hemley et al. (1990) R. Hemley, H. Mao, L. Finger, A. Jephcoat, R. Hazen, and C. Zha, Physical Review B 42, 6458 (1990).
- Loubeyre et al. (1996) P. Loubeyre, R. LeToullec, D. Hausermann, M. Hanfland, R. Hemley, H. Mao, and L. Finger, Nature 383, 702 (1996).
- Akahama et al. (2010a) Y. Akahama, M. Nishimura, H. Kawamura, N. Hirao, Y. Ohishi, and K. Takemura, Phys. Rev. B 82, 060101 (2010a).
- Akahama et al. (2010b) Y. Akahama, H. Kawamura, N. Hirao, Y. Ohishi, and K. Takemura, in Journal of Physics: Conference Series (IOP Publishing, 2010b), vol. 215, p. 012056.
- Pickard and Needs (2007) C. J. Pickard and R. J. Needs, Nature Physics 3, 473 (2007).
- Pickard and Needs (2009) C. J. Pickard and R. J. Needs, Physica Status Solidi (b) 246, 536 (2009).
- Pickard et al. (2012) C. J. Pickard, M. Martinez-Canales, and R. J. Needs, Phys. Rev. B 85, 214114 (2012).
- Li et al. (2013) X.-Z. Li, B. Walker, M. I. Probert, C. J. Pickard, R. J. Needs, and A. Michaelides, Journal of Physics: Condensed Matter 25, 085402 (2013).
- Monserrat et al. (2016) B. Monserrat, R. J. Needs, E. Gregoryanz, and C. J. Pickard, Physical Review B 94, 134101 (2016).
- Azadi and Foulkes (2013) S. Azadi and W. M. C. Foulkes, Phys. Rev. B 88, 014115 (2013).
- Clay III et al. (2014) R. C. Clay III, J. Mcminis, J. M. McMahon, C. Pierleoni, D. M. Ceperley, and M. A. Morales, Phys. Rev. B 89, 184106 (2014).
- Drummond et al. (2015) N. D. Drummond, B. Monserrat, J. H. Lloyd-Williams, P. L. Ríos, C. J. Pickard, and R. J. Needs, Nature communications 6 (2015).
- Azadi and Ackland (2017) S. Azadi and G. J. Ackland, Physical Chemistry Chemical Physics 19, 21829 (2017).
- Magdău et al. (2017a) I. B. Magdău, M. Marques, B. Borgulya, and G. J. Ackland, Phys.Rev.B 95, 094107 (2017a).
- Geng et al. (2012) H. Y. Geng, H. X. Song, J. Li, and Q. Wu, Journal of Applied Physics 111, 063510 (2012).
- Holst et al. (2008) B. Holst, R. Redmer, and M. P. Desjarlais, Physical Review B 77, 184201 (2008).
- Lorenzen et al. (2010) W. Lorenzen, B. Holst, and R. Redmer, Phys. Rev. B 82, 195107 (2010).
- Howie et al. (2012b) R. T. Howie, T. Scheler, C. L. Guillaume, and E. Gregoryanz, Phys. Rev. B 86, 214104 (2012b).
- Zha et al. (2013) C. S. Zha, Z. Liu, M. Ahart, R. Boehler, and R. J. Hemley, Phys.Rev.Letters 110, 217402 (2013).
- Loubeyre et al. (2013) P. Loubeyre, F. Occelli, and P. Dumas, Phys. Rev. B 87, 134101 (2013).
- Magdău and Ackland (2013) I. B. Magdău and G. J. Ackland, Phys. Rev. B 87, 174110 (2013).
- Magdău and Ackland (2014) I. Magdău and G. J. Ackland, 500, 032012 (2014).
- Ackland and Magdău (2015) G. J. Ackland and I. B. Magdău, Cogent Physics 2, 1049477 (2015).
- Howie et al. (2014) R. T. Howie, I. B. Magdău, A. F. Goncharov, G. J. Ackland, and E. Gregoryanz, Phys. Rev. Letters 113, 175501 (2014).
- Ackland and Magdău (2014) G. J. Ackland and I. B. Magdău, High Pressure Research 34, 198 (2014).
- Magdău et al. (2017b) I. B. Magdău, F. Balm, and G. J. Ackland, Journal of Physics: Conference Series 950, 042059 (2017b).
- Magdău and Ackland (2017) I. B. Magdău and G. J. Ackland, Phys. Rev. Lett. 118, 145701 (2017).
- Perdew et al. (1996) J. P. Perdew, K. Burke, and M. Ernzerhof, Phys.Rev.Letters 77, 3865 (1996).
- Lee et al. (1988) C. Lee, W. Yang, and R. G. Parr, Physical review B 37, 785 (1988).
- Becke (1988) A. D. Becke, Physical review A 38, 3098 (1988).
- Loach and Ackland (2017) C. H. Loach and G. J. Ackland, Physical review letters 119, 205701 (2017).
- Toby and von Dreele (2013) B. H. Toby and R. B. von Dreele, Journal of Applied Crystallography 46, 544 (2013).
- Magdău et al. (2016) I. B. Magdău, B. Tyson, B. Borgulya, and G. J. Ackland, writing (2016).
- Wigner and Huntington (1935) E. Wigner and H. Huntington, J. Chem. Physics 3, 764 (1935).
- Dias et al. (2016) R. P. Dias, O. Noked, and I. F. Silvera, Phys.Rev.Letters 116, 145501 (2016).
- Ji et al. (2019) C. Ji, B. Li, W. Liu, J. S. Smith, A. Majumdar, W. Luo, R. Ahuja, J. Shu, J. Wang, S. Sinogeikin, et al., Nature 573, 558 (2019).
Appendix
| BLYP | |||||
|---|---|---|---|---|---|
| Pressure | Volume | c/a | initiated | Phase | |
| 10 | 11.9804 | 1.6247 | 0.506480 | P63m | I |
| 20 | 9.1007 | 1.619415 | 0.4962698 | P63m | I |
| 30 | 7.8787 | 1.620801 | 0.508926 | P63m | I |
| 40 | 7.0702 | 1.609334 | 0.4996069 | P63m | I |
| 50 | 6.4600 | 1.599574 | 0.5051744 | P63m | I |
| 75 | 5.5644 | 1.597964 | 0.5018897 | P63m | I |
| 100 | 4.9660 | 1.591320 | 0.4865163 | P63m | I |
| 125 | 4.5356 | 1.585926 | 0.4764345 | P63m | I |
| 150 | 4.2018 | 1.577247 | 0.4698209 | P63m | I |
| 175 | 3.9393 | 1.571384 | 0.4662826 | P63m | I |
| 190 | 3.8078 | 1.566554 | 0.4507833 | P63m | I |
| 200 | 3.7320 | 1.562305 | 0.4266832 | P63m | I |
| 210 | 3.6532 | 1.558341 | 0.4177813 | P63m | I |
| 225 | 3.5491 | 1.553017 | 0.4081023 | P63m | I |
| 250 | 3.3899 | 1.552009 | 0.4016243 | P63m | I |
| 275 | 3.2574 | 1.547899 | 0.41143 | P63m | I |
| 300 | 3.1358 | 1.54326 | 0.4024638 | P63m | I |
| 400 | 2.7490 | 1.517 | 0.3613476 | P63m | Cmca |
| 410 | 2.6943 | 1.508 | 0.442654 | P63m | Cmca |
| 100 | 4.9604 | 1.5883 | 0.4439265 | P6122 | I |
| 120 | 4.6034 | 1.579752 | 0.4185463 | P6122 | I |
| 130 | 4.4539 | 1.576561 | 0.4116525 | P6122 | I |
| 140 | 4.3176 | 1.573193 | 0.397990 | P6122 | I |
| 150 | 4.1895 | 1.571013 | 0.402121 | P6122 | I |
| 160 | 4.0992 | 1.568875 | 0.3899782 | P6122 | I |
| 170 | 3.9935 | 1.562581 | 0.3584516 | P6122 | I |
| 180 | 3.8947 | 1.556153 | 0.3523557 | P6122 | III* |
| 190 | 3.7827 | 1.536208 | 0.295101 | P6122 | IV |
| 200 | 3.7258 | 1.534587 | 0.3058081 | P6122 | III |
| 210 | 3.6255 | 1.518815 | 0.2798709 | P6122 | III |
| 220 | 3.5560 | 1.516970 | 0.2702824 | P6122 | III |
| 250 | 3.3657 | 1.512323 | 0.267668 | P6122 | III |
| 180a | 3.8671 | 1.543891 | 0.3188191 | 648 P6122 | I |
| 180 | 3.8718 | 1.54544 | 648 P6122 | I | |
| 200 | 3.3657 | 1.5024375 | 0.2883576 | 648 P6122 | GxGyGz |
| 220 | 648 P6122 | GxGyGz | |||
| 075 | 5.5675 | 1.596835 | 0.4742624 | Pbcn | I |
| 100 | 4.9652 | 1.589387 | 0.4523625 | Pbcn | I |
| 120 | 4.6145 | 1.582851 | 0.4385514 | Pbcn | I |
| 140 | 4.3276 | 1.576478 | 0.418559 | Pbcn | I |
| 160 | 4.0724 | 1.561678 | 0.3615409 | Pbcn | I |
| 170 | 3.9885 | 1.556033 | 0.3630052 | Pbcn | I |
| 180 | 3.8619 | 1.535091 | 0.302474 | Pbcn | I |
| 200 | 3.6941 | 1.529361 | 0.264194 | Pbcn | IV |
| 210 | 3.6246 | 1.522132 | 0.2599856 | Pbcn | IV |
| 220 | 3.5605 | 1.519139 | 0.257028 | Pbcn | IV BG”BG” |
| 230 | 3.4960 | 1.516730 | 0.2434004 | Pbcn | IV |
| 240 | 3.4382 | 1.515042 | 0.2521973 | Pbcn | IV |
| 260 | 3.3116 | 1.509366 | 0.2279203 | Pbcn | IV |
| 280 | 3.2103 | 1.506743 | 0.2278928 | Pbcn | IV |
| 300 | 3.1251 | 1.504065 | 0.2176326 | Pbcn | IV |