Measurement of the Reactor Antineutrino Spectrum from 235U Fission using PROSPECT
Pranava Teja Surukuchi
(for the PROSPECT Collaboration)
Wright Laboratory, Yale University, New Haven CT - 06511, USA
Abstract: PROSPECT is a short-baseline reactor antineutrino experiment designed to search for short-baseline sterile neutrino oscillations and perform a precise measurement of 235U reactor antineutrino spectrum from the High Flux Isotope Reactor at Oak Ridge National Laboratory. This measurement probes our understanding of recent anomalous results observed in reactor antineutrinos. PROSPECT uses a 4-ton optically segmented, 6Li-loaded liquid scintillator detector with high light yield, world-leading energy resolution, and excellent pulse shape discrimination. The latest antineutrino spectrum measurement results from 235U fissions at HFIR are reported.
Talk presented at the 2019 Meeting of the Division of Particles and Fields of the American Physical Society (DPF2019), July 29–August 2, 2019, Northeastern University, Boston, C1907293.
1 Introduction
In the last decade, there has been a resurgence in short baseline experiments motivated by the discrepancies between predictions and experimental measurements [1, 2]. The average flux measured by the reactor experiments are lower by 6% compared to the predictions. This flux anomaly [3] could be due to incorrect flux predictions or due to the existence of an additional sterile neutrino state at 1eV2. Precision reactor neutrino experiments Daya Bay, Double CHOOZ, and RENO [4, 5, 6] built to measure have also noticed deviations from the predictions in the shape of the spectrum primarily in 5-7 MeV neutrino energy region. This anomaly cannot be explained by a sterile neutrino but rather points to inaccuracies in spectrum predictions arising from mistakes in databases or errors made in conversion process. All the experiments that have measured the spectral deviations have sampled the from a Low Enriched Uranium (LEU) reactors which generates the s from four primary isotopes namely 235U, 238U, 239Pu, and 241Pu. By measuring the spectrum from a Highly Enriched Uranium (HEU) nuclear reactor where the are primarily sampled from a single isotope the isotopic source of discrepancy can be experimentally disentangled.
2 PROSPECT Experiment
PROSPECT is an experiment designed with the primary goals to search for oscillation suggested by the flux anomaly and precisely measure 235U spectrum to address the spectrum anomaly [7]. The source of for PROSPECT is the High Flux Isotope Reactor, an HEU research reactor located at Oak Ridge National Laboratory. The combination of HEU fuel and the short reactor cycles constrains the contribution of reactor from 235U to greater than 99% throughout the reactor cycle.
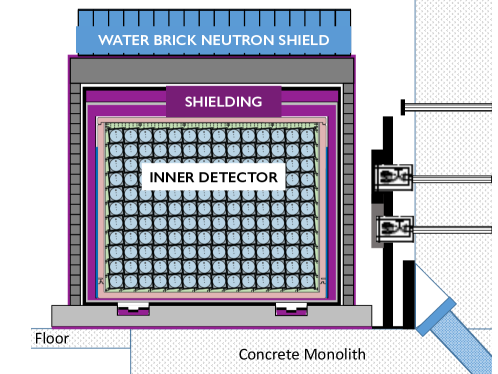
The PROSPECT Antineutrino Detector (AD) is an optically segmented detector with 6Li-loaded liquid scintillator (LiLS) as the target for Inverse Beta Decay (IBD) interaction [7]. The segmentation of the detector is achieved by the use of custom-designed optical separators [8] which guide the scintillation light to be collected by the PMTs placed at either ends of a segment. Consisting of a total of 11x14 segments (154) with each individual segment 119 cm long and a cross-section of 14.6 cm x 14.6 cm, segmentation provides a capability to deploy sources within the detector.
PROSPECT AD is located at a closest distance of 7m to the reactor enabling a high statistics measurement and the ability to search for high-frequency oscillations, but it also poses a challenge of high reactor-related and cosmogenic backgrounds. The PROSPECT collaboration has done extensive background characterization [9] of the reactor site and has developed several active and passive background rejection techniques to mitigate backgrounds. The primary source of IBD-mimicking backgrounds – cosmogenic fast neutrons interacting with detector and surrounding materials – are reduced by the use of an optimized top-heavy shielding package consisting of water bricks, borated polyethylene, and lead. The high rates of primarily -backgrounds from reactors are reduced passively by the use of a purpose-built lead wall. The segmentation of the detector provides 3D-event reconstruction capability which in turn provides a way to apply topological and fiducialization cuts. The liquid scintillator used in PROSPECT, EJ-309 is PSD-capable and provides the ability to separate electron-recoils from nuclear-recoils which is leveraged to reject correlated multi-neutron events as well as uncorrelated gamma coincidences.
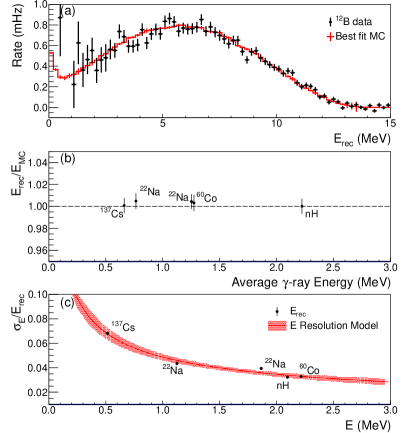
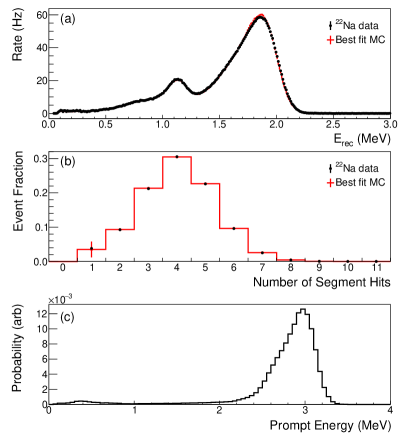
The calibration and energy reconstruction of the PROSPECT detector is done in multiple steps. The integral of waveforms collected by the PMTs are converted to position-corrected energy. The relative energy scale between segments are constrained by 6Li capture peak which has small spatial and temporal energy deposition while the absolute energy scale is defined based on the fits performed on the calibration data to Monte-Carlo simulations. The calibration of the detector is done by using the deployed -calibration sources 22Na, 60Co, and 137Cs; ambient 2.2 MeV s from neutron capture on hydrogen and spectrum from cosmogenic neutron-capture on 12C by 12C(n,p)12B and subsequent beta decay of 12B. The full-detector energy spectra from these sources and the segment multiplicity of the 22Na are simultaneously fit to PROSPECT Geant4-based Monte Carlo simulations (PG4) of the respective source spectra and multiplicity distributions. The fits are performed by varying absolute energy scale, Birks parameter, Cherenkov parameter and energy resolution. Figure 2 shows the agreement between the calibration data and PG4 simulations.
3 Spectrum Measurement
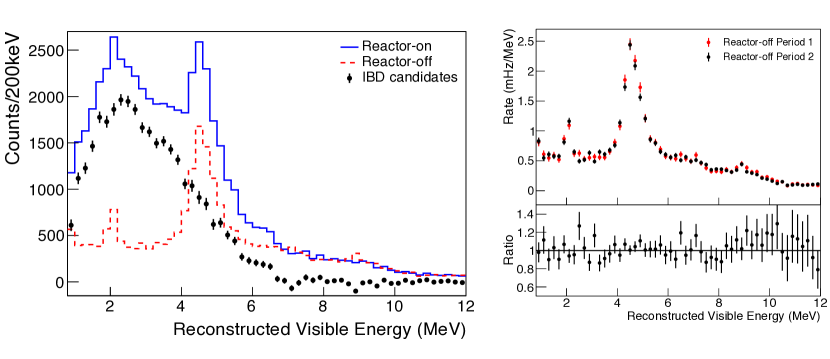
For this analysis two interleaved datasets of reactor on (off) periods are used summing to a total of 40.3 (37.8) days of exposure respectively [10]. After applying analysis cuts, this dataset corresponds to a total of 70811 267 (20036 145) correlated reactor on (off) events, 20534 16 (1436 4) reactor on (off) accidental events resulting in 31678 304 events after atmospheric pressure-corrected background subtraction with a signal-to-background of 1.7:1. Fig. 3 shows the correlated reactor on, off, and IBD spectrum as well as reactor off correlated rates for two distinct data periods.
A quantitative comparison between the measured spectrum and the Huber model is done by the use of a test-statistic defined by
| (1) |
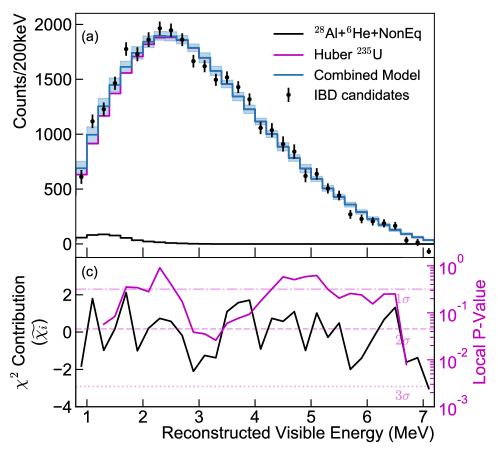
where is the difference between measured and predicted neutrino counts in bin and V incorporates signal and background statistical and systematic uncertainties and their bin-to-bin correlations. To construct the predicted rates the Huber neutrino spectrum is added to the non-fission isotope contributions from the beta decays of 28Al and 6He and contributions from the non-eq isotopes [11]. This summed neutrino energy spectrum is then passed through the PG4-generated detector response model to obtain the predicted prompt energy spectrum. The is minimized over a free-floating nuisance parameter is incorporated into the predicted neutrino counts corresponding to the overall measured neutrino count effectively yielding a shape-only fit.
The predicted and measured reconstructed energy spectra are shown in the Fig. 4. The shape-only fit yields a /NDF of 51.4/31 and demonstrates an overall bad fit with a one-side p-value of 0.01. The bottom panel of the figure shows a signed test-statistic defined by
| (2) |
where the is the value calculated from Eq. 1 and is calculated by incorporating an additional free-floating nuisance parameter corresponding to the content in the bin. This metric which shows the bin-to-bin significance of deviation displays no notable deviations except for the final bin. Another procedure called sliding window test following the methodology employed in Ref. [4] is performed by letting consecutive bins over a region of 1 MeV be free-floating. The results displayed in Fig. 4 shows two regions over the energy range that disagree with the Huber model at more than 2.
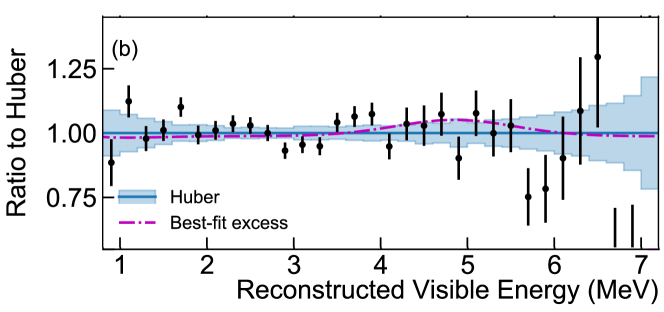
An ad-hoc model is constructed by fitting the difference between Daya Bay measured spectrum and Huber-Mueller models to a Gaussian to test if the LEU fluctuations in 5-7 MeV region originate from 235U. The mean and sigma from the fit is then added to PROSPECT data and a as defined in Eq. 1 is calculated for varying values of normalization . A fit with a normalization corresponds to the Daya Bay size local deviation while corresponds to the Huber model. PROSPECT data agrees with both the models with the best-fit normalization found at 0.69 0.53 as shown in Fig. 5. A fit with a normalization of corresponding to 235U being solely responsible for the Daya Bay local deviation is disfavoured at 2.1.
4 Conclusions
PROSPECT built an on-surface detector close to a reactor and performed the first modern measurement of high-statistics antineutrino spectrum from an HEU reactor with a S:B of 1.7:1. A shape-only comparison between PROSPECT data and Huber model has a /NDF exhibiting a poor overall fit. With the current statistics-limited data an ad-hoc model corresponding to the local deviation at 5-7 MeV arising purely from 235U is disfavored at 2.1.
Acknowledgements
This material is based upon work supported by the U.S. Department of Energy Office of Science and the Heising-Simons Foundation. Additional support is provided by Illinois Institute of Technology, LLNL, NIST, ORNL, Temple University, and Yale University. We gratefully acknowledge the support and hospitality of the High Flux Isotope Reactor, managed by UT-Battelle for the U.S. Department of Energy.
References
- [1] Th. A. Mueller et al. Improved Predictions of Reactor Antineutrino Spectra. Phys. Rev., C83:054615, 2011.
- [2] Patrick Huber. On the determination of anti-neutrino spectra from nuclear reactors. Phys. Rev., C84:024617, 2011. [Erratum: Phys. Rev.C85,029901(2012)].
- [3] G. Mention et al. The Reactor Antineutrino Anomaly. Phys. Rev., D83:073006, 2011.
- [4] Feng Peng An et al. Improved Measurement of the Reactor Antineutrino Flux and Spectrum at Daya Bay. Chin. Phys., C41(1):013002, 2017.
- [5] Thamys Abrahão et al. Reactor spectral rate and shape measurement in double chooz detectors. Journal of Physics: Conference Series, 888:012134, sep 2017.
- [6] JH Choi et al. Observation of energy and baseline dependent reactor antineutrino disappearance in the reno experiment. Physical review letters, 116(21):211801, 2016.
- [7] J. Ashenfelter et al. The PROSPECT Reactor Antineutrino Experiment. arXiv, 2018.
- [8] J. Ashenfelter et al. A Low Mass Optical Grid for the PROSPECT Reactor Antineutrino Detector. 2019.
- [9] J. Ashenfelter et al. Background Radiation Measurements at High Power Research Reactors. Nucl. Instrum. Meth., A806:401–419, 2016.
- [10] J. Ashenfelter et al. Measurement of the Antineutrino Spectrum from 235U Fission at HFIR with PROSPECT. 2018.
- [11] Andrew James Conant. Antineutrino Spectrum Characterization at the High Flux Isotope Reactor Using Neutronic Simulations. PhD thesis, Georgia Institute of Technology, 2019.