A year-long plateau in the late-time near-infrared light curves of Type Ia supernovae
Abstract
The light curves of Type Ia supernovae are routinely used to constrain cosmology models. Driven by radioactive decay of 56Ni, the light curves steadily decline over time, but days past explosion, the near-infrared portion is poorly characterized. We report a year-long plateau in the near-infrared light curve at 150–500 days, followed by a second decline phase accompanied by a possible appearance of [Fe I] emission lines. This near-infrared plateau contrasts sharply with Type IIP plateaus and requires a new physical mechanism. We suggest a such as masking of the “near-infrared catastrophe,” a predicted yet unobserved sharp light-curve decline, by scattering of ultraviolet photons to longer wavelengths. The transition off the plateau could be due to a change in the dominant ionization state of the supernova ejecta. Our results shed new light on the complex radiative transfer processes that take place in Type Ia supernovae and enhance their use as “standard candles.”
1 Introduction
The optical and near-infrared (NIR) light we receive from Type Ia supernovae (SNe Ia) at early times is a product of the radioactive decay chain 56NiCoFe. This decay chain proceeds through inverse decay, i.e., electron capture or positron emission. At each step, the daughter nucleus de-excites down to the ground state by emitting high-energy rays. Together with positrons emitted by the inverse decay process, these rays are then thermalized by the expanding SN ejecta and downconverted to optical and NIR photons (Truran et al., 1967; Colgate & McKee, 1969; Arnett, 1982).
This picture was known to hold out to days past maximum light, at which point it was predicted that the cooling of the ejecta would transition from collisionally-excited emission lines in the optical and NIR to fine-structure iron lines in the mid and far IR (Axelrod, 1980). This transition was supposed to manifest in a sharp decline in the optical and NIR light. To date, this so-called “IR catastrophe” has not been observed in the optical. In fact, several recent studies have shown that the decline of the optical light curves begins to slow down at days (Cappellaro et al., 1997; Leloudas et al., 2009; Fransson & Jerkstrand, 2015; Graur et al., 2016, 2018b, 2018a; Graur, 2019; Shappee et al., 2017; Yang et al., 2018; Dimitriadis et al., 2017; Kerzendorf et al., 2017; Li et al., 2019).
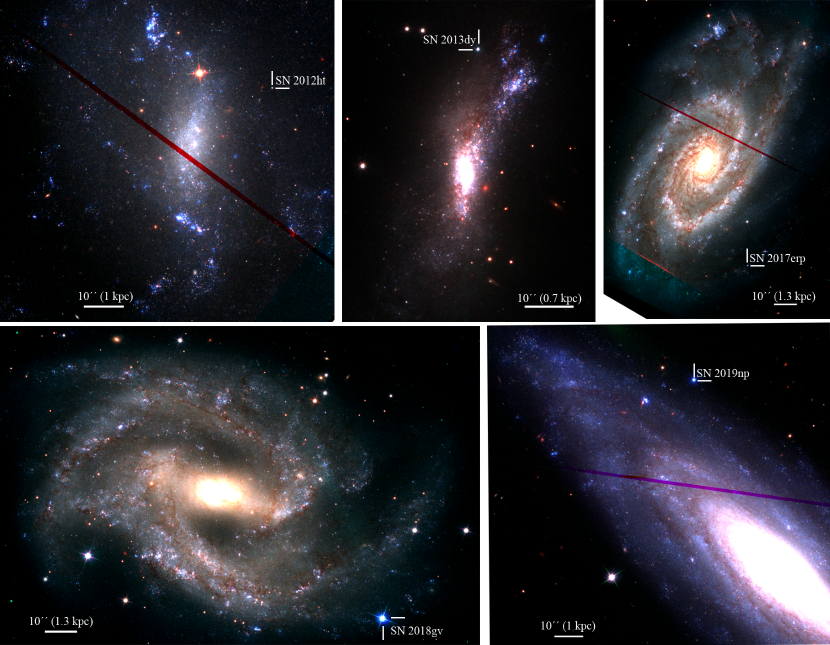
Here, we report observations of five nearby SNe Ia (SNe 2012ht, 2013dy, 2017erp, 2018gv, and 2019np) with the Hubble Space Telescope (HST) Wide-Field Camera 3 (WFC3) in the optical F350LP, F555W, and F814W filters and the NIR F160W filter (presented in Supplementary Table 1). We also present NIR spectra of SN 2017erp, including an HST grism spectrum at days past -band maximum light (from here on out, all SN phases will be reported in relation to -band maximum light). Figure 1 shows composite color images of the SNe and their locations within their host galaxies.
Instead of a steep drop in the NIR light curves, as predicted by the “IR catastrophe,” we report a year-long plateau in the and bands that sets in at days and lasts until – days. After the plateau, the SNe transition into a new phase during which the -band light curve declines at the same rate as the optical light curve, consistent with the continued radioactive decay of 56CoFe.
The occurrence of a plateau in the NIR light curve is intriguing, since to date only one type of SN—the hydrogen-rich SNe IIP—have been known to exhibit a plateau. In SNe IIP, the plateau sets in shortly after peak, lasts days, and is due to the cooling of the shock-heated ejecta and recombination of hydrogen (Chevalier, 1976). Since the vast majority of SNe Ia, by definition, lack hydrogen, the NIR plateau reported here must be the result of a different physical process.
2 Results
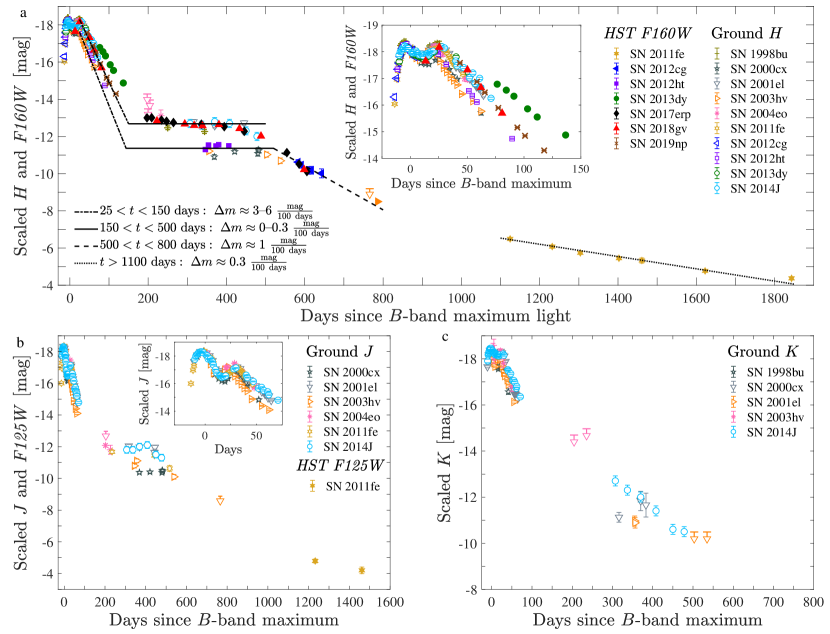
In Figure 2, we combine our F160W measurements with HST F160W and ground-based -band observations of the SNe in our sample as well as several SNe Ia from the literature (Leloudas et al., 2009; Graur et al., 2016; Shappee et al., 2017; Candia et al., 2003; Krisciunas et al., 2003; Sollerman et al., 2004; Stritzinger & Sollerman, 2007; Pastorello et al., 2007; Matheson et al., 2012; Pan et al., 2015; Marion et al., 2016; Sand et al., 2016; Burns et al., 2018). We also show literature - and -band data, where available, for the same SNe. Finally, we add synthetic photometry of SN 2014J, derived from NIR spectra Diamond et al. (2018); Dhawan et al. (2018), in , , and (presented in Supplementary Table 2).
Our synthesis reveals that the “IR catastrophe” does not manifest in the NIR. Moreover, we report the discovery of a plateau in the band. Hints of this plateau were noted in sparse observations of SNe 1998bu, 2000cx and 2001el but were not explored further (Sollerman et al., 2004; Stritzinger & Sollerman, 2007; Spyromilio et al., 2004). Here, we show that this plateau sets in at days and lasts for – days. While - and F160W-band measurements of SNe 2000cx, 2001el, and 2012ht show a flat light curve during discrete portions of this phase range, F160W measurements of SNe 2017erp and 2018gv, which span the entire phase range from 150 to 500 days, show that the SNe decline by during this time.
The -band plateau is also apparent in the band. Although in this filter we can only compare ground-based data from five SNe from the literature and synthetic photometry of SN 2014J, it seems that the -band plateau is similar to the one observed in the band: it sets in at roughly days and also ends at – days.
Most of the literature SNe were not followed long enough in the band to probe the – day range of the plateau. However, our synthetic -band photometry of SN 2014J show no evidence of a plateau in this band. Instead, the SN declines at a rate of , which is consistent with the decline rate in the optical at the same time (, based on data from ref. Graur (2019)).
In both and , the plateau spans a range of mag, i.e., a factor of 6 in flux. It is instructive that in both filters, the plateau sets in at days, even though the SNe had different decline rates in these bands prior to the plateau setting in. At the start of the -band plateau, the SNe have declined by 6–8 mag since peak, while in the band, they have declined by 5–7 mag. Together with the range of brightnesses the SNe exhibit while on the plateau, this means that the onset of the plateau is probably tied to the age of the SNe and not to other factors, such as their intrinsic brightness.
SNe Ia with higher intrinsic brightnesses and shallower decline rates (parameterized by their values and decline rates in the range – days, ) have a higher average brightness, , during the plateau phase than SNe with steeper light curves. Limited by a small number of events in the late-time SN Ia photometry sample, it is unclear whether this correlation divides the sample into two distinct populations or whether there is a continuous distribution in .
In Figure 3, we show that is correlated with (and perhaps driven by) at a confidence level (Pearson’s , ). A linear fit to the data gives . , in turn, is correlated with the intrinsic brightness of SNe Ia, often parameterized by , the number of magnitudes the SN has declined 15 days after reaching peak in the band. Using a control sample of normal, low-redshift SNe Ia Avelino et al. (2019), we show that the two parameters are correlated at a confidence level (, ). The strength of this correlation drops to (, ) if we remove the five SNe with (SNe 2006D, 2006le, 2006lf, 2007st, and 2008hs). Fitting the low-redshift supernova sample, this correlation can be expressed with the linear fit . Based on this correlation, we would have expected SNe 2000cx (2004eo) to have lower (higher) values than the ones we measure; these peculiar SNe might not be subject to the same correlations as normal SNe Ia Pastorello et al. (2007); Li et al. (2001).
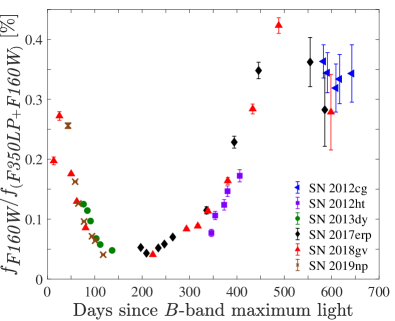
At – days (400 days for the SNe Ia on the upper, brighter , branch and 500 days for the SNe Ia on the lower branch), the SNe leave the plateau and enter a second decline phase. When taken together, the photometry of SNe 2003hv, 2012cg, and 2017erp yields a linear decline rate of , which is broadly consistent with the decline rate of expected from the radioactive decay of 56CoFe, with a half-life of . This is consistent with the optical component of the light curve, which has also been shown to decline in a manner consistent with the radioactive decay of 56Co during this time. To illustrate this similarity, we plot the fraction of NIR flux out of the combined optical+NIR flux (i.e., the combination of flux from the broad F350LP optical filter and the NIR F160W filter). Figure 4 shows that, during the plateau, while the SNe continue to fade in the optical, the fraction of light emitted in the NIR steadily increases to %. Once the SNe transition off the plateau, this fraction remains constant.
Individually, SNe 2003hv, 2012cg, and 2017erp have different decline rates after the plateau phase: , , and , respectively. A larger sample of SNe is required to ascertain whether these differences are due to shot noise or to an intrinsic dispersion of decline rates, such as the dispersion in shown in Figure 3.
After a gap in the NIR measurements between 800 and 1100 days, the only - and -band measurements at days come from SN 2011fe, which was observed in F125W at – days (Kerzendorf et al., 2017) and in F160W at – days (Shappee et al., 2017). Unfortunately, SN 2011fe was only observed sparsely along the plateau in the band, with no similar -band observations. Moreover, it was not observed at all in the band. Yet the available data are instructive, as they show that the late-time light curve of SN 2011fe slows down in the NIR and proceeds to decline at the same rate () as in the optical (, , and in F438W, F555W, and F600LP, respectively, based on data from ref. Shappee et al. (2017)).
Along with the HST imaging, we have also acquired ground-based NIR spectra of SN 2017erp during the plateau phase as well as a HST G141 grism spectrum at 605 days. In Figure 5, we compare the spectra and identify iron-group emission lines that could produce the observed emission features in the spectra. Although we label the features with neutral, singly- and doubly-ionized elements, previous works have shown that toward the end of the plateau, the doubly-ionized lines fade away and the emission features are dominated by singly-ionized lines Diamond et al. (2018); Dhawan et al. (2018); Maguire et al. (2018). We identify emission features at – and –m that, from among the iron-group elements, can be associated with [Fe I]. We find this identification plausible.
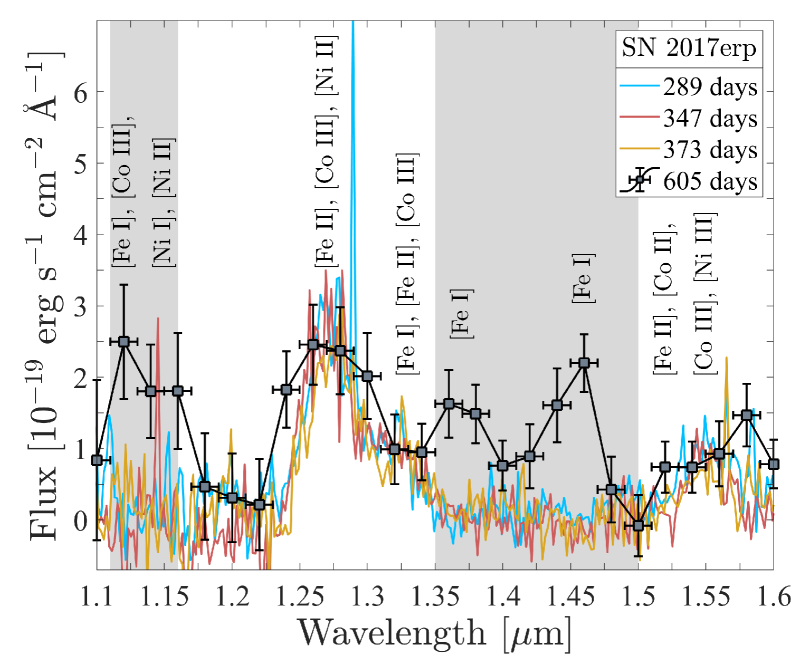
The emission features at – and –m fall within atmospheric absorption bands, which could explain why they were not detected in ground-based spectra at earlier phases. However, the appearance of [Fe I] lines in the NIR should be accompanied by similar lines in the optical (two features at and m in optical spectra of SN 2011fe obtained at 981 and 1034 days have been attributed to [Fe I] but could also be due to other elements, such as hydrogen, oxygen, and calcium; Graham et al. (2015); Taubenberger et al. (2015)) and mid-IR (e.g,, at m), which would be visible with the James Webb Space Telescope.
We leave a detailed modeling of the spectrum to a future paper. If real, the appearance of [Fe I] emission features as strong as the previously dominant [Fe II] feature at m, following the shift in dominance from [Fe III] to [Fe II] along the plateau, would indicate that the transition from the plateau to the second decline phase could be the result of redistribution of the NIR emission to different wavelengths. This could be due to a change in the dominant ionization state of the atoms responsible for the cooling of the ejecta.
2.1 Explaining the NIR plateau
We next review several possible explanations for the occurrence of the NIR plateau.
Light echoes, which are created when light from the SN is scattered by a distant dust sheet toward Earth, have been shown to flatten the light curves of SNe Ia (Patat, 2005; Patat et al., 2006; Rest et al., 2012). For several reasons, we can reject this scenario. First, of the full SN sample shown in Figure 2, only SN 1998bu is known to have a light echo (Cappellaro et al., 2001), and the effects of that echo have been removed from the photometry presented here (Spyromilio et al., 2004). Second, a light echo causes a blueward shift in the light of the SN, which is inconsistent with the reddening of the light curve seen here during the plateau phase. Third, a light echo explanation is inconsistent with the transition of the NIR light curve from the plateau onto the second decline phase at days. Finally, a light echo should have impacted the optical portion of the light curve, which in our data remains unperturbed.
We also rule out the effect of dust formed by the SNe. While such dust could conceivably produce an increase in the NIR flux, both dust-formation simulations and observations of SN remnants imply that SNe Ia do not produce substantial () amounts of dust (Borkowski et al., 2006; Gomez et al., 2012), though simulations in which CO and SiO molecules do not form in the ejecta can lead to dust masses as high as Nozawa et al. (2011). Observations of SN Ia remnants such as Kepler or Tycho are consistent with the majority of the warm dust being swept up from the circumstellar or interstellar medium Douvion et al. (2001); Williams et al. (2012). However, at the epochs of our observations, the amount of swept-up dust will be negligible. Furthermore, we would have expected the optical light curves to suffer from dust extinction and change slope during the NIR plateau phase. While such an effect has been observed in some core-collapse SNe (Mattila et al., 2008; Anupama et al., 2009), it is not supported by the observations presented here. Finally, the flux density of newly formed dust is expected to be higher in than in or Nozawa et al. (2011), contrary to the observations shown in Figure 2.
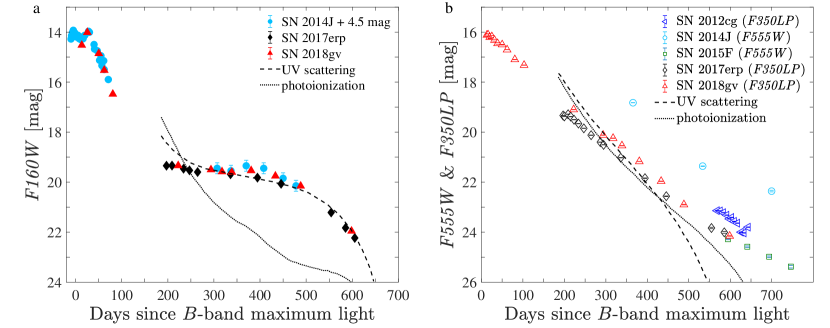
A potential theoretical explanation for the NIR plateau emerges from several works that have attempted to resolve the conflict between the IR catastrophe, which arises from theoretical modeling of the cooling of the SN ejecta, and the nebular-phase light curves and spectra. In Figure 6, we compare our NIR and optical observations with the only currently available late-time NIR light curve models. Originally compared to the nebular-phase photometry of SN 2000cx (Sollerman et al., 2004), these models were designed to test whether photons emitted in the UV led to high-energy photoionization lines or whether the UV photons were scattered by the many overlapping lines in the UV and shifted to longer wavelengths. These options were tested by turning photoionization on or off in the emission model. In Figure 6, we find that the model that assumes UV scattering is in excellent agreement with our late-time F160W photometry, and even predicts the transition from the plateau phase to the second decline phase at days. According to this model, the plateau in the NIR is due to optical iron-line emission being shifted into the NIR [Fe II] lines. However, this should then lead to a steeper decline in the optical light curves, which is inconsistent with our observations as well as other optical observations from the literature.
A possible solution to the lack of change in the slope of the optical light curve included the effects of non-local radiative transfer (Fransson & Jerkstrand, 2015). The updated model, which was compared to an optical spectrum of SN 2011fe taken at 1034 days after the explosion (Taubenberger et al., 2015), found that without non-local radiative transfer, only of the energy deposited into the ejecta emerged in the optical and NIR, while emerged in the UV and the rest in the mid-IR. The addition of non-local radiative transfer converted most of the UV light into the optical and NIR, thus correcting for the decline in the optical light curve predicted by the IR catastrophe.
Unfortunately, ref. Fransson & Jerkstrand (2015) did not show the effects of the updated emission model on the NIR light curve. Thus, it remains to be seen whether an emission model that includes both UV scattering and non-local radiative transfer can reproduce both the NIR plateau and the concomitantly constantly-declining optical light curve.
The explanation for the occurrence of the NIR plateau offered by UV scattering is reminiscent of the explanation put forth for the occurrence of the second NIR peak at – days Kasen (2006). As the ejecta cool, a “recombination wave” from doubly- to singly-ionized iron-group elements seemingly propagates inwards through the ejecta towards the iron-rich core. This “wave” is the result of two competing factors: the outer part of the ejecta expands more than the inner part and so is cooler at any given time, but the inner part is denser; thus, recombination is faster and occurs at higher temperatures. The low ionization state, iron-rich gas in the core has a very high opacity to UV photons due to line-blocking from atomic resonance transitions, which leads to a redistribution of radiation from the UV to the NIR via fluorescence Pinto & Eastman (2000); Höflich (1995). This explanation is consistent with the observed transition from doubly- to singly-ionized forbidden lines along the plateau as well as the appearance of neutral [Fe I] lines—signaling a shift from recombination to —once the plateau ends. Thus, the plateau phase at 150–500 days can be thought of as an additional, drawn-out peak in the NIR light curve.
The fluorescence mechanism considered above also produces correlations between the brightness and timing of the second NIR peak and the mass of 56Ni created during the explosion (which is responsible for the overall luminosity of the SN, often parameterized by Nugent et al. (1995)). Applying the fluorescence explanation to the NIR plateau thus naturally explains the correlations shown in Figure 3: SNe Ia that produce larger amounts of 56Ni are hotter and have larger iron cores, which together lead to a later development of the recombination wave along with a larger, more luminous fluorescent shell. This creates a delayed, brighter second NIR peak. Similarly, these SNe Ia would then be expected to have brighter plateaus, as seen in our data. It remains to be seen whether a larger sample of SNe observed along the plateau would also reveal a difference in the timing of its onset and demise, as might be expected from this model.
3 Discussion
We have presented late-time HST imaging of five SNe Ia out to 605 days past -band maximum light. We report a year-long plateau in the - and -band light curves that spans – days. This plateau, together with the concomitantly constant decline rate of the optical light curve, are consistent with a masking of the infrared catastrophe in the optical and NIR by scattering of UV photons to longer wavelengths. Further observations are required to establish the correlation shown here between the intrinsic luminosity of the SNe and their average -band magnitudes on the plateau, and to fill in the 150–500 day period in the band, where synthetic photometry of SN 2014J implies a decline rate similar to the optical. We also present a NIR spectrum of SN 2017erp at days, in which we report tentative identifications of [Fe I] emission features. A detailed modeling of the spectrum and a larger sample of NIR spectra taken at days, together with optical and mid-IR spectra, is necessary to validate these features, which hint that the end of the plateau phase coincides with a shift in the dominant ionization state of the SN ejecta.
Our discovery and characterization of the NIR plateau and second decline phase shed new light on the complex radiative transfer processes that take place in SNe Ia. The data presented here will also assist in the use of SNe Ia as standard candles. Recent work has shown that SNe Ia are most standard in the NIR, and especially in the band. Our results indicate that NIR cosmology surveys (e.g., ref. Avelino et al. (2019)) may best be served by obtaining template images of their SNe after they have fallen off the plateau and by taking into account the mag spread in brightness along the plateau and its correlation with the intrinsic brightness of the SNe.
4 Methods
4.1 Imaging
We imaged SNe 2012ht, 2013dy, 2017erp, 2018gv, and 2019np with HST/WFC3 in the F350LP, F555W, F814W, and F160W filters through programs GO–12880, 15145, 15640, 15686, and 15693. We used the Tweakreg and AstroDrizzle tasks included in the DrizzlePac Python package (Hack et al., 2012) to align the HST images and remove cosmic rays and bad pixels.
Next, we performed point-spread-function (PSF) fitting photometry using Dolphot (Dolphin, 2000). For the optical images, we used the flc files produced by the HST WFC3 pipeline, which are corrected for charge transfer efficiency effects; for the NIR F160W images, we used the flt files, since the IR channel of WFC3 does not suffer from charge transfer effects.
Because GO–12880, 15145, and 15640 were designed not to observe the SNe but to discover variable stars in the host galaxies, Dolphot reported the SNe as saturated in many of the optical images. Though some of the pixels at the location of the SN are saturated, most of the PSF is intact and can be sampled with aperture photometry. The resultant photometry will be fainter than the true values, but not by a wide margin. Thus, in order to estimate the brightness of the SNe in the saturated optical visits, we also performed aperture photometry with a aperture. For the latter, we applied the latest aperture corrections Deustua et al. (2016). On average, the PSF-fitting photometry is systematically brighter than the aperture photometry by mag. Both sets of photometry are presented in Supplementary Table 1. Crucially, saturation was not an issue in the NIR, since WFC3/IR conducts many sub exposures that are then combined to form the final images. We stress that the optical photometry reported here was not used for the majority of our analysis and that results in saturated images should be treated as lower limits.
4.2 Spectroscopy
Three spectra of SN 2017erp were obtained with VLT+XShooter at 292, 349, and 375 days. XShooter is an echelle spectrograph with three arms (UVB, VIS, NIR) covering the wavelength range –Å (Vernet et al., 2011). We used a setup with slit widths of , , and in the UVB, VIS, and NIR arms, respectively. The spectra were reduced using the REFLEX pipeline to produce flux-calibrated one-dimensional spectra (Maguire et al., 2018; Modigliani et al., 2010; Freudling et al., 2013; Maguire et al., 2016). Telluric corrections have been applied to the optical spectra using the MOLECFIT package (Kausch et al., 2015; Smette et al., 2015). The spectra were absolute flux-calibrated using optical photometry obtained by the Las Cumbres Observatory Global Telescope array at similar epochs Brown et al. (2013); Valenti et al. (2016).
Through HST program GO–15686, we obtained a WFC3 G141 grism spectrum of SN 2017erp on 2019 Feb. 26, at a phase of 605.5 days. We extracted the one-dimensional spectrum from –m in bins of 200 Å using sparse-matrix techniques Ryan et al. (2018), but since only a single orient was available, we required additional steps to remove the contamination from the host galaxy Troja et al. (2017). Next, we matched the emission features of the spectrum with iron-group forbidden lines from the National Institute of Standards and Technology’s Atomic Spectra Database and the compilation of atomic data from CMFGEN (Hillier & Miller, 1998; Hillier & Dessart, 2012; Tyndall et al., 2016), including forbidden line data for [Fe II] Quinet et al. (1996) and [Fe III] Quinet (1996).
Late-time NIR photometry of SN 2014J was acquired by synthetically photometering NIR spectra taken at 307–478 days Diamond et al. (2018); Dhawan et al. (2018). The spectra from ref. Dhawan et al. (2018) were shared with us by Suhail Dhawan, while the spectra from ref. Diamond et al. (2018) were re-reduced by us. We retrieved the raw Gemini Near-InfraRed Spectrograph data from the Gemini archive and applied a standard reduction using the Gemini package in Iraf. The observations were conducted in cross-dispersed mode, and the reduction consisted of flat-fielding, sky-subtraction using observations at alternate dither positions, wavelength calibration using an arc lamp, geometric correction of each spectroscopic order, and extraction to a one-dimensional spectrum. A telluric standard, HIP 32549, had been observed immediately prior to each spectrum. At each epoch, we derived the telluric corrections and detector sensitivity function by normalising the reduced spectra of HIP 32549 to a 9700 K blackbody curve (appropriate for the spectral type A0V), scaled to the catalogued magnitudes from 2MASS Skrutskie et al. (2006). Flux calibration was achieved by dividing the SN spectrum by this function. We caution that this approach does not account for differential slit losses between the observations of the SN and the standard, adding some uncertainty to the absolute flux scale. However, as these observations were obtained close together in both time and airmass it is likely that any differences in atmospheric seeing (and hence associated slit losses) were minimal. To account for this, we attribute an uncertainty of 20% to the synthetic photometry.
4.3 Synthesis with ground-based observations
In Figure 2, we synthesize our late-time PSF-fitting F160W photometry with early-phase ground-based -band photometry of SNe 2012ht (Burns et al., 2018) and 2013dy (Pan et al., 2015). We then compare the resultant light curves to SNe 1998bu (Spyromilio et al., 2004; Mayya et al., 1998; Jha et al., 1999; Hernandez et al., 2000; Meikle, 2000), 2000cx (Candia et al., 2003; Sollerman et al., 2004), 2001el (Krisciunas et al., 2003; Stritzinger & Sollerman, 2007), 2003hv (Leloudas et al., 2009), 2004eo (Pastorello et al., 2007), 2011fe (Shappee et al., 2017; Matheson et al., 2012), 2012cg (Graur et al., 2016; Marion et al., 2016), and 2014J (Sand et al., 2016).
To overcome any systematics associated with measurements of the distance moduli and host-galaxy extinctions of the SNe by the various groups cited above, we do not correct the photometry of the SNe for any of these effects. Instead, motivated by the finding that SNe Ia have a low dispersion of mag around peak in F160W (Avelino et al., 2019), we use the early-phase portions of their light curves to scale them to SN 2011fe. Applying a distance modulus to SN 2011fe of mag (Matheson et al., 2012), the combined light curves peak at mag, consistent with the template F160W peak magnitude derived by ref. Avelino et al. (2019). The same scaling factors are also applied to the - and -band data presented in Figure 2. For SNe 2017erp and 2019np, which do not have early-time NIR data, we use distance moduli of 32.29 and 32.58 mag, respectively (Brown et al., 2019; Tully et al., 2016) and Galactic reddenings in F160W of and mag, respectively (Schlafly & Finkbeiner, 2011). SN 2018gv, which does not have coverage of the first -band peak, was matched to SN 2011fe at 25 days Yang et al. (2019) using early-time optical photometry.
In this work, we do not apply -corrections between the ground-based -band photometry and space-based F160W photometry. These are difficult to measure, since most of the SNe we analyze here do not have synchronous and F160W data. To estimate this effect, we performed synthetic aperture photometry on a 425-day spectrum of SN 2013aa (Maguire et al., 2018) and found that the resultant F160W photometry was mag fainter than in the band. Though larger than the formal uncertainties of the photometry in Supplementary Table 1, this effect is an order of magnitude smaller than the dispersion of magnitudes we measure during the plateau phase.
4.4 Comparison with theory
We extracted the SN Ia emission models shown in Figure 6 by digitizing the curves from figure 11 of ref. Sollerman et al. (2004) with WebPlotDigitizer. Next, we scaled the - and -band models to the F160W and F350LP photometry of SN 2018gv at 300 days, respectively. For display purposes, we also scaled the synthetic -band photometry of SN 2014J by mag. We emphasize that the theoretical models were only scaled—not fitted—to the photometry of SN 2018gv.
Acknowledgments
We thank Gabriel Brammer, Daniel Eisenstein, Wolfgang Kerzendorf, Stuart Sim, Lou Strolger, and the referees for helpful discussions and comments; Suhail Dhawan for sharing his spectra of SN 2014J; and Annalisa Calamida, Weston Eck, Mario Gennaro, and William Januszewski for supporting the HST programs used here.
Funding: O.G. is supported by an NSF Astronomy and Astrophysics Fellowship under award AST-1602595. K.M. acknowledges support from H2020 through an ERC Starting Grant (758638). M.N. is supported by a Royal Astronomical Society Research Fellowship. R.T.F. acknowledges support from NASA ATP award 80NSSC18K1013. This work is based on data obtained with the NASA/ESA Hubble Space Telescope, all of which was obtained from MAST. Support for MAST for non-HST data is provided by the NASA Office of Space Science via grant NNX09AF08G and by other grants and contracts. Based on data taken at the European Organization for Astronomical Research in the Southern Hemisphere, Chile, under program IDs: 0100.D-0242(A) and 0101.D-0443(A). This research has made use of NASA’s Astrophysics Data System and the NASA/IPAC Extragalactic Database (NED) which is operated by the Jet Propulsion Laboratory, California Institute of Technology, under contract with NASA. The NIST databases were funded, in part, by NIST’s Standard Reference Data Program (SRDP) and by NIST’s Systems Integration for Manufacturing Applications (SIMA) Program. Finally, this work has made use of the Open Supernova Catalog (Guillochon et al., 2017).
Author contributions: O.G. planned the observations for HST programs GO–15686 and 15693, reduced the HST imaging data, performed the analysis, and wrote the manuscript. K.M. obtained the ground-based spectra of SN 2017erp. M.N. reduced the Gemini spectra of SN 2014J. R.R. reduced the grism observation of SN 2017erp obtained through HST program GO–15686. A.A. measured values for the correlation study. A.G.R. planned the HST observations for programs GO–12880, 15145, and 15640. I.R.S., R.F., and L.S. assisted with the theoretical analysis of the observations.
Competing interests: The authors declare that there are no competing interests.
Data availability: HST observations are available through the Mikulski Archive for Space Telescopes (MAST). The data for Supplementary Tables 1–2 and Figures 2–5 are provided in the Supplemental Material section as machine-readable tables. Any further data are available from the corresponding author upon reasonable request.
Supplementary Material
Supplementary Table 1: Hubble Space Telescope photometry of SNe 2012ht, 2013dy, 2017erp, 2018gv and 2019np, presented as a machine-readable table.
Supplementary Table 2: Synthetic photometry of SN 2014J, presented as a machine-readable table.
Supplementary Data 1: Data behind Figure 2, presented as a machine-readable table.
Supplementary Data 2: Data behind Figure 3A, presented as a machine-readable table.
Supplementary Data 3: Data behind Figure 3B, presented as a machine-readable table.
Supplementary Data 4: Data behind Figure 4, presented as a machine-readable table.
Supplementary Data 5: Data behind figure 5: Hubble Space Telescope grism spectrum of SN 2017erp, presented as a machine-readable table.
References
- Anupama et al. (2009) Anupama, G. C., Sahu, D. K., Gurugubelli, U. K., et al. 2009, MNRAS, 392, 894
- Arnett (1982) Arnett, W. D. 1982, ApJ, 253, 785
- Avelino et al. (2019) Avelino, A., Friedman, A. S., Mandel, K. S., et al. 2019, arXiv e-prints, arXiv:1902.03261
- Axelrod (1980) Axelrod, T. S. 1980, PhD thesis, California Univ., Santa Cruz.
- Borkowski et al. (2006) Borkowski, K. J., Williams, B. J., Reynolds, S. P., et al. 2006, ApJ, 642, L141
- Brown et al. (2019) Brown, P. J., Hosseinzadeh, G., Jha, S. W., et al. 2019, ApJ, 877, 152
- Brown et al. (2013) Brown, T. M., Baliber, N., Bianco, F. B., et al. 2013, PASP, 125, 1031
- Burns et al. (2018) Burns, C. R., Parent, E., Phillips, M. M., et al. 2018, ApJ, 869, 56
- Candia et al. (2003) Candia, P., Krisciunas, K., Suntzeff, N. B., et al. 2003, PASP, 115, 277
- Cappellaro et al. (1997) Cappellaro, E., Mazzali, P. A., Benetti, S., et al. 1997, A&A, 328, 203
- Cappellaro et al. (2001) Cappellaro, E., Patat, F., Mazzali, P. A., et al. 2001, ApJ, 549, L215
- Chevalier (1976) Chevalier, R. A. 1976, ApJ, 207, 872
- Colgate & McKee (1969) Colgate, S. A., & McKee, C. 1969, ApJ, 157, 623
- Deustua et al. (2016) Deustua, S. E., Mack, J., Bowers, A. S., et al. 2016, UVIS 2.0 Chip-dependent Inverse Sensitivity Values, Tech. rep.
- Dhawan et al. (2018) Dhawan, S., Flörs, A., Leibundgut, B., et al. 2018, A&A, 619, A102
- Diamond et al. (2018) Diamond, T. R., Hoeflich, P., Hsiao, E. Y., et al. 2018, ApJ, 861, 119
- Dimitriadis et al. (2017) Dimitriadis, G., Sullivan, M., Kerzendorf, W., et al. 2017, MNRAS, 468, 3798
- Dolphin (2000) Dolphin, A. E. 2000, PASP, 112, 1383
- Douvion et al. (2001) Douvion, T., Lagage, P. O., Cesarsky, C. J., & Dwek, E. 2001, A&A, 373, 281
- Fransson & Jerkstrand (2015) Fransson, C., & Jerkstrand, A. 2015, ApJ, 814, L2
- Freudling et al. (2013) Freudling, W., Romaniello, M., Bramich, D. M., et al. 2013, A&A, 559, A96
- Gomez et al. (2012) Gomez, H. L., Clark, C. J. R., Nozawa, T., et al. 2012, MNRAS, 420, 3557
- Graham et al. (2015) Graham, M. L., Nugent, P. E., Sullivan, M., et al. 2015, MNRAS, 454, 1948
- Graur (2019) Graur, O. 2019, ApJ, 870, 14
- Graur et al. (2016) Graur, O., Zurek, D., Shara, M. M., et al. 2016, ApJ, 819, 31
- Graur et al. (2018a) Graur, O., Zurek, D. R., Cara, M., et al. 2018a, ApJ, 866, 10
- Graur et al. (2018b) Graur, O., Zurek, D. R., Rest, A., et al. 2018b, ApJ, 859, 79
- Guillochon et al. (2017) Guillochon, J., Parrent, J., Kelley, L. Z., & Margutti, R. 2017, ApJ, 835, 64
- Hack et al. (2012) Hack, W. J., Dencheva, N., Fruchter, A. S., et al. 2012, in American Astronomical Society Meeting Abstracts, Vol. 220, American Astronomical Society Meeting Abstracts #220, 135.15
- Hernandez et al. (2000) Hernandez, M., Meikle, W. P. S., Aparicio, A., et al. 2000, MNRAS, 319, 223
- Hillier & Dessart (2012) Hillier, D. J., & Dessart, L. 2012, MNRAS, 424, 252
- Hillier & Miller (1998) Hillier, D. J., & Miller, D. L. 1998, ApJ, 496, 407
- Höflich (1995) Höflich, P. 1995, ApJ, 443, 89
- Jha et al. (1999) Jha, S., Garnavich, P. M., Kirshner, R. P., et al. 1999, ApJS, 125, 73
- Kasen (2006) Kasen, D. 2006, ApJ, 649, 939
- Kausch et al. (2015) Kausch, W., Noll, S., Smette, A., et al. 2015, A&A, 576, A78
- Kerzendorf et al. (2017) Kerzendorf, W. E., McCully, C., Taubenberger, S., et al. 2017, MNRAS, 472, 2534
- Krisciunas et al. (2003) Krisciunas, K., Suntzeff, N. B., Candia, P., et al. 2003, AJ, 125, 166
- Leloudas et al. (2009) Leloudas, G., Stritzinger, M. D., Sollerman, J., et al. 2009, A&A, 505, 265
- Li et al. (2001) Li, W., Filippenko, A. V., Gates, E., et al. 2001, PASP, 113, 1178
- Li et al. (2019) Li, W., Wang, X., Hu, M., et al. 2019, ApJ, 882, 30
- Maguire et al. (2016) Maguire, K., Taubenberger, S., Sullivan, M., & Mazzali, P. A. 2016, MNRAS, 457, 3254
- Maguire et al. (2018) Maguire, K., Sim, S. A., Shingles, L., et al. 2018, MNRAS, 477, 3567
- Marion et al. (2016) Marion, G. H., Brown, P. J., Vinkó, J., et al. 2016, ApJ, 820, 92
- Matheson et al. (2012) Matheson, T., Joyce, R. R., Allen, L. E., et al. 2012, ApJ, 754, 19
- Mattila et al. (2008) Mattila, S., Meikle, W. P. S., Lundqvist, P., et al. 2008, MNRAS, 389, 141
- Mayya et al. (1998) Mayya, Y. D., Puerari, I., & Kuhn, O. 1998, IAU Circ., 6907
- Meikle (2000) Meikle, W. P. S. 2000, MNRAS, 314, 782
- Modigliani et al. (2010) Modigliani, A., Goldoni, P., Royer, F., et al. 2010, in Proc. SPIE, Vol. 7737, Observatory Operations: Strategies, Processes, and Systems III, 773728
- Nozawa et al. (2011) Nozawa, T., Maeda, K., Kozasa, T., et al. 2011, ApJ, 736, 45
- Nugent et al. (1995) Nugent, P., Phillips, M., Baron, E., Branch, D., & Hauschildt, P. 1995, ApJ, 455, L147
- Pan et al. (2015) Pan, Y.-C., Foley, R. J., Kromer, M., et al. 2015, MNRAS, 452, 4307
- Pastorello et al. (2007) Pastorello, A., Mazzali, P. A., Pignata, G., et al. 2007, MNRAS, 377, 1531
- Patat (2005) Patat, F. 2005, MNRAS, 357, 1161
- Patat et al. (2006) Patat, F., Benetti, S., Cappellaro, E., & Turatto, M. 2006, MNRAS, 369, 1949
- Pinto & Eastman (2000) Pinto, P. A., & Eastman, R. G. 2000, ApJ, 530, 757
- Quinet (1996) Quinet, P. 1996, A&AS, 116, 573
- Quinet et al. (1996) Quinet, P., Le Dourneuf, M., & Zeippen, C. J. 1996, A&AS, 120, 361
- Rest et al. (2012) Rest, A., Sinnott, B., & Welch, D. L. 2012, PASA, 29, 466
- Ryan et al. (2018) Ryan, R. E., J., Casertano, S., & Pirzkal, N. 2018, PASP, 130, 034501
- Sand et al. (2016) Sand, D. J., Hsiao, E. Y., Banerjee, D. P. K., et al. 2016, ApJ, 822, L16
- Schlafly & Finkbeiner (2011) Schlafly, E. F., & Finkbeiner, D. P. 2011, ApJ, 737, 103
- Shappee et al. (2017) Shappee, B. J., Stanek, K. Z., Kochanek, C. S., & Garnavich, P. M. 2017, ApJ, 841, 48
- Skrutskie et al. (2006) Skrutskie, M. F., Cutri, R. M., Stiening, R., et al. 2006, AJ, 131, 1163
- Smette et al. (2015) Smette, A., Sana, H., Noll, S., et al. 2015, A&A, 576, A77
- Sollerman et al. (2004) Sollerman, J., Lindahl, J., Kozma, C., et al. 2004, A&A, 428, 555
- Spyromilio et al. (2004) Spyromilio, J., Gilmozzi, R., Sollerman, J., et al. 2004, A&A, 426, 547
- Stritzinger & Sollerman (2007) Stritzinger, M., & Sollerman, J. 2007, A&A, 470, L1
- Taubenberger et al. (2015) Taubenberger, S., Elias-Rosa, N., Kerzendorf, W. E., et al. 2015, MNRAS, 448, L48
- Troja et al. (2017) Troja, E., Piro, L., van Eerten, H., et al. 2017, Nature, 551, 71
- Truran et al. (1967) Truran, J. W., Arnett, W. D., & Cameron, A. G. W. 1967, Canadian Journal of Physics, 45, 2315
- Tully et al. (2016) Tully, R. B., Courtois, H. M., & Sorce, J. G. 2016, AJ, 152, 50
- Tyndall et al. (2016) Tyndall, N. B., Ramsbottom, C. A., Ballance, C. P., & Hibbert, A. 2016, MNRAS, 462, 3350
- Valenti et al. (2016) Valenti, S., Howell, D. A., Stritzinger, M. D., et al. 2016, MNRAS, 459, 3939
- Vernet et al. (2011) Vernet, J., Dekker, H., D’Odorico, S., et al. 2011, A&A, 536, A105
- Williams et al. (2012) Williams, B. J., Borkowski, K. J., Reynolds, S. P., et al. 2012, ApJ, 755, 3
- Yang et al. (2018) Yang, Y., Wang, L., Baade, D., et al. 2018, ApJ, 852, 89
- Yang et al. (2019) Yang, Y., Hoeflich, P. A., Baade, D., et al. 2019, arXiv e-prints, arXiv:1903.10820