Spatial coherence of spin-orbit-coupled Bose gases
Abstract
Spin-orbit-coupled Bose-Einstein condensates (SOBECs) exhibit two new phases of matter, now known as the stripe and plane-wave phases. When two interacting spin components of a SOBEC spatially overlap, density modulations with periodicity given by the spin-orbit coupling strength appear. In equilibrium, these components fully overlap in the miscible stripe phase, and overlap only in a domain wall in the immiscible plane-wave phase. Here we probe the density modulation present in any overlapping region with optical Bragg scattering, and observe the sudden drop of Bragg scattering as the overlapping region shrinks. Using an atomic analogue of the Talbot effect, we demonstrate the existence of long-range coherence between the different spin components in the stripe phase and surprisingly even in the phase-separated plane-wave phase.
Systems with coexisting order parameters, such as ferromagnetic superconductors Matthias et al. (1958), supersolids Pomeau and Rica (1994), or topological Kondo insulators Dzero et al. (2010), exhibit rich phases with novel phenomena. Spin-orbit coupled Bose-Einstein condensates (SOBECs) have a complex phase diagram including both “stripe” and “plane-wave” phases. The stripe phase is expected to have coexisting order parameters Stanescu and Galitski (2007); Lin et al. (2011); Ho and Zhang (2011) with supersolid-like properties Li et al. (2013) marked by long-range phase coherence and periodic density modulations (confirmed by optical Bragg scattering Li et al. (2017)) simultaneously present. In contrast, the “plane-wave” phase behaves like a ferromagnetic spinor Bose-Einstein condensate (BEC), where its true many-body ground state is predicted to be massively entangled with application to precision magnetometry Higbie and Stamper-Kurn (2004); Stanescu et al. (2008). In both the stripe and plane-wave phases, we readout a matter wave Talbot interferometer with optical Bragg scattering to detect coexisting periodic density modulations (long range diagonal order) and system-wide phase coherence (long-range off-diagonal order). Unexpectedly, both phases exhibit both types of order.
Figure 1a schematically depicts the stripe and plane-wave phases of SOBECs, showing two salient features Wang et al. (2010); Ho and Zhang (2011); Lin et al. (2011): (1) system-wide periodic density modulations are associated with fully coexisting spin components in the stripe phase; and (2) highly localized density modulations are present at a domain-wall delineating phase-separated spin components in the plane-wave phase. Initial experiments with Raman coupled 87Rb Bose-Einstein condensates (BECs) identified these phases in terms of the degree of spatial overlap of the two spin components Lin et al. (2011), but not the microscopic density modulations. Direct observation of these modulations in 87Rb BECs is challenging both because the modulation period is below the resolution of even the best quantum gas microscope Bakr et al. (2009), and the modulation contrast is small. Here we probe these modulations in long-lived equilibrium systems in both the stripe and plane-wave phases.
Our manuscript is organized as follows: (1) we introduce the physics of SOBECs; (2) we describe our experimental setup; (3) we cross-check our Bragg measurements with established techniques; (4) we demonstrate the coexistence of diagonal and off-diagonal order in the same system; and (5) we discuss the implications of these measurements on the issues of supersolidity in stripe-phase SOBECs.
SOBECS with Raman coupling We realized SOBECs described by the single-particle Hamiltonian
| (1) |
for particles of mass . Here, and describe Zeeman shifts from longitudinal and transverse fields respectively; and the spin-orbit coupling (SOC) strength defines the relevant energy scale . is the quasi-momentum along ; is the linear momentum in the plane; and are Pauli operators. The insets to Fig. 1a show the characteristic double-well dispersion associated with SOC, with minima separated by approximately , and energy gap equal to . In our experiments we use two-photon Raman transitions to introduce the SOC term: the Raman laser wavelength determines the SOC strength ; the Raman laser intensities determine ; and the laser frequency differences imbue detuning to the SOC system Lin et al. (2011); Ho and Zhang (2011).
We describe the two spin-components of our system by the spinor wavefunction , where the mean-field interaction energy density is
Here and describe the inter- and intra-spin interaction parameters respectively, and is the mean density. For dilute Bose-gases (with chemical potential ), the impact of interactions can be parameterized in terms of a scaled recoil energy ; in this case the spin mixed, stable ground-state stripe phase, exists in a very narrow range of parameters Lin et al. (2011): with between and ; and , with the critical coupling strength . As depicted in Fig. 1a (left), the stripe-phase density
is modulated with wave-vector
| (2) |
The phase describing the stripe’s location Ho and Zhang (2011); Li et al. (2012) results from the pre-existing phase difference between the two spin components along with the relative phase between the Raman laser beams. On the contrary, for the plane-wave phase () shown in Fig. 1a (right), density modulations are expected only within the domain-wall separating the now polarized spin components.
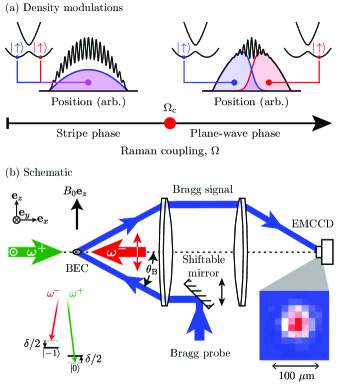
Experimental setup We produced condensed atoms in a harmonic trap with frequencies and chemical potential . Two Raman lasers, counter-propagating along , coupled the and hyperfine levels of electronic ground states. We used the tune-out wavelength Arora et al. (2011) for our Raman lasers which defined the single-photon recoil energy .
We used optical Bragg scattering Weidemüller et al. (1995); Birkl et al. (1995); Miyake et al. (2011) to detect periodic density modulations. The Bragg probe laser, with wavelength , was red-detuned from the transition within the line Müller et al. (2005). This put the Bragg probe beam in the far-detuned limit with respect to: the transition linewidth, the Zeeman shifts, and the excited state hyperfine structure. In this limit the atomic susceptibility is almost entirely real and state-independent. Figure 1(a) shows our experimental setup, with atoms located at the focus of a Keplerian imaging system aligned along . The Raman lasers propagated along and the Bragg probe had an incident angle with respect to the optical axes. A shiftable mirror in the back focal plane tuned from to , allowing the detection of Bragg scattering from structures with period from about to ; we used in these experiments 111 Due to the modest transverse size of our BEC, the Bragg peak was both broadened and shifted to an increased incoming angle Slama et al. (2005). We observed the lowest order Bragg peak at , larger than the theoretically predicted Bragg angle for an infinite crystal with periodicity . This shift is consistent with our numerical simulations.. In , the interaction constants Widera et al. (2006) are , so the stable ground-state stripe phase was present for and .
The Bragg diffracted signal, as shown in the inset of Fig. 1(b), was detected with an electron-multiplying charge-coupled device (EMCCD) camera. As described in the supplementary material (SM), we first calibrated our Bragg signal using an optical lattice and found that the signal-to-noise ratio (SNR) of one occurred for a fractional density modulation of , providing practical detection threshold.
We prepared our SOBECs from an initial BEC with equal superposition of spin and at a desired detuning , and linearly increased from to in . We then allowed the system to equilibrate for a hold time . At the transition from stripe to plane-wave phase at , the expected density modulation contrast is just : just below our detection threshold. Inspired by Ref. Hart et al., 2015, we rapidly ramped to in just prior to our Bragg measurement, increasing to (see SM). This rapid ramp was slow compared to the energy spacing between the two branches of the SOC dispersion, but fast compared to the much slower many-body dynamics. As a result, this process simply magnified the amplitude of the SOC driven stripes wherever they were present in the system. We then turned the Raman lasers off and pulsed the Bragg laser with duration ranging from to .
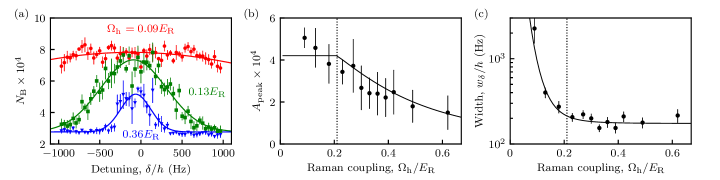
Validation of method We began by demonstrating our ability to maintain balanced spin mixtures very near , in the process cross-checking our Bragg measurements against earlier TOF (time-of-flight) experiments Lin et al. (2011). We characterized the transition from the stripe to plane-wave phase as a function of Raman coupling and detuning . Figure 2(a) shows the number of photo-electrons in our detection region as a function of at different values of for a fixed hold time . We observe Bragg scattering in a narrow detuning window that decreases in width and amplitude as increases.
Figure 2(b) quantifies the amplitude in terms of the peak height obtained from Gaussian fits to . We might expect the Bragg scattering amplitude to be constant in the stripe phase where the spin components mix, and then to vanish in the plane-wave phase when the gas becomes locally polarized. However, even when different plane-wave regions phase separate, density modulations are present in the domain wall separating the different phases, allowing some Bragg scattering. The spin healing length in terms of the conventional healing length . sets the domain wall size Lin et al. (2011) and diverges at . Figure 2(b) shows rapidly falling with increasing coupling strength, consistent with the expected trend. The solid curve is a fit to our scattering model model (derived from the above reasoning and developed in the SM) with the overall Bragg signal as the only free parameter. This model shows only qualitative agreement with data, a point we will return to shortly.
Figure 2(c) plots the Gaussian width . Even for , a small detuning that breaks the degeneracy of the two spin states can cause the initially spatially mixed states to relax into a polarized gas in the lower energy spin state: a plane-wave phase with no Bragg scattering. When there are no spin-changing processes, and the spatially mixed state is stable indefinitely, independent of . The width is thus large for small (slower spin relaxation) and decreases as increases (faster spin relaxation). The width has no marked feature at , and is well fit by a power-law Lin et al. (2011), here . This indicates that the process by which the spin population polarizes in the presence of detuning is dependent on the Raman coupling strength, but not the initial zero-detuning phase.
In all cases, the detuning window is far wider than the range of detuning where the stripe phase is thermodynamically stable. This is as expected: the timescale for the spin populations to reach the expected equilibrium population can be in excess of several seconds for small detunings (see Ref. Lin et al., 2011 and SM for a discussion of the equilibration timescale). In what follows we focus on near-zero detunings that lie within this meta-stable region and where the physics is governed by alone.
Spatial coherence Finally, we present our main observation demonstrating the spatial coherence of the SOBECs. Here we altered our measurement procedure to include a free evolution time following the turn off of the Raman lasers but prior to the Bragg pulse. During this time, the different spin and momentum components that comprised the Raman dressed states underwent free evolution creating a matter-wave Talbot interferometer Talbot Esq. F.R.S. (1836); Miyake et al. (2011); Santra et al. (2017). A coherent matter-wave with wave-vector exhibits a coherence revival after a time period of , during which time momentum components traveling with velocity separated by a distance . Figure 3(a) schematically depicts this behavior: the left panel shows modulations in total density (black) and in each spin component (red and blue) at ; the center panel shows that after the modulation pattern in each spin component moved of the overall modulation period, yielding a flat density profile. The right panel shows the long-time behavior in which the spin components moved a distance comparable to the overall system size.
The periodic revivals in Fig. 3(b) occured very near the free-particle Talbot time, only about one-third of our earlier Bragg pulse time. This indicates that all of our previous measurements inadvertently integrated over about three periods of collapse and revival. To resolve the Talbot signal, we largely mitigated this effect by reducing the pulse time to , and averaging over at least four experimental realizations to account for the reduced signal present in each measurement.
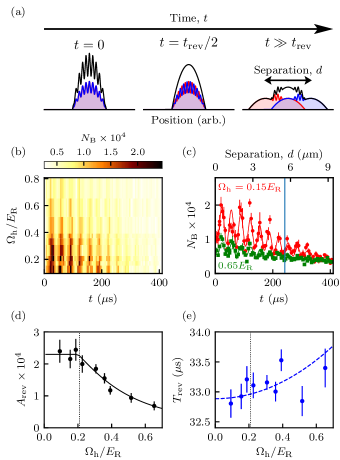
Figure 3(c) shows as a function of for a range of , each constituting a single horizontal cut through Fig. 3(b). In Fig. 3(c), we observe damped oscillatory behavior that provides a lower bound to the coherence length of the system (other physical effects Miyake et al. (2011) may also cause the decay of ). Our observations are complicated by the Bragg pulse which is not short compared to the revival time. We modeled the integrated Bragg signal as a sinusiod with Gaussian decay 222We also considered exponential decay, but the overall was increased by a factor of four. convolved with our Bragg pulse to obtain
as displayed by the solid curves in Fig. 3(c). Here is the Bragg pulse duration and the fitting parameters are revival amplitude , revival period , decay time , and constant .
Figure 3(d)-(e) shows the revival amplitude , and period , as a function of coupling strength . The amplitude gradually decreases above , which we attribute to the onset of phase separation and subsequent increasing separation between the two plane-wave components. The solid curve depicts the fit to the scattering model described in the SM with the overall scattering strength as the only free parameter, showing near perfect agreement with experiment. Allowing to vary in the scattering model produces a value , also in agreement with our expectations. Figure 3(e) shows revival periods close to , just below the naive single-particle prediction. Our model in Eq. (2) predicts an increase in for larger as the stripe wave-vector falls. This increasing trend is plotted by the blue dashed curve; both this model and the null hypothesis are consistent with the data.
Lastly, the decay time was independent of , indicating that the transition from the stripe phase to the plane-wave phase was not associated with any decrease in spatial coherence. During this , the interfering momentum are states separated by , comparable to the Thomas-Fermi radius [shown by the vertical line in Fig. 3(c)]. We conclude that the system was fully coherent even in the phase-separated plane-wave phase.
Implications for supersolidity As has now been observed with dipolar atoms Natale et al. (2019), a traditional supersolid is a phase of matter with two broken symmetries Boninsegni and Prokof’ev (2012): the broken gauge symmetry of a BEC (giving a superfluid phonon mode) and the broken translation symmetry of a lattice (giving a separate lattice-phonon mode). On one hand, we confirmed that diagonal order is present Li et al. (2017), and demonstrated that this coexists with off-diagonal order: a supersolid? On the other hand, a BEC in a shallow optical lattice has off-diagonal order, with density modulations (diagonal order) simply imprinted by the lattice potential Greiner et al. (2002): not a supersolid.
With the Raman lasers off, our system is a two-component spinor BEC with two broken symmetries giving an overall phase (giving a superfluid phonon mode), and a relative phase between the spin components (giving a spin-wave mode); translational symmetry is unbroken: not a supersolid. Adding Raman coupling continuously connects this spinor phase to the stripe-phase. The modulation period (from Eq. 2) is externally imposed by the Raman lasers, with spatial phase set both by the relative phase between the Raman lasers and the pre-existing relative phase between spin components. Similar to the lattice case, no new symmetries are broken and no new collective modes are created: not a supersolid? Although no new symmetries are broken, the spin-wave mode acquires an inertial contribution from the periodic density modulations inducing a gap at the edge of the associated Brillouin zone: as would be expected of a super-solid’s lattice-phonon mode Li et al. (2013). We conclude that this system some properties with conventional supersolids, but is best given its own name: the super-stripe phase, as suggested in Ref. Li et al., 2013. The lattice-phonon mode remains undetected, and its observation would be a true smoking gun for observation of super-stripes.
Acknowledgements.
This work was partially supported by the AROs atomtronics MURI, the AFOSRs Quantum Matter MURI, NIST, and the NSF through the PFC at the JQI. We are grateful for the very thoughtful and detailed eleventh hour reading of our manuscript by Qiyu Liang and Alina Pinero.References
- Matthias et al. (1958) B. T. Matthias, H. Suhl, and E. Corenzwit, Phys. Rev. Lett. 1, 449 (1958).
- Pomeau and Rica (1994) Y. Pomeau and S. Rica, Phys. Rev. Lett. 72, 2426 (1994).
- Dzero et al. (2010) M. Dzero, K. Sun, V. Galitski, and P. Coleman, Phys. Rev. Lett. 104, 106408 (2010).
- Stanescu and Galitski (2007) T. D. Stanescu and V. Galitski, Phys. Rev. B 75, 125307 (2007).
- Lin et al. (2011) Y. J. Lin, K. Jimenez-Garcia, and I. B. Spielman, Nature 471, 83 (2011).
- Ho and Zhang (2011) T.-L. Ho and S. Zhang, Phys. Rev. Lett. 107, 150403 (2011).
- Li et al. (2013) Y. Li, G. I. Martone, L. P. Pitaevskii, and S. Stringari, Phys. Rev. Lett. 110, 235302 (2013).
- Li et al. (2017) J.-R. Li, J. Lee, W. Huang, S. Burchesky, B. Shteynas, F. c. Top, A. O. Jamison, and W. Ketterle, Nature 543, 91 (2017).
- Higbie and Stamper-Kurn (2004) J. Higbie and D. M. Stamper-Kurn, Phys. Rev. A 69, 053605 (2004).
- Stanescu et al. (2008) T. D. Stanescu, B. Anderson, and V. Galitski, Physical Review A (Atomic, Molecular, and Optical Physics) 78, 023616 (2008).
- Wang et al. (2010) C. Wang, C. Gao, C.-M. Jian, and H. Zhai, Phys. Rev. Lett. 105, 160403 (2010).
- Bakr et al. (2009) W. S. Bakr, J. I. Gillen, A. Peng, S. Fölling, and M. Greiner, Nature 462, 74 EP (2009).
- Li et al. (2012) Y. Li, L. P. Pitaevskii, and S. Stringari, Phys. Rev. Lett. 108, 225301 (2012).
- Arora et al. (2011) B. Arora, M. S. Safronova, and C. W. Clark, Phys. Rev. A 84, 043401 (2011).
- Weidemüller et al. (1995) M. Weidemüller, A. Hemmerich, A. Görlitz, T. Esslinger, and T. W. Hänsch, Phys. Rev. Lett. 75, 4583 (1995).
- Birkl et al. (1995) G. Birkl, M. Gatzke, I. H. Deutsch, S. L. Rolston, and W. D. Phillips, Phys. Rev. Lett. 75, 2823 (1995).
- Miyake et al. (2011) H. Miyake, G. A. Siviloglou, G. Puentes, D. E. Pritchard, W. Ketterle, and D. M. Weld, Phys. Rev. Lett. 107, 175302 (2011).
- Müller et al. (2005) C. A. Müller, C. Miniatura, D. Wilkowski, R. Kaiser, and D. Delande, Phys. Rev. A 72, 053405 (2005).
- Note (1) Due to the modest transverse size of our BEC, the Bragg peak was both broadened and shifted to an increased incoming angle Slama et al. (2005). We observed the lowest order Bragg peak at , larger than the theoretically predicted Bragg angle for an infinite crystal with periodicity . This shift is consistent with our numerical simulations.
- Widera et al. (2006) A. Widera, F. Gerbier, S. Fölling, T. Gericke, O. Mandel, and I. Bloch, New Journal of Physics 8, 152 (2006).
- Hart et al. (2015) R. A. Hart, P. M. Duarte, T.-L. Yang, X. Liu, T. Paiva, E. Khatami, R. T. Scalettar, N. Trivedi, D. A. Huse, and R. G. Hulet, Nature 519, 211 (2015).
- Talbot Esq. F.R.S. (1836) H. Talbot Esq. F.R.S., The London, Edinburgh, and Dublin Philosophical Magazine and Journal of Science 9, 401 (1836).
- Santra et al. (2017) B. Santra, C. Baals, R. Labouvie, A. B. Bhattacherjee, A. Pelster, and H. Ott, Nature Communications 8, 15601 (2017).
- Note (2) We also considered exponential decay, but the overall was increased by a factor of four.
- Natale et al. (2019) G. Natale, R. M. W. van Bijnen, A. Patscheider, D. Petter, M. J. Mark, L. Chomaz, and F. Ferlaino, Phys. Rev. Lett. 123, 050402 (2019).
- Boninsegni and Prokof’ev (2012) M. Boninsegni and N. V. Prokof’ev, Rev. Mod. Phys. 84, 759 (2012).
- Greiner et al. (2002) M. Greiner, O. Mandel, T. Esslinger, T. W. Hansch, and I. Bloch, Nature 415, 39 (2002).
- Slama et al. (2005) S. Slama, C. von Cube, A. Ludewig, M. Kohler, C. Zimmermann, and P. W. Courteille, Phys. Rev. A 72, 031402 (2005).