Optical and photoemission investigation of structural and magnetic transitions in the iron-based superconductor Sr0.67Na0.33Fe2As2
Abstract
We report the temperature dependent optical conductivity and angle-resolved photoemission spectroscopy (ARPES) studies of the multiband iron-based superconductor Sr0.67Na0.33Fe2As2. Measurements were made in the high-temperature tetragonal paramagnetic phase; below the structural and magnetic transitions at K in the orthorhombic spin-density-wave (SDW)-like phase, and K in the reentrant tetragonal double- magnetic phase where both charge and SDW order exist; and below the superconducting transition at K. The free-carrier component in the optical conductivity is described by two Drude contributions; one strong and broad, the other weak and narrow. The broad Drude component decreases dramatically below and , with much of its strength being transferred to a bound excitation in the mid-infrared, while the narrow Drude component shows no anomalies at either of the transitions, actually increasing in strength at low temperature while narrowing dramatically. The behavior of an infrared-active mode suggests zone-folding below . Below the dramatic decrease in the low-frequency optical conductivity signals the formation of a superconducting energy gap. ARPES reveals hole-like bands at the center of the Brillouin zone (BZ), with both electron- and hole-like bands at the corners. Below , the hole pockets at the center of the BZ decrease in size, consistent with the behavior of the broad Drude component; while below the electron-like bands shift and split, giving rise to a low-energy excitation in the optical conductivity at meV. The and magnetic states, with resulting spin-density-wave and charge-SDW order, respectively, lead to a significant reconstruction of the Fermi surface that has profound implications for the transport originating from the electron and hole pockets, but appears to have relatively little impact on the superconductivity in this material.
pacs:
72.15.-v, 74.70.-b, 78.20.-eI Introduction
The discovery of iron-based superconductors prompted an intensive investigation in the hope of identifying new compounds with high superconducting critical temperatures (’s) Johnston (2010); Paglione and Greene (2010); Canfield and Bud’ko (2010); Si et al. (2016). In many of the iron-based materials, superconductivity emerges with the suppression of antiferromagnetic (AFM) order, suggesting that the pairing mechanism is related to the magnetism. Indeed, the iron-based materials display a variety of magnetically-ordered ground states Dean et al. (2012); Dai (2015); Moroni et al. (2017); Kreyssig et al. (2018); Meier et al. (2018) that may either compete with or foster the emergence of superconductivity.
One class of materials, AeFe2As2, where AeBa, Ca or Sr (the so-called “122” materials), is particularly useful as superconductivity may be induced through a variety of chemical substitutions Rotter et al. (2008); Sefat et al. (2008); Ni et al. (2008); Sasmal et al. (2008); Chen et al. (2008); Chu et al. (2009); Goko et al. (2009); Saha et al. (2009); Jiang et al. (2009); Shi et al. (2010); Cortes-Gil and Clarke (2011), as well as through the application of pressure Ishikawa et al. (2009); Alireza et al. (2009); Colombier et al. (2009); Kitagawa et al. (2009). The phase diagram of Sr1-xNaxFe2As2 has a number of interesting features. At room temperature, the parent compound SrFe2As2 is a paramagnetic metal with a tetragonal () structure. The resistivity in the iron-arsenic planes decreases with temperature until it drops anomalously as the material undergoes a magnetic transition at K to a spin-density-wave (SDW)-like AFM ground state that is also accompanied by a structural transition to an orthorhombic () phase Tegel et al. (2008); Yan et al. (2008); Zhao et al. (2008); Hu et al. (2008); Hancock et al. (2010); Blomberg et al. (2011). The crystals are heavily twinned in the orthorhombic phase; however, the application of uniaxial stress along the direction of the tetragonal unit cell results in a nearly twin-free sample Tanatar et al. (2009); Fisher et al. (2011). The magnetic order may be described as AFM stripes, where the iron spins are aligned antiferromagnetically along the a axis and ferromagnetically along the b axis Goldman et al. (2008); Kofu et al. (2009); this is also referred to as the magnetic phase due to its twofold rotation symmetry. As the sodium content increases, the magnetic and structural transition temperatures decrease until both disappear at ; superconductivity appears well before this point at , and reaches a maximum of K for . Between , an additional magnetic and structural transition occurs below at ; the tetragonal () phase reemerges, forming a dome which lies completely within the AFM region. This phase appears to be a common element in the hole-doped 122 materials Kim et al. (2010); Hassinger et al. (2012); Böhmer et al. (2015); Wang et al. (2016); Taddei et al. (2016); Wang et al. (2019); Hassinger et al. (2016); Taddei et al. (2017); Yi et al. (2018); Avci et al. (2014); Allred et al. (2016); however, in Sr1-xNaxFe2As2 the dome is more robust and occurs over a wider doping range at temperatures up to K Taddei et al. (2016); Wang et al. (2019), which is higher than has been observed in other compounds. This magnetic order is described as the collinear superposition of two itinerant SDW’s with nesting wavevector , leading to a double- SDW Avci et al. (2014); Allred et al. (2016) in which half the iron sites are nonmagnetic, and half have twice the moment measured in the orthorhombic AFM phase, oriented along the c axis Waßer et al. (2015); Mallett et al. (2015a); this is referred to as the magnetic phase because of its fourfold rotational invariance. This magnetic state is accompanied by a charge-density wave (CDW) with the charge coupling to the square of the magnetization, resulting in a charge-SDW (CSDW) Hoyer et al. (2016).
In this work, the complex optical properties and angle-resolved photoemission spectroscopy (ARPES), of Sr0.67Na0.33Fe2As2 have been investigated in the high-temperature tetragonal phase, as well as the magnetic and phases. The value of used in the current study is slightly below the optimal value of that bisects the dome in the Sr1-xNaxFe2As2 phase diagram Taddei et al. (2016). Based on transport studies, K, K, and K. In the high temperature tetragonal paramagnetic state, the optical response of the free-carriers is described by two Drude terms (Sec. IIIA); one strong and broad (large scattering rate), and the other weak and narrower (smaller scattering rate); as the temperature is reduced, the strength of the Drude terms show relatively little temperature dependence, while the scattering rates slowly decrease. Below , the Fermi surface reconstruction driven by the structural and magnetic transitions causes both the strength and the scattering rate for the broad Drude term to decrease dramatically; the missing spectral weight (the area under the conductivity curve) associated with the free carriers is transferred to a peak that emerges in the mid-infrared. The narrow Drude term actually increases slightly in strength below while narrowing. Below , in the magnetic phase, the broad Drude term again narrows and decreases in strength; while the strength of the narrow term does not appear to change, its scattering rate decreases dramatically. Based on the behavior of an infrared-active lattice mode, the presence of CSDW order likely results in the formation of a supercell resulting in zone folding, leading to a further reconstruction of the Fermi surface; while spectral weight is again transferred from the broad Drude to the midinfrared peak, a new low-energy peak emerges at meV. Below , there is a dramatic decrease in the low-frequency conductivity, signalling the formation of a superconducting energy gap. ARPES reveals several large hole pockets at the center of the Brillouin zone above , one of which shifts below the Fermi level below in the magnetic phase, a trend which continues below , suggesting that these bands may be related to the broad Drude response. At the corners of the Brillouin zone, there are both hole- and electron-like bands. Below and , several of these bands appear to split and shift, but it is not clear if there are any significant changes to the size of the associated Fermi surfaces, suggesting that some of these carriers may be related to the narrow Drude term; below the band splitting is likely responsible for the emergence of the low-energy peak. The structural and magnetic transitions from which the (SDW) and (double- SDW) phases emerge result in a Fermi surface reconstruction that has profound effects on the optical conductivity and electronic structure; however, the superfluid stiffness appears to be more or less unaffected by the CSDW order.
II Experiment
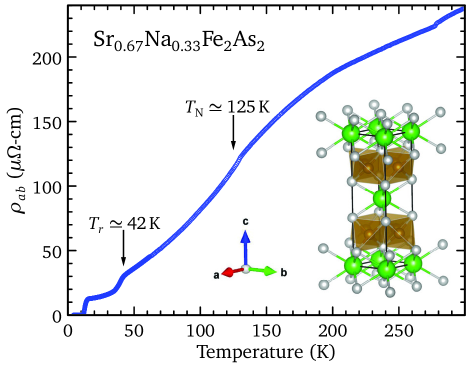
High-quality single crystals of Sr0.67Na0.33Fe2As2 with good cleavage planes (001) were synthesized using a self-flux technique Taddei et al. (2016); Guo et al. (2019). The temperature dependence of the in-plane resistivity, shown in Fig. 1, was measured using a standard four-probe configuration using a Quantum Design physical property measurement system; the unit cell for the high-temperature tetragonal phase is shown in the inset. The resistivity decreases gradually with temperature, showing a weak inflection point at K with a more pronounced decrease in the resistivity at K; the resistivity goes to zero below the superconducting transition at K. The reflectance from freshly-cleaved surfaces has been measured at a near-normal angle of incidence over a wide temperature ( to 300 K) and frequency range ( meV to about 5 eV) with Bruker IFS 113v and Vertex 80v Fourier transform spectrometers for light polarized in the a-b planes using an in situ evaporation technique Homes et al. (1993). The complex optical properties have been determined from a Kramers-Kronig analysis of the reflectivity. The reflectivity is shown in supplementary Fig. S1; the details of the Kramers-Kronig analysis are described in the Supplementary Material Sup . Temperature dependent ARPES measurements have been performed to track the evolution of the electron and hole pockets in the various phases. Measurements at BNL, which focused on the electronic structure near the center of the Brillouin zone, were performed using 21.2 eV light from a monochromator-filtered He I source (Omicron VUV5k) and a Scienta SES-R4000 electron spectrometer; emitted electrons were collected along the direction perpendicular to the light-surface mirror plane. Samples were cleaved at low temperature and measured in an ultrahigh vacuum with a base pressure better than mbar. Measurements at the National Laboratory for Superconductivity, Institute of Physics, Chinese Academy of Sciences, were performed using a 21.2 eV helium discharge lamp and a Scienta DA30L electron spectrometer. The latter’s overall energy resolution was 10 meV for Fermi surface mapping and 4 meV for the cuts; the angular resolution was . All the samples were cleaved at low temperature and measured in an ultrahigh vacuum with a base pressure better than mbar. Note that because uniaxial strain is not applied to the samples below , they will be heavily twinned, thus the optical and ARPES results represent an average of the a and b axis response in the magnetic phase.
III Results and Discussion
III.1 Optical properties
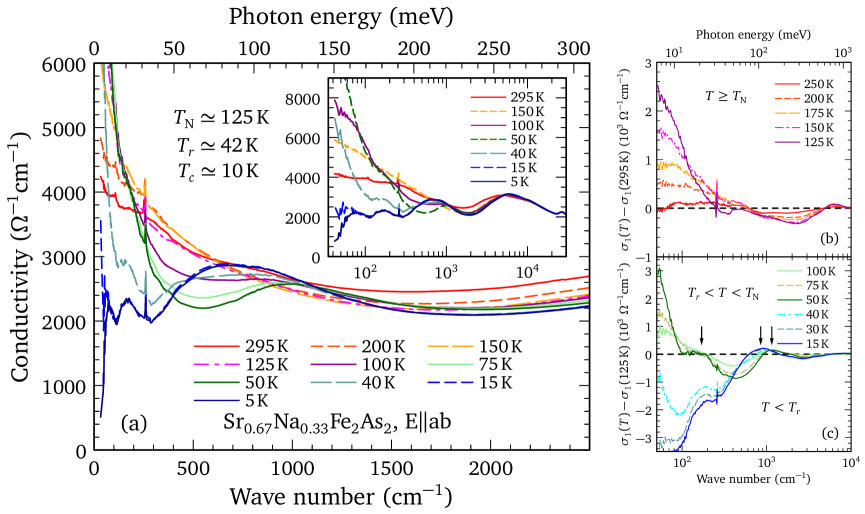
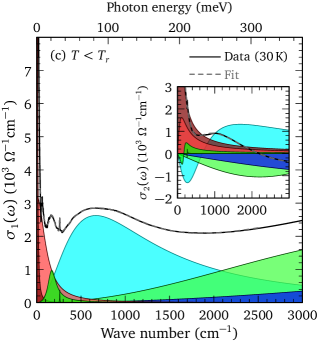
The temperature dependence of the real part of the in-plane optical conductivity [] of Sr0.67Na0.33Fe2As2 is shown in the infrared region in Fig. 2(a) (an additional plot of the optical conductivity is shown in supplementary Fig. S2). The character of the conductivity changes dramatically through the structural and magnetic transitions, which can be characterized by four distinct regions: (i) ; (ii) ; (iii) , and below the superconducting transition (iv) . The changes to the nature of the conductivity are shown as the difference plots , and , shown in Figs. 2(b) and 2(c), respectively.
At room temperature, the free-carrier response appears Drude-like (a Lorentzian centered at zero frequency with a scattering rate defined as the full width at half maximum), giving way to a flat response at higher frequencies, until the first interband transitions are encountered at about 1 eV. As the temperature is reduced, the scattering rate decreases and there is a slight reduction of the conductivity in the mid-infrared region as spectral weight is transferred from high to low frequency, which leads to an increase at low frequency and a decrease at high frequency in the difference spectra in Fig. 2(b). Below in the phase, the free-carrier response narrows dramatically and a peak-like structure emerges at about 950 cm-1, somewhat lower than a similar feature that was observed below at cm-1 in the parent compound SrFe2As2 Dai et al. (2016). This is illustrated by the upper three curves in Fig. 2(c) that show the continuing increase in the low-frequency conductivity, as well as the emergence of a peak in the mid-infrared region. Interestingly, below K, a low-energy peak at cm-1 begins to emerge. This behavior continues until , at which point the Drude-like response becomes extremely narrow in the phase, illustrated by the dramatic suppression of the low-frequency conductivity in the difference plot in Fig. 2(c), leaving clearly identifiable peaks at and 700 cm-1. Below K, there is a depletion of the low-frequency conductivity with the emergence of a shoulder-like structure around 70 cm-1 that signals the formation of a superconducting energy gap (supplementary Fig. S2).
The sharp feature observed in the conductivity at cm-1 is attributed to a normally infrared-active lattice vibration in the iron-arsenic planes; while this mode increases in frequency with decreasing temperature, it does not display the anomalous increase in oscillator strength below that was observed in the parent compound Homes et al. (2018). However, below there is evidence for a new satellite mode appearing at cm-1 (supplementary Fig. S3); a similar feature has also been observed in the phase of Ba1-xKxFe2As2 and is attributed to Brillouin-zone folding due to the formation of a supercell in the CSDW phase Mallett et al. (2015b).
Previous optical studies of the iron-arsenic materials recognized that these are multiband materials with hole and electron pockets at the center and corners of the Brillouin zone Singh (2008); Fink et al. (2009); a minimal description consists of two electronic subsystems using the so-called two-Drude model Wu et al. (2010). The complex dielectric function can be written as,
| (1) |
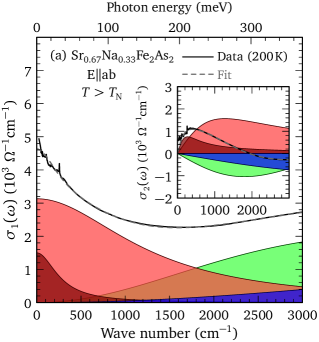
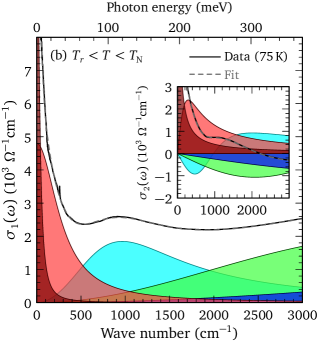
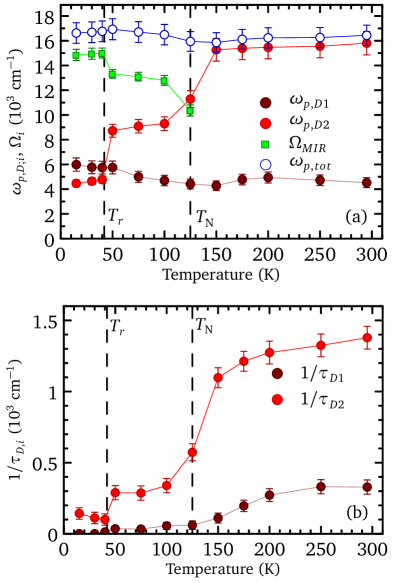
where is the real part at high frequency. In the first sum, and are the square of the plasma frequency and scattering rate for the delocalized (Drude) carriers in the th band, respectively, and and are the carrier concentration and effective mass. In the second summation, , and are the position, width, and strength of the th vibration or bound excitation. The complex conductivity is (in units of cm-1); is the impedance of free space. The model is fit to the real and imaginary parts of the optical conductivity simultaneously using a non-linear least-squares technique. The results of the fits are shown in Figs. 3(a), 3(b), and 3(c) at 200 K (), 75 K (), and 30 K (), respectively; the combined response has been decomposed into individual Drude and Lorentz components. In agreement with previous studies on the iron-based materials, the complex conductivity can be described by two Drude terms, one weak and narrow (D1), the other strong and broad (D2), as well as several Lorentzian oscillators. The temperature dependence of the plasma frequencies, the D1 and D2 components, as well as the strength of the mid-infrared (MIR) peak, are shown in Fig. 4(a); the temperature dependence of the scattering rates for the two Drude components is shown in Fig. 4(b).
III.1.1
At room temperature, the plasma frequencies for the narrow and broad Drude terms, cm-1 and cm-1, respectively, are slightly less than those of the undoped parent compound SrFe2As2 ( cm-1 and cm-1); however, the scattering rates of cm-1 and cm-1 are noticeably lower than the values of cm-1 and cm-1 observed in the undoped material Dai et al. (2016). This is somewhat surprising considering that in this material the layers in between the Fe–As sheets are disordered. While the plasma frequencies show little temperature dependence between room temperature and , the scattering rates for both Drude components decrease with temperature, with the narrow Drude decreasing from about to about 60 cm-1, and the broad Drude decreasing from cm-1 to about 1100 cm-1 just above .
III.1.2
Below in the magnetic phase, the plasma frequency for the narrow Drude increases slightly from to cm-1, while the scattering rate continues to decrease to cm-1 just above . The broad Drude displays much larger changes, with the plasma frequency decreasing from to cm-1, which corresponds to a decrease in carrier concentration of nearly 65% (); the scattering rate also drops dramatically from cm-1 just above to 300 cm-1 in the region. The dramatic loss of spectral weight of the broad Drude term is accompanied by the emergence of a new peak in the MIR region with position cm-1, width cm-1, and strength cm-1 [Fig. 3(b)]; the missing weight from the free carriers is transferred into this bound excitation, and accordingly the total spectral weight is defined as , is constant, as shown in Fig. 4(a). This behavior is similar to what was previously observed in the parent compound, and has been explained as the partial gapping of the pocket responsible for the broad Drude term due and the appearance of a low-energy interband transition Yin et al. (2011); Dai et al. (2016).
III.1.3
As the temperature is reduced the system undergoes a further magnetic and structural transition at K and enters the magnetic phase. Below the plasma frequency for the narrow Drude term appears to actually increase slightly; however, this is accompanied by a dramatic collapse of cm-1 just above to a value of cm-1 at 15 K; this is nearly an order of magnitude smaller than what is observed in the parent compound Dai et al. (2016). Consequently, the narrow Drude is no longer observable in , leaving a relatively flat optical conductivity due to the broad Drude term and Lorentzian components; instead, its effects are determined from [shown in the inset of Fig. 3(c)]. The plasma frequency of the broad Drude term continues to decrease from to about cm-1 at 15 K, a further 80% reduction in the carrier concentration associated with this pocket, and over 90% from the room temperature value; this is comparable to what was observed in the parent compound for Dai et al. (2016). In addition, the scattering rate decreases from cm-1 at to cm-1 at 15 K. At the same time, the peak at cm-1 shifts down to about cm-1; while the width decreases slightly to cm-1, the strength of this feature increases to cm-1. However, continues to be conserved, indicating that the loss of spectral weight associated with the free carriers in the broad Drude term has been transferred to this peak.
III.1.4
Below K there is a dramatic suppression of the low-frequency conductivity, signalling the formation of a superconducting energy gap [Fig. 2(a) and supplementary Fig. S2]. Although the low-frequency data is somewhat limited, a comparison of the optical conductivity for and allows the superfluid density, , where is the superconducting plasma frequency, to be determined from the missing spectral weight, calculated using the Ferrell-Glover-Tinkham (FGT) sum rule Ferrell and Glover (1958); Tinkham and Ferrell (1959). The FGT sum rule converges to cm-1, which corresponds to a superconducting penetration depth of Å at 5 K, comparable to the K-doped material Mallett et al. (2015a); however, because the lowest temperature obtained was only , it is almost certain that is underestimated. From Fig. 2(a) and supplementary Fig. S2, the characteristic energy scale for the superconducting energy gap is about cm-1. In the narrow Drude band, , placing this material in the clean limit; as a result, most of the weight in the condensate will come from this band. In the broad Drude band, , placing this band in the dirty limit; consequently, only a small fraction of the weight in this band will collapse into the condensate. This is another example of a multiband iron-based superconductor that is simultaneously in both the clean and dirty limits Homes et al. (2015). One of the interesting properties of this material is its relatively low resistivity just above , cm, or [Fig 1]. These values place this material just below the universal scaling line Homes et al. (2004, 2005a, 2005b), in close proximity to other doped “122” superconductors, as well as many cuprate materials Tu et al. (2010).
III.2 Low-energy peak
The dramatic collapse of the scattering rate below of the narrow Drude allows a new low-energy peak at cm-1, with width cm-1 and oscillator strength of cm-1, to be observed [Figs. 2(a), 3(c), and supplementary Fig. S2]. This is close to where a peak was observed in (CaFe1-xPtxAs)10Pt3As8 for at cm-1 Yang et al. (2019); that feature was attributed to a localization process due to impurity scattering described by a classical generalization of the Drude model Smith (2001),
| (2) |
where is the persistence of velocity that is retained for a single collision. The scattering rate for the narrow Drude is far too small to yield a peak at the experimentally-observed position, while the broad Drude predicts a localization peak at cm-1, well below the experimentally-observed value of cm-1 111Replacing the broad Drude term with the expression in Eq. (2) and fitting to the real and imaginary parts of the optical conductivity using a non-linear least-squares technique yields cm-1, cm-1, and . The plasma frequency is larger because it now describes both the localized as well as free carriers; .. Thus, it is likely that the low-energy peak originates from a further reconstruction of the Fermi surface in the phase rather than any sort of localization process. Indeed, a remarkably similar peak has also been observed to emerge at cm-1 in the optical conductivity of underdoped Ba1-xKxFe2As2 at low temperature Dai et al. (2012); this feature may also be a related to the magnetic phase observed in that compound.
III.3 ARPES
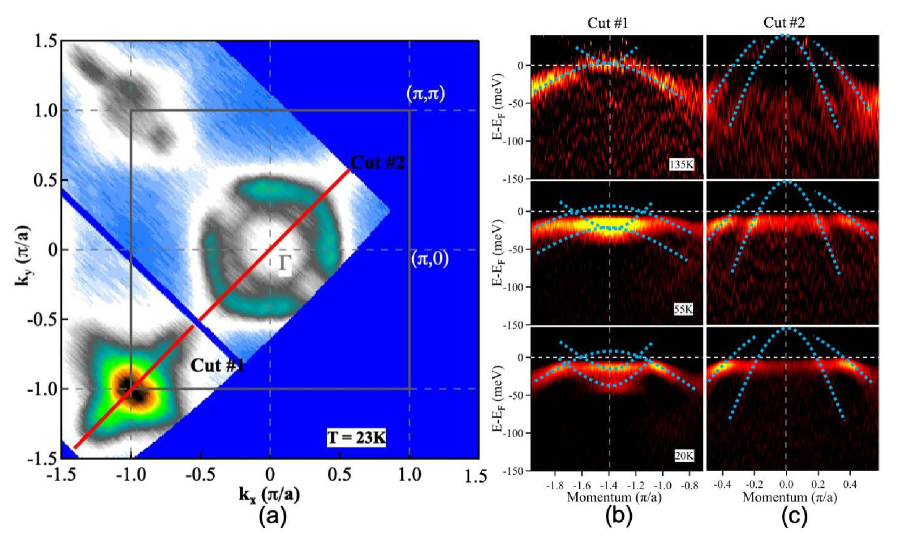
A simple density functional theory calculation of SrFe2As2 in the paramagnetic high-temperature tetragonal phase reveals a familiar band structure consisting of three hole-like pockets at the center of the Brillouin zone (), and two electron-like pockets at the corners (M); the orbital character is primarily Fe in nature (shown in supplementary Fig. S4, details of the calculation are discussed in the Supplementary Material.) The Fermi surface of Sr0.67Na0.33Fe2As2, with the spectral weight integrated within a meV energy window with respect to the Fermi level, is shown below in the magnetic phase at 23 K, in Fig. 5(a). Two momentum cuts have been made along the path; the first examines the temperature dependence of the anisotropic electron-like bands around an M point, Fig. 5(b), and the second details the behavior of the isotropic hole-like pockets around the point, shown in Fig. 5(c). This Fermi surface is qualitatively similar to what was observed in Ba1-xKxFe2As2 Zabolotnyy et al. (2009); Derondeau et al. (2017)
At high temperature, the cut along the direction at the M point there appears to be a hole-like band as well as a possible electron-like band at 135 K, shown in the upper panel of Fig. 5(b). In the simple picture for the Fermi surface of SrFe2As2 (supplementary Fig. S4) this result can be reproduced by lowering the Fermi level by about 0.2 eV, which is consistent with the removal of electrons due to sodium substitution (hole doping). As the temperature is lowered below and enters the magnetic phase, the hole-like band may split, while the electron-like band appears to shift below . Below in the magnetic phase, a single hole-like band is recovered, while the electron-like band now appears to be split into two bands, with a separation of meV, which is comparable to the position of the low-energy peak (this behavior is explored further in supplementary Fig. S5).
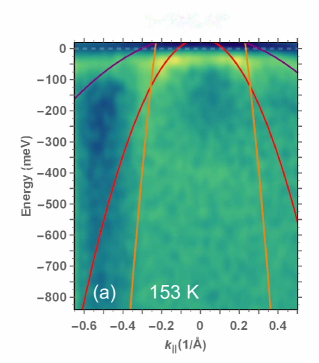
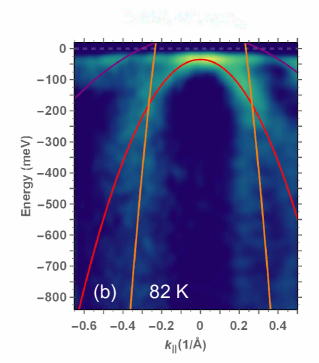
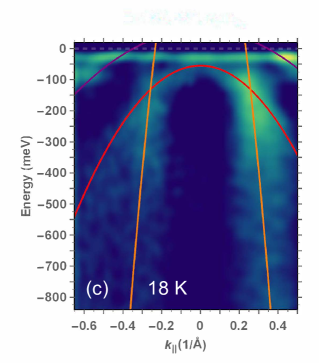
The initial investigation into the temperature dependence of the energy bands around the point in Fig. 5(c) revealed two large hole pockets at the Fermi level, but relatively little temperature dependence. This prompted a more detailed investigation of the hole-like bands along the path, shown in Fig. 6 (further detail is provided in supplementary Figs. S6 and S7). Above the bands are rather broad, but at least three bands may be resolved, all of which cross the Fermi level, resulting in several large hole-like Fermi surfaces, shown in the second-derivative curves in Fig. 6(a). Below the bands sharpen considerably in the phase, and one of the bands is observed to shift to meV below the Fermi level, shown in Fig. 6(b), leading to the removal of a hole-like Fermi surface; this is consistent with the Fermi surface reconstruction below observed in the parent compounds Yi et al. (2009); Yin et al. (2011). This trend continues in the magnetic phase, with the band shifting to meV below the Fermi level, Fig. 6(c).
III.4 Discussion
Both the electron and hole pockets appear to undergo significant changes in response to the Fermi surface reconstruction in the magnetic and phases that exhibit SDW and CSDW order, respectively. In the case of the hole pockets, the fact that one of the bands shifts below below in the magnetic phase, shifting further below in the magnetic phase, signals the decrease in the size of the Fermi surface associated with the hole pockets. It is possible that this may be related to the dramatic decrease in the spectral weight of the broad Drude component as described by the plasma frequency in Fig. 4(a); from we infer a significant decrease in the carriers associated with the hole pockets at low temperature (% reduction of the room temperature value).
The evolution of the electron-like bands is more complicated, as the bands at the M point have both electron- and hole-like character. The initial splitting of the hole-like band below is consistent with the lifting of the degeneracy between the and orbitals; however, the fact that one of the hole-like bands lies completely below the Fermi level suggests no significant changes to the size of the Fermi surfaces. Below the orbital degeneracy is restored, but the presence of CSDW order leads to the formation of a supercell; the electron-like bands are split as a result of zone-folding, which may lead to an increase in the size of the Fermi surface. This is consistent with the slight increase in the plasma frequency of the narrow Drude component at low temperature, shown in Fig. 4(a). Furthermore, the splitting between the two electron-like bands of meV, is very close to the position of the low-energy peak. This suggests that, similar to the mid-infrared peak, the low-energy peak emerges in response to the Fermi surface reconstruction driven by the magnetic phase and the CSDW order at low temperature Yi et al. (2018).
IV Summary
The ARPES and complex optical properties of freshly-cleaved surfaces of the iron-based superconductor Sr0.67Na0.33Fe2As2 have been determined for light polarized in the iron-arsenic (a-b) planes at a variety of temperatures for the room temperature tetragonal paramagnetic phase, the orthorhombic SDW magnetic phase, the tetragonal double- SDW (CSDW) phase, as well as below in the superconducting state. The free-carrier response is described by two Drude components, one broad and strong, the other narrow and weak. The strength of the narrow component shows little temperature dependence, increasing slightly in strength at low temperature, while narrowing dramatically. The broad Drude component decreases dramatically in strength and narrows below at the same time a peak emerges in the mid-infrared; the decrease in the spectral weight associated with the free carriers is transferred into the emergent peak. Below , this trend continues, with the emergence of a new low-energy peak at meV. The appearance of a new infrared-active mode in the Fe–As planes below is attributed to zone-folding due to the formation of a supercell in response to the CSDW; this suggests that the low-energy peak originates from a further Fermi surface reconstruction in the phase. Below the low-frequency conductivity decreases dramatically, signalling the formation of a superconducting energy gap. ARPES reveals large hole-like Fermi surfaces at the point, one of which is apparently removed below the structural and magnetic transitions, suggesting that they may be related to the behavior of the broad Drude component. The electron- and hole-like bands at the corners of the Brillouin zone shift and split below and , but the Fermi surfaces do not appear to undergo any significant change in size, suggesting they may be related to the narrow Drude component; the apparent splitting of the electron-like bands in the phase would appear to explain the emergence of the low-energy peak at meV in the optical conductivity. While the and magnetic transitions, with resulting SDW and CSDW order, respectively, lead to a significant reconstruction of the Fermi surface that has profound implications for the transport originating from the electron- and hole-like pockets, they appear to have relatively little impact on the superconductivity in this material.
Acknowledgements.
Work at Chinese Academy of Science was supported by NSFC (Project Nos. 11774400, 11888101, and 11974412) and MOST (Project Nos. 2015CB921102, 2016YFA0300300, and 2017YFA0302903). Work at HPSTAR was supported by NSAF, Grant No. U1530402. Work at Brookhaven National Laboratory was supported by the Office of Science, U.S. Department of Energy under Contract No. DE-SC0012704.References
- Johnston (2010) David C. Johnston, “The puzzle of high temperature superconductivity in layered iron pnictides and chalcogenides,” Adv. Phys. 59, 803–1061 (2010).
- Paglione and Greene (2010) Johnpierre Paglione and Richard L. Greene, “High-temperature superconductivity in iron-based materials,” Nat. Phys. 6, 645–658 (2010).
- Canfield and Bud’ko (2010) Paul C. Canfield and Sergey L. Bud’ko, “FeAs-Based Superconductivity: A Case Study of the Effects of Transition Metal Doping on BaFe2As2,” Ann. Rev. Cond. Mat. Phys. 1, 27–50 (2010).
- Si et al. (2016) Qimiao Si, Rong Yu, and Elihu Abrahams, “High-temperature superconductivity in iron pnictides and chalcogenides,” Nat. Rev. Mater. 1, 16017 (2016).
- Dean et al. (2012) M. P. M. Dean, M. G. Kim, A. Kreyssig, J. W. Kim, X. Liu, P. J. Ryan, A. Thaler, S. L. Bud’ko, W. Strassheim, P. C. Canfield, J. P. Hill, and A. I. Goldman, “Magnetically polarized Ir dopant atoms in superconducting Ba(Fe1-xIrx)2As2,” Phys. Rev. B 85, 140514(R) (2012).
- Dai (2015) Pengcheng Dai, “Antiferromagnetic order and spin dynamics in iron-based superconductors,” Rev. Mod. Phys. 87, 855–896 (2015).
- Moroni et al. (2017) M. Moroni, P. Carretta, G. Allodi, R. De Renzi, M. N. Gastiasoro, B. M. Andersen, P. Materne, H.-H. Klauss, Y. Kobayashi, M. Sato, and S. Sanna, “Fast recovery of the stripe magnetic order by Mn/Fe substitution in F-doped LaFeAsO superconductors,” Phys. Rev. B 95, 180501(R) (2017).
- Kreyssig et al. (2018) A. Kreyssig, J. M. Wilde, A. E. Böhmer, W. Tian, W. R. Meier, Bing Li, B. G. Ueland, Mingyu Xu, S. L. Bud’ko, P. C. Canfield, R. J. McQueeney, and A. I. Goldman, “Antiferromagnetic order in CaK(Fe1-xNix)4As4 and its interplay with superconductivity,” Phys. Rev. B 97, 224521 (2018).
- Meier et al. (2018) William R. Meier, Qing-Ping Ding, Andreas Kreyssig, Sergey L. Bud’ko, Aashish Sapkota, Karunakar Kothapalli, Vladislav Borisov, Roser Valentí, Cristian D. Batista, Peter P. Orth, Rafael M. Fernandes, Alan I. Goldman, Yuji Furukawa, Anna E. Böhmer, and Paul C. Canfield, “Hedgehog spin-vortex crystal stabilized in a hole-doped iron-based superconductor,” npj Quantum Materials 3, 5 (2018).
- Rotter et al. (2008) Marianne Rotter, Marcus Tegel, and Dirk Johrendt, “Superconductivity at 38 K in the Iron Arsenide (Ba1-xKx)Fe2As2,” Phys. Rev. Lett. 101, 107006 (2008).
- Sefat et al. (2008) Athena S. Sefat, Rongying Jin, Michael A. McGuire, Brian C. Sales, David J. Singh, and David Mandrus, “Superconductivity at 22 K in Co-Doped BaFe2As2 Crystals,” Phys. Rev. Lett. 101, 117004 (2008).
- Ni et al. (2008) N. Ni, M. E. Tillman, J.-Q. Yan, A. Kracher, S. T. Hannahs, S. L. Bud’ko, and P. C. Canfield, “Effects of Co substitution on thermodynamic and transport properties and anisotropic in Ba(Fe1-xCox)2As2 single crystals,” Phys. Rev. B 78, 214515 (2008).
- Sasmal et al. (2008) Kalyan Sasmal, Bing Lv, Bernd Lorenz, Arnold M. Guloy, Feng Chen, Yu-Yi Xue, and Ching-Wu Chu, “Superconducting Fe-Based Compounds (Srx)Fe2As2 with K and Cs with Transition Temperatures up to 37 K,” Phys. Rev. Lett. 101, 107007 (2008).
- Chen et al. (2008) Gen-Fu Chen, Zheng Li, Gang Li, Wan-Zheng Hu, Jing Dong, Xiao-Dong Zhang Jun Zhou, Ping Zheng, Nan-Lin Wang, and Jian-Lin Luo, “Superconductivity in Hole-Doped (Sr1-xKx)Fe2As2,” Chin. Phys. Lett. 25, 3403 (2008).
- Chu et al. (2009) Jiun-Haw Chu, James G. Analytis, Chris Kucharczyk, and Ian R. Fisher, “Determination of the phase diagram of the electron-doped superconductor Ba(Fe1-xCox)2As2,” Phys. Rev. B 79, 014506 (2009).
- Goko et al. (2009) T. Goko, A. A. Aczel, E. Baggio-Saitovitch, S. L. Bud’ko, P. C. Canfield, J. P. Carlo, G. F. Chen, Pengcheng Dai, A. C. Hamann, W. Z. Hu, H. Kageyama, G. M. Luke, J. L. Luo, B. Nachumi, N. Ni, D. Reznik, D. R. Sanchez-Candela, A. T. Savici, K. J. Sikes, N. L. Wang, C. R. Wiebe, T. J. Williams, T. Yamamoto, W. Yu, and Y. J. Uemura, “Superconducting state coexisting with a phase-separated static magnetic order in (Ba,K)Fe2As2, (Sr,Na)Fe2As2, and CaFe2As2,” Phys. Rev. B 80, 024508 (2009).
- Saha et al. (2009) S. R. Saha, N. P. Butch, K. Kirshenbaum, and Johnpierre Paglione, “Evolution of bulk superconductivity in SrFe2As2 with Ni substitution,” Phys. Rev. B 79, 224519 (2009).
- Jiang et al. (2009) Shuai Jiang, Hui Xing, Guofang Xuan, Cao Wang, Zhi Ren, Chunmu Feng, Jianhui Dai, Zhu’an Xu, and Guanghan Cao, “Superconductivity up to 30 K in the vicinity of the quantum critical point in BaFe2(As1-xPx)2,” J. Phys.: Condens. Matter 21, 382203 (2009).
- Shi et al. (2010) H. L. Shi, H. X. Yang, H. F. Tian, J. B. Lu, Z. W. Wang, Y. B. Qin, Y. J. Song, and J. Q. Li, “Structural properties and superconductivity of SrFe2As2-xPx and () and CaFe2As2-yPy (),” J. Phys.: Condens. Matter 22, 125702 (2010).
- Cortes-Gil and Clarke (2011) Raquel Cortes-Gil and Simon J. Clarke, “Structure, Magnetism, and Superconductivity of the Layered Iron Arsenides Sr1-xNaxFe2As2,” Chem. Mater. 23, 1009–1016 (2011).
- Ishikawa et al. (2009) Fumihiro Ishikawa, Naoya Eguchi, Michihiro Kodama, Koji Fujimaki, Mari Einaga, Ayako Ohmura, Atsuko Nakayama, Akihiro Mitsuda, and Yuh Yamada, “Zero-resistance superconducting phase in BaFe2As2 under high pressure,” Phys. Rev. B 79, 172506 (2009).
- Alireza et al. (2009) Patricia L. Alireza, Y. T. Chris Ko, Jack Gillett, Chiara M. Petrone, Jacqui M. Cole, Suchitra E. Sebastian, and Gilbert G. Lonzarich, “Superconductivity up to 29 K in SrFe2As2 and BaFe2As2 at high pressures,” J. Phys: Cond. Matter 21, 012208 (2009).
- Colombier et al. (2009) E. Colombier, S. L. Bud’ko, N. Ni, and P. C. Canfield, “Complete pressure-dependent phase diagrams for SrFe2As2 and BaFe2As2,” Phys. Rev. B 79, 224518 (2009).
- Kitagawa et al. (2009) K. Kitagawa, N. Katayama, H. Gotou, T. Yagi, K. Ohgushi, T. Matsumoto, Y. Uwatoko, and M. Takigawa, “Spontaneous Formation of a Superconducting and Antiferromagnetic Hybrid State in SrFe2As2 under High Pressure,” Phys. Rev. Lett. 103, 257002 (2009).
- Tegel et al. (2008) Marcus Tegel, Marianne Rotter, Veronika Wei, Falko M Schappacher, Rainer Pöttgen, and Dirk Johrendt, “Structural and magnetic phase transitions in the ternary iron arsenides SrFe2As2 and EuFe2As2,” J. Phys.: Condens. Matter 20, 452201 (2008).
- Yan et al. (2008) J.-Q. Yan, A. Kreyssig, S. Nandi, N. Ni, S. L. Bud’ko, A. Kracher, R. J. McQueeney, R. W. McCallum, T. A. Lograsso, A. I. Goldman, and P. C. Canfield, “Structural transition and anisotropic properties of single-crystalline SrFe2As2,” Phys. Rev. B 78, 024516 (2008).
- Zhao et al. (2008) Jun Zhao, W. Ratcliff, J. W. Lynn, G. F. Chen, J. L. Luo, N. L. Wang, Jiangping Hu, and Pengcheng Dai, “Spin and lattice structures of single-crystalline SrFe2As2,” Phys. Rev. B 78, 140504(R) (2008).
- Hu et al. (2008) W. Z. Hu, J. Dong, G. Li, Z. Li, P. Zheng, G. F. Chen, J. L. Luo, and N. L. Wang, “Origin of the Spin Density Wave Instability in AFe2As2 (ABa, Sr) as Revealed by Optical Spectroscopy,” Phys. Rev. Lett. 101, 257005 (2008).
- Hancock et al. (2010) J. N. Hancock, S. I. Mirzaei, J. Gillett, S. E. Sebastian, J. Teyssier, R. Viennois, E. Giannini, and D. van der Marel, “Strong coupling to magnetic fluctuations in the charge dynamics of iron-based superconductors,” Phys. Rev. B 82, 014523 (2010).
- Blomberg et al. (2011) E. C. Blomberg, M. A. Tanatar, A. Kreyssig, N. Ni, A. Thaler, Rongwei Hu, S. L. Bud’ko, P. C. Canfield, A. I. Goldman, and R. Prozorov, “In-plane anisotropy of electrical resistivity in strain-detwinned SrFe2As2,” Phys. Rev. B 83, 134505 (2011).
- Tanatar et al. (2009) M. A. Tanatar, A. Kreyssig, S. Nandi, N. Ni, S. L. Bud’ko, P. C. Canfield, A. I. Goldman, and R. Prozorov, “Direct imaging of the structural domains in the iron pnictides ,” Phys. Rev. B 79, 180508(R) (2009).
- Fisher et al. (2011) I. R. Fisher, L. Degiorgi, and Z. X. Shen, “In-plane electronic anisotropy of underdoped ‘122’ Fe-arsenide superconductors revealed by measurements of detwinned single crystals,” Rep. Prog. Phys. 74, 124506 (2011).
- Goldman et al. (2008) A. I. Goldman, D. N. Argyriou, B. Ouladdiaf, T. Chatterji, A. Kreyssig, S. Nandi, N. Ni, S. L. Bud’ko, P. C. Canfield, and R. J. McQueeney, “Lattice and magnetic instabilities in CaFe2As2: A single-crystal neutron diffraction study,” Phys. Rev. B 78, 100506(R) (2008).
- Kofu et al. (2009) M. Kofu, Y. Qiu, Wei Bao, S.-H. Lee, S. Chang, T. Wu, G. Wu, and X. H. Chen, “Neutron scattering investigation of the magnetic order in single crystalline BaFe2As2,” New J. Phys. 11, 055001 (2009).
- Kim et al. (2010) M. G. Kim, A. Kreyssig, A. Thaler, D. K. Pratt, W. Tian, J. L. Zarestky, M. A. Green, S. L. Bud’ko, P. C. Canfield, R. J. McQueeney, and A. I. Goldman, “Antiferromagnetic ordering in the absence of structural distortion in Ba(Fe1-xMnx)2As2,” Phys. Rev. B 82, 220503(R) (2010).
- Hassinger et al. (2012) E. Hassinger, G. Gredat, F. Valade, S. René de Cotret, A. Juneau-Fecteau, J.-Ph. Reid, H. Kim, M. A. Tanatar, R. Prozorov, B. Shen, H.-H. Wen, N. Doiron-Leyraud, and Louis Taillefer, “Pressure-induced Fermi-surface reconstruction in the iron-arsenide superconductor Ba1-xKxFe2As2: Evidence of a phase transition inside the antiferromagnetic phase,” Phys. Rev. B 86, 140502(R) (2012).
- Böhmer et al. (2015) A. E. Böhmer, F. Hardy, L. Wang, T. Wolf, P. Schweiss, and C. Meingast, “Superconductivity-induced re-entrance of the orthorhombic distortion in Ba1-xKxFe2As2,” Nat. Commun. 6, 7911 (2015).
- Wang et al. (2016) L. Wang, F. Hardy, A. E. Böhmer, T. Wolf, P. Schweiss, and C. Meingast, “Complex phase diagram of Ba1-xNaxFe2As2: A multitude of phases striving for the electronic entropy,” Phys. Rev. B 93, 014514 (2016).
- Taddei et al. (2016) K. M. Taddei, J. M. Allred, D. E. Bugaris, S. Lapidus, M. J. Krogstad, R. Stadel, H. Claus, D. Y. Chung, M. G. Kanatzidis, S. Rosenkranz, R. Osborn, and O. Chmaissem, “Detailed magnetic and structural analysis mapping a robust magnetic dome in Sr1-xNaxFe2As2,” Phys. Rev. B 93, 134510 (2016).
- Wang et al. (2019) Liran Wang, Mingquan He, Daniel D. Scherer, Frédéric Hardy, Peter Schweiss, Thomas Wolf, Michael Merz, Brian M. Andersen, and Christoph Meingast, “Competing Electronic Phases near the Onset of Superconductivity in Hole-doped SrFe2As2,” J. Phys. Soc. Jpn. 88, 104710 (2019).
- Hassinger et al. (2016) E. Hassinger, G. Gredat, F. Valade, S. René de Cotret, O. Cyr-Choinière, A. Juneau-Fecteau, J.-Ph. Reid, H. Kim, M. A. Tanatar, R. Prozorov, B. Shen, H.-H. Wen, N. Doiron-Leyraud, and Louis Taillefer, “Expansion of the tetragonal magnetic phase with pressure in the iron arsenide superconductor Ba1-xKxFe2As2,” Phys. Rev. B 93, 144401 (2016).
- Taddei et al. (2017) K. M. Taddei, J. M. Allred, D. E. Bugaris, S. H. Lapidus, M. J. Krogstad, H. Claus, D. Y. Chung, M. G. Kanatzidis, R. Osborn, S. Rosenkranz, and O. Chmaissem, “Observation of the magnetic phase in Ca1-xNaxFe2As2 and its universality in the hole-doped 122 superconductors,” Phys. Rev. B 95, 064508 (2017).
- Yi et al. (2018) M. Yi, A. Frano, D. H. Lu, Y. He, Meng Wang, B. A. Frandsen, A. F. Kemper, R. Yu, Q. Si, L. Wang, M. He, F. Hardy, P. Schweiss, P. Adelmann, T. Wolf, M. Hashimoto, S.-K. Mo, Z. Hussain, M. Le Tacon, A. E. Böhmer, D.-H. Lee, Z.-X. Shen, C. Meingast, and R. J. Birgeneau, “Spectral Evidence for Emergent Order in Ba1-xNaxFe2As2,” Phys. Rev. Lett. 121, 127001 (2018).
- Avci et al. (2014) S. Avci, O. Chmaissem, J. M. Allred, S. Rosenkranz, I. Eremin, A. V. Chubukov, D. E. Bugaris, D. Y. Chung, M. G. Kanatzidis, J.-P Castellan, J. A. Schlueter, H. Claus, D. D. Khalyavin, P. Manuel, A. Daoud-Aladine, and R. Osborn, “Magnetically driven suppression fo nematic order in an iron-based superconductor,” Nat. Commun. 5, 3845 (2014).
- Allred et al. (2016) J. M. Allred, K. M. Taddei, D. E. Bugaris, M. J. Krogstad, S. H. Lapidus, D. Y. Chung, H. Claus, M. G. Kanatzidis, D. E. Brown, J. Kang, R. M. Fernandes, I. Eremin, S. Rosenkranz, O. Chmaissem, and R. Osborn, “Double-Q spin-density wave in iron arsenide superconductors,” Nat. Phys. 12, 493 (2016).
- Waßer et al. (2015) F. Waßer, A. Schneidewind, Y. Sidis, S. Wurmehl, S. Aswartham, B. Büchner, and M. Braden, “Spin reorientation in Ba0.65Na0.35Fe2As2 studied by single-crystal neutron diffraction,” Phys. Rev. B 91, 060505(R) (2015).
- Mallett et al. (2015a) B. P. P. Mallett, Yu. G. Pashkevich, A. Gusev, Th. Wolf, and C. Bernhard, “Muon spin rotation study of the magnetic structure in the tetragonal antiferromagnetic state of weakly underdoped Ba1-xKxFe2As2,” EPL (Europhysics Letters) 111, 57001 (2015a).
- Hoyer et al. (2016) Mareike Hoyer, Rafael M. Fernandes, Alex Levchenko, and Jörg Schmalian, “Disorder-promoted -symmetric magnetic order in iron-based superconductors,” Phys. Rev. B 93, 144414 (2016).
- Guo et al. (2019) Jianqing Guo, Li Yue, Kazuki Iida, Kazuya Kamazawa, Lei Chen, Tingting Han, Yan Zhang, and Yuan Li, “Preferred magnetic excitations in the iron-based Sr1-xNaxFe2As2 superconductor,” Phys. Rev. Lett. 122, 017001 (2019).
- Homes et al. (1993) Christopher C. Homes, M. Reedyk, D. A. Crandles, and T. Timusk, “Technique for measuring the reflectance of irregular, submillimeter-sized samples,” Appl. Opt. 32, 2976–2983 (1993).
- (51) See Supplemental Material at [URL will be inserted by publisher] for details of the experimental reflectivity and Kramers-Kronig analysis, which includes Refs. Wooten, 1972; Dressel and Grüner, 2001; Singh, 1994, 1991; Wie, .
- Dai et al. (2016) Y. M. Dai, Ana Akrap, S. L. Bud’ko, P. C. Canfield, and C. C. Homes, “Optical properties of Fe2As2 (Ca, Sr, and Ba) single crystals,” Phys. Rev. B 94, 195142 (2016).
- Homes et al. (2018) C. C. Homes, Y. M. Dai, Ana Akrap, S. L. Bud’ko, and P. C. Canfield, “Vibrational anomalies in Fe2As2 (Ca, Sr, and Ba) single crystals,” Phys. Rev. B 98, 035103 (2018).
- Mallett et al. (2015b) B. P. P. Mallett, P. Marsik, M. Yazdi-Rizi, Th. Wolf, A. E. Böhmer, F. Hardy, C. Meingast, D. Munzar, and C. Bernhard, “Infrared Study of the Spin Reorientation Transition and Its Reversal in the Superconducting State in Underdoped Ba1-xKxFe2As2,” Phys. Rev. Lett. 115, 027003 (2015b).
- Singh (2008) D. J. Singh, “Electronic structure and doping in BaFe2As2 and LiFeAs: Density functional calculations,” Phys. Rev. B 78, 094511 (2008).
- Fink et al. (2009) J. Fink, S. Thirupathaiah, R. Ovsyannikov, H. A. Dürr, R. Follath, Y. Huang, S. de Jong, M. S. Golden, Yu-Zhong Zhang, H. O. Jeschke, R. Valentí, C. Felser, S. Dastjani Farahani, M. Rotter, and D. Johrendt, “Electronic structure studies of BaFe2As2 by angle-resolved photoemission spectroscopy,” Phys. Rev. B 79, 155118 (2009).
- Wu et al. (2010) D. Wu, N. Barišić, P. Kallina, A. Faridian, B. Gorshunov, N. Drichko, L. J. Li, X. Lin, G. H. Cao, Z. A. Xu, N. L. Wang, and M. Dressel, “Optical investigations of the normal and superconducting states reveal two electronic subsystems in iron pnictides,” Phys. Rev. B 81, 100512(R) (2010).
- Yin et al. (2011) Z. P. Yin, K. Haule, and G. Kotliar, “Magnetism and charge dynamics in iron pnictides,” Nat. Phys. 7, 294–297 (2011).
- Ferrell and Glover (1958) Richard A. Ferrell and Rolfe E. Glover, “Conductivity of Superconducting Films: A Sum Rule,” Phys. Rev. 109, 1398–1399 (1958).
- Tinkham and Ferrell (1959) M. Tinkham and R. A. Ferrell, “Determination of the Superconducting Skin Depth from the Energy Gap and Sum Rule,” Phys. Rev. Lett. 2, 331–333 (1959).
- Homes et al. (2015) C. C. Homes, Y. M. Dai, J. S. Wen, Z. J. Xu, and G. D. Gu, “FeTe0.55Se0.45: A multiband superconductor in the clean and dirty limit,” Phys. Rev. B 91, 144503 (2015).
- Homes et al. (2004) C. C. Homes, S. V. Dordevic, M. Strongin, D. A. Bonn, Ruixing Liang, W. N. Hardy, Seiki Komiya, Yoichi Ando, G. Yu, N. Kaneko, X. Zhao, M. Greven, D. N. Basov, and T. Timusk, “Universal scaling relation in high-temperature superconductors,” Nature (London) 430, 539 (2004).
- Homes et al. (2005a) C. C. Homes, S. V. Dordevic, D. A. Bonn, Ruixing Liang, W. N. Hardy, and T. Timusk, “Coherence, incoherence, and scaling along the axis of YBa2Cu3O6+x,” Phys. Rev. B 71, 184515 (2005a).
- Homes et al. (2005b) C. C. Homes, S. V. Dordevic, T. Valla, and M. Strongin, “Scaling of the superfluid density in high-temperature superconductors,” Phys. Rev. B 72, 134517 (2005b).
- Tu et al. (2010) J. J. Tu, J. Li, W. Liu, A. Punnoose, Y. Gong, Y. H. Ren, L. J. Li, G. H. Cao, Z. A. Xu, and C. C. Homes, “Optical properties of the iron arsenic superconductor BaFe1.85Co0.15As2,” Phys. Rev. B 82, 174509 (2010).
- Yang et al. (2019) Run Yang, Yaomin Dai, Jia Yu, Qiangtao Sui, Yongqing Cai, Zhian Ren, Jungseek Hwang, Hong Xiao, Xingjiang Zhou, Xianggang Qiu, and Christopher C. Homes, “Unravelling the mechanism of the semiconducting-like behavior and its relation to superconductivity in ,” Phys. Rev. B 99, 144520 (2019).
- Smith (2001) N. V. Smith, “Classical generalization of the Drude formula for the optical conductivity,” Phys. Rev. B 64, 155106 (2001).
- Note (1) Replacing the broad Drude term with the expression in Eq. (2) and fitting to the real and imaginary parts of the optical conductivity using a non-linear least-squares technique yields cm-1, cm-1, and . The plasma frequency is larger because it now describes both the localized as well as free carriers; .
- Dai et al. (2012) Y. M. Dai, B. Xu, B. Shen, H. H. Wen, J. P. Hu, X. G. Qiu, and R. P. S. M. Lobo, “Pseudogap in underdoped Ba1-xKxFe2As2 as seen via optical conductivity,” Phys. Rev. B 86, 100501(R) (2012).
- Zabolotnyy et al. (2009) V. B. Zabolotnyy, D. S. Inosov, D. V. Evtushinsky, A. Koitzsch, A. A. Kordyuk, G. L. Sun, J. T. Park, D. Haug, V. Hinkov, A. V. Boris, C. T. Lin, M. Knupfer, A. N. Yaresko, B. Büchner, A. Varykhalov, R. Follath, and S. V. Borisenko, “ electronic order in iron arsenide superconductors,” Nature 457, 569–572 (2009).
- Derondeau et al. (2017) Gerald Derondeau, Federico Bisti, Masaki Kobayashi, Jürgen Braun, Hubert Ebert, Victor A. Rogalev, Ming Shi, Thorsten Schmitt, Junzhang Ma, Hong Ding, Vladimir N. Strocov, and Ján Minár, “Fermi surface and effective masses in photoemission response of the (Ba1-xKx)Fe2As2 superconductor,” Sci. Rep. 7, 8787 (2017).
- Yi et al. (2009) M. Yi, D. H. Lu, J. G. Analytis, J.-H. Chu, S.-K. Mo, R.-H. He, M. Hashimoto, R. G. Moore, I. I. Mazin, D. J. Singh, Z. Hussain, I. R. Fisher, and Z.-X. Shen, “Unconventional electronic reconstruction in undoped (Ba,Sr)Fe2As2 across the spin density wave transition,” Phys. Rev. B 80, 174510 (2009).
- Wooten (1972) F. Wooten, Optical Properties of Solids (Academic Press, New York, 1972) pp. 244–250.
- Dressel and Grüner (2001) M. Dressel and G. Grüner, Electrodynamics of Solids (Cambridge University Press, Cambridge, 2001).
- Singh (1994) D. J. Singh, Planewaves, Pseudopotentials and the LAPW method (Kluwer Adademic, Boston, 1994).
- Singh (1991) David Singh, “Ground-state properties of lanthanum: Treatment of extended-core states,” Phys. Rev. B 43, 6388–6392 (1991).
- (77) P. Blaha, K. Schwarz, G. K. H. Madsen, D. Kvasnicka and J. Luitz, WIEN2k, An augmented plane wave plus local orbitals program for calculating crystal properties (Techn. Universität Wien, Austria, 2001).
![[Uncaptioned image]](/html/1910.02927/assets/x11.png)
![[Uncaptioned image]](/html/1910.02927/assets/x12.png)
![[Uncaptioned image]](/html/1910.02927/assets/x13.png)
![[Uncaptioned image]](/html/1910.02927/assets/x14.png)
![[Uncaptioned image]](/html/1910.02927/assets/x15.png)
![[Uncaptioned image]](/html/1910.02927/assets/x16.png)
![[Uncaptioned image]](/html/1910.02927/assets/x17.png)