Constant cyclotron line energy in Hercules X–1 -
Joint Insight-HXMT and NuSTAR observations
Abstract
The long-term evolution of the centroid energy of the CRSF in Her X-1 is still a mystery. We report a new measurement from a campaign between Insight-HXMT and NuSTAR performed in February 2018. Generally, the two satellites show well consistent results of timing and spectral properties. The joint spectral analysis confirms that the previously observed long decay phase has ended, and that the line energy instead keeps constant around 37.5 keV after flux correction.
1 Introduction
Her X-1 is a bright persistent X-ray binary (XRB) pulsar system, which was discovered in 1972 by Uhuru (Tananbaum et al., 1972). The system hosts a highly magnetized neutron star with a spin period of s, and a companion star with a mass of 2.2-M☉. The orbit is near circular with a high inclination angle of 85°) causing a six hour long eclipse within the 1.7-day orbital period. Her X-1 is the first source in which a cyclotron resonant scattering feature (CRSF) was detected (Trümper et al., 1978). The CRSF energy is around 40 keV, varying with pulse phase, X-ray luminosity, with 35-d precession phase and with time(Voges et al., 1982; Vasco et al., 2013; Staubert et al., 2007; Klochkov et al., 2011; Staubert et al., 2014). Based on observations of RXTE, Suzaku, Integral and NuSTAR, an almost 20 year long decay of the CRSF energy was observed since about 1996, ending somewhere between 2012 and 2015 (Staubert et al., 2014, 2016, 2017; Klochkov et al., 2015; Ji et al., 2019). Since then the CRSF energy appears to be constant around 37.5 keV.
Insight-HXMT, launched on June 15, 2017, was originally proposed in the 1990s, based on the Direct Demodulation Method (Li et al., 1993, 1994). As the first X-ray astronomical satellite of China, Insight-HXMT carries three main instruments (Zhang et al., 2014): the High Energy X-ray telescope (HE, 20-250 keV, 5100 cm2), the Medium Energy X-ray telescope (ME, 5-30 keV, 952 cm2), and the Low Energy X-ray telescope (LE, 1-15 keV, 384 cm2). A series of observations for in-orbit calibrations were performed. For instance, the instrument response was calibrated with observations of the Crab pulsar and the Crab nebular. Campaigns with other orbiting telescopes are part of the calibration strategy. One of such a campaign observing Her X-1 was carried out with NuSTAR eight months after the launch of Insight-HXMT. The aim of this campaign was to test the calibration of Insight-HXMT in both, the timing and the energy domains, with a focus on the energy channel relationship at energies above 10 keV by using the CRSF of Her X-1. In this work, we study the timing and spectral properties of Her X-1, and compare the results between Insight-HXMT and NuSTAR.
2 Observations and results
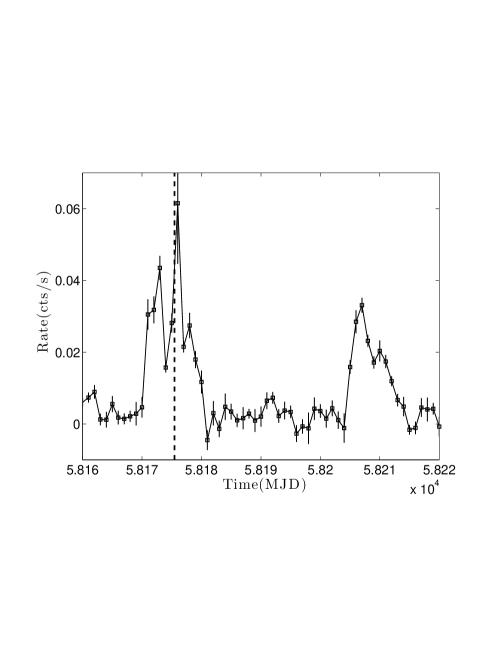
The campaign of Her X–1 observations with Insight-HXMT and NuSTAR was carried out on February 26th, 2018, around the peak flux of the Main-On of this 35 d cycle ( 200 mCrab detected with Swift/BAT, see Fig. 1 and Table 1).
We performed the data reduction by using the Insight-HXMT data analysis software package HXMTDas(v2.01) and followed the recommended procedures 111For details, see http://www.hxmt.org/index.php/enhome/analysis/199-hxmt-data-anslysis-software. We calibrated the raw events by using routines hepical, mepical and lepical for HE, ME and LE instruments, and estimated the corresponding Good Time Intervals (GTIs), based on the following criteria: the earth elevation angle 15∘ (10∘) for LE (HE and ME); the cutoff rigidity (COR) 8∘; the offset angle is smaller than 0.04; discarding the data near the South Atlantic Anomaly (SAA) passage; the Bright Earth Angle is 40∘ for LE. In our analysis of Her X-1 the background model of Insight-HXMT is generated with a large amount of blank sky observations (Liao et al., 2019). The background was calculated by using standalone python scripts hebkgmap, mebkgmap and lebkgmap (for details, see Li et al., 2018). The response files for the spectral analysis were constructed according to the CALDB version 2.01.
NuSTAR is the first space-based directly imaging X-ray telescope at energies above 10 keV (Harrison, 2013). It consists of two focal plane module telescopes (FPMA and FPMB). We utilised the standard software NUSTARDAS included in HEASoft (version 6.24) to perform the data reduction. During the spectral analysis, we extracted the source spectrum within a circular region, i.e., centred on the pulsar, and the background spectrum within a radius of 150′′ which does not enclose (but close to) the source.
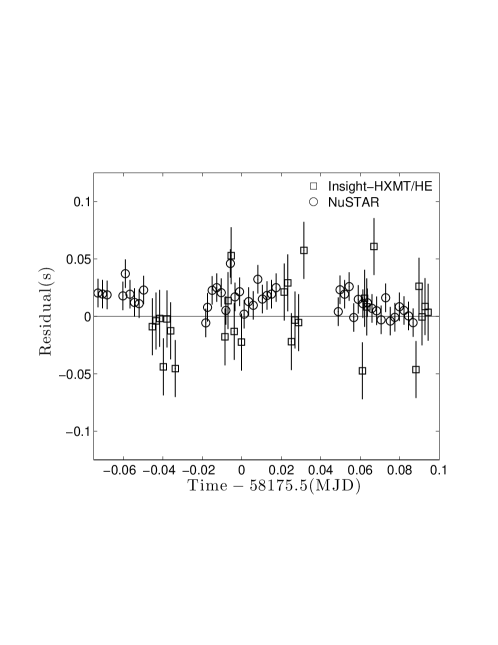
In the timing analysis, we made the barycentric correction with official tools, i.e., hxbary and barycorr developed for Insight-HXMT and NuSTAR, respectively. The binary correction was performed by using the orbital ephemeris reported by (Staubert et al., 2009). The spin period and its derivatives were obtained by using the phase-connection technique (Deeter et al., 1981). In practice, we divided the observations into several segments (200 s each), and searched for corresponding spin frequencies using the epoch folding method. We then folded the events to obtain pulse profiles for each segment, and derived an averaged pulse profile by co-aligning and combining all. The time-of-arrivals (TOAs) of pulsations were calculated by cross-correlating the pulse profile in each segment with the averaged pulse profile. The errors of TOAs were estimated by using Monte-Carlo method (Ge et al., 2012). Finally, according to TOAs, we fitted the frequency and its derivative of Her X-1 jointly using the software TEMPO2 (Hobbs et al., 2006).
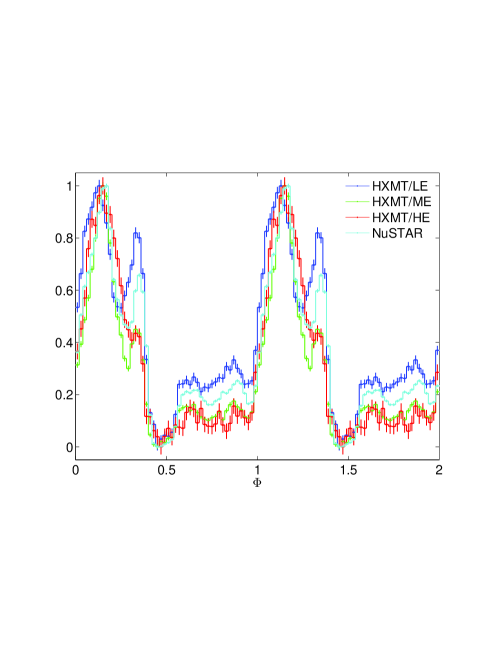
We show the timing residuals after fitting Insight-HXMT/HE’s and NuSTAR’s TOAs in Fig. 2. The resulting spin frequency is shown in Table 2. The timing system of Insight-HXMT is well within the precision level of 15 ms, which is consistent with those of the timing residuals derived from timing analysis of the Crab pulsar (Li et al., 2018). We folded the events observed with different instruments to obtain pulse profiles at different energies (Figure 3). The pulse profiles consist of a main pulse with several smaller structures, which are similar to those of previous NuSTAR observations (Fürst et al., 2013). In addition, pulse profiles are clearly energy-dependent, which will be extensively investigated in a separated paper.
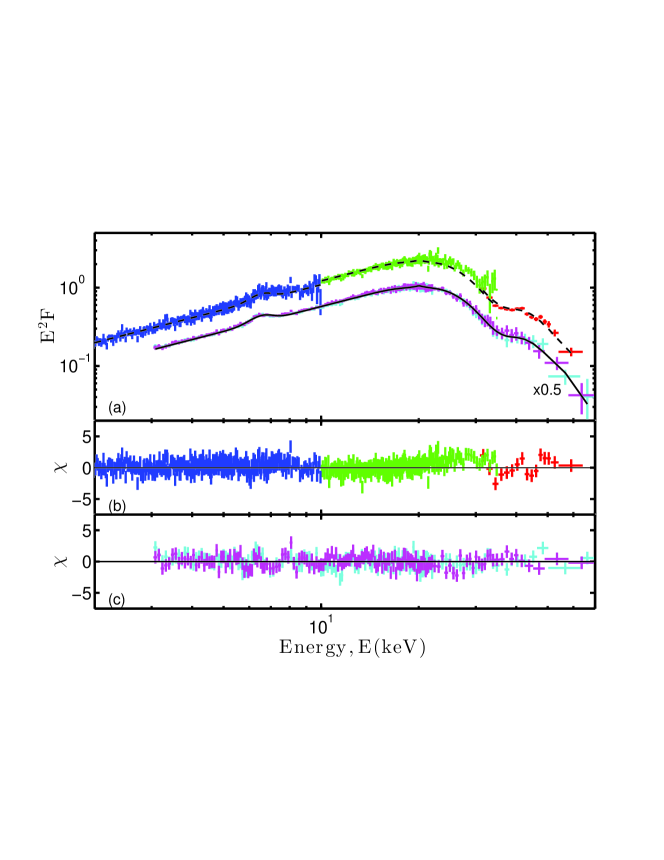
In the spectral analysis, we only considered the observational intervals outside of the eclipse. During fittings, we employed a canonical ”highecut” model, i.e., a power law model with a high energy cutoff, which is widely used for Her X-1 (e.g., Staubert et al., 2017). To smooth the phenomenological model around the cutoff energy, we multiplied the model with a Gaussian optical-depth profile (”gabs” in XSPEC) with its energy tied to the cutoff energy (Fürst et al., 2013). A Gaussian model was added for the iron emission line around 6.4 keV. To investigate the absorption feature of the cyclotron line, another ”gabs” component was considered. In the spectral analysis, we used XSPEC (Version 12.10.0c) (Arnaud, 2019). A systematic error of 2% was included for spectral fitting of Insight-HXMT. All uncertainties quoted in this paper are given at the (68.3%) confidence level.
We firstly fitted the spectra observed by Insight-HXMT and NuSTAR independently, using the model described above. We show the best-fitting parameters in Table 3. Clearly, the parameters obtained from the two satellites are generally well in agreement with each other, which verifies the performance of the in-orbital calibration of Insight-HXMT. However, the resulting ”norm” parameter shows a 10% discrepancy, which might be due to the influence of soft X-rays ( 3 keV) of Insight-HXMT that could influence the spectral shape significantly. Thus, for comparison, we ignored the energy range below 3 keV for Insight-HXMT data, and found that in this case this discrepancy disappeared. We then jointly fitted Insight-HXMT and NuSTAR spectra, and obtained an acceptable goodness-of-fit (shown in Figure 4), demonstrating again the consistency of the cross-calibration between Insight-HXMT and NuSTAR. We find that the spectral parameters in our observations are quite similar to previous reports (see, e.g., Fürst et al., 2013). We also performed a spectral analysis of the NuSTAR observation during the eclipse. We find that the CRSF centroid energy is derived consistent with that from the pre-eclipse NuSTAR data.
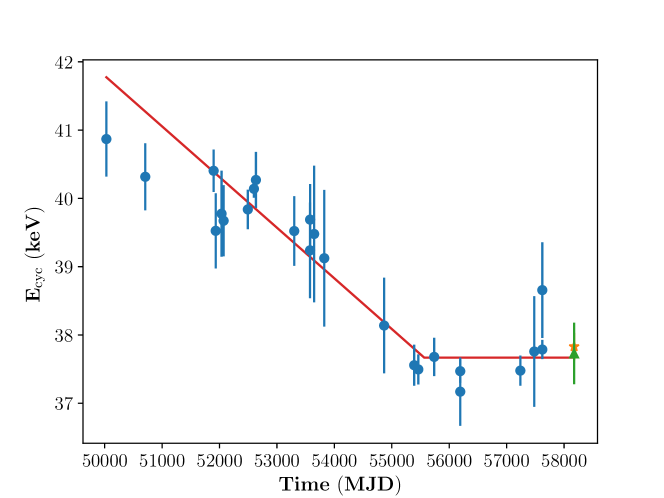
We update the long-term evolution of the CRSF energy in Figure 5. We use the originally measured values from Staubert et al. (2014, 2016, 2017), corrected for the dependence on flux using a correction factor of 0.68 keV per ASM-cts/sec (this is the best currently available value, determined by Staubert) (for details, see, e.g., Staubert et al., 2016, 2017; Ji et al., 2019). Clearly, the decay trend is stopped and afterwards the line energy stays constant. We used a piecewise function to describe the evolution, and found that the averaged flux corrected line energy is 37.580.07 keV for the time after MJD 55400. We note that a F-test suggests that this function is significantly better than a simple power-law function with a p-value of , and therefore the ending of the decreasing trend of the CRSF energy at a significance level of 5 for the first time. This result, including our new observations, is well consistent with previous reports (Staubert et al., 2016, 2017; Ji et al., 2019).
3 Summary
We have performed the joint timing and spectral analyses of data on Her X-1 by using the contemporary observations by Insight-HXMT and NuSTAR of February 2018. The results show that the pulse profiles of Insight-HXMT are well consistent with those from NuSTAR. The spectral parameters as derived from Insight-HXMT are also consistent with those from NuSTAR. We find that the centroid energy of the CRSF keeps the same trend as reported in the literature (Staubert et al., 2016, 2017; Ji et al., 2019), i.e., being stable at 37.6 keV after the long-term decay phase.
| Instrument | Obs ID | Date | Exposure (ks) |
|---|---|---|---|
| ks | |||
| Insight-HXMT | P010130801006 | 2018/2/26 | 10 |
| NuSTAR | 30302012004 | 2018/2/26 | 62 |
| Time range (MJD) | 58175.45–58175.6 |
|---|---|
| PEPOCH(MJD) | 58175.45 |
| (Hz) | 0.807938(2) |
| rms( ms ) | 15 |
| /d.o.f. (d.o.f) | 1.01 (60) |
| Parameters | NuSTAR | Insight-HXMT(*) | Both | Insight-HXMT(**) |
|---|---|---|---|---|
| (keV) | ||||
| (keV) | ||||
| Strength CRSF | ||||
| (keV) | ||||
| (keV) | ||||
| Strength smooth | ||||
| (keV) | ||||
| (keV) | ||||
| Norm() | ||||
| (keV) | ||||
| (keV) | ||||
| () | ||||
| 1.14(1671) | 0.76(1468) | 1.03(3155) | 0.75(1261) |
* represents the spectrum fitting from 1.2 keV. ** represents the spectrum fitting from 3 keV.
References
- Arnaud (2019) Arnaud, K.A., 2018, 1996, Astronomical Data Analysis Software and Systems V, 101, 17
- Chen et al. (2018) Chen, Y. P., Zhang, S., Qu, J. L., Zhang, S. N., Ji, L. et al., 2018, ApJ, 864, L30
- Deeter et al. (1981) Deeter J. E., Boynton P. E., Pravdo S. H., 1981, ApJ, 247, 1003
- Fürst et al. (2013) Fürst, F., Grefenstette, B. W., Staubert, R. et al., 2013, ApJ, 779, 69
- Ge et al. (2012) Ge, M. Y., Lu, F. J., Qu, J. L., Zheng, S. J., Chen, Y., Han, D. W., 2012, ApJ, 199, 32
- Gruber et al. (2001) Gruber, D. E., Heindl, W. A., Rothschild, R. E., et al. 2001, ApJ, 562, 499
- Harrison (2013) Harrison, F. A., Craig, W. W., Christensen, F. E., Hailey, C. J., Zhang, W. W., et al., 2013, ApJ, 770, 103
- Hobbs et al. (2006) Hobbs, G. B., Edwards, R. T., Manchester, R. N., 2006, MNRAS, 369, 655
- Huang et al. (2018) Huang, Y., Qu, J. L., Zhang, S. N., Bu, Q. C., Chen, Y. P. et al., 2018, ApJ, 866, 122
- Ji et al. (2019) Ji, L., Staubert, R., Ducci, L., Santangelo, A., Zhang, S. & Chang, Z., 2019, MNRAS, 484, 3797
- Kennea et al. (2017) Kennea, J. A., Lien, A. Y., Krimm, H. A., Cenko, S. B., & Siegel, M. H. Atel #10809
- Klochkov et al. (2011) Klochkov, D., Staubert, R., Santangelo, A., et al. 2011, A&A, 532, A126
- Klochkov et al. (2015) Klochkov, D., Staubert, R., Postnov, K., et al. 2015, A&A, 578, A88
- Leahy & Ciprian (2011) Leahy, D., A, & Ciprian, I., 2011, ApJ, 736, 74
- Li et al. (1993) Li, T.-P. and Wu M., 1993, Astrophys. Space Sci., 206, 91 C102.
- Li et al. (1994) Li, T.-P. and Wu M., 1994, Astrophys. Space Sci., 215, 213 C227.
- Li et al. (2018) Li X. B., Song L. M., Li X. F., Tan Y., Yang Y. J., Ge M. Y., 2018, SPIE, 10699
- Li et al. (2019) Li, X. B. and Insight-HXMT collaboration, 2019, in preparation.
- Liao et al. (2019) Liao, J. Y. and Insight-HXMT collaboration, 2019, in preparation.
- Reynolds et al. (1997) Reynolds, A. P., Quaintrell, H., Still, M. D., et al. 1997, MNRAS, 288, 43
- Scott & Leahy (1999) Scott, D., M., & Leahy, D., A., 1999, ApJ, 510, 974
- Staubert et al. (2007) Staubert, R., Shakura, N. I., Postnov, K., et al. 2007, A&A, 465, L25
- Staubert et al. (2009) Staubert, R., Klochkov, D., Wilms, J. 2009, A&A, 500, 883
- Staubert et al. (2014) Staubert, R., Klochkov, D., Wilms, J., et al. 2014, A&A, 572, A119
- Staubert et al. (2016) Staubert, R., Klochkov, D., Vybornov, V., et al. 2016, A&A, 590, A91
- Staubert et al. (2017) Staubert, R., Klochkov, D., Fürst, F., et al. 2017, A&A, 606, L13
- Tananbaum et al. (1972) Tananbaum, H., Gursy, H., E. M., et al. 1972, ApJ, 174, L143
- Trümper et al. (1978) Trümper, J., Pietsch, W., Reppin, C., et al. 1978, ApJL, 219, L105
- Voges et al. (1982) Voges, W., Pietsch, W., Reppin, C, et al. 1982, ApJ, 263, 803
- Vasco et al. (2013) Vasco, D., Staubert, R., Klochkov, D., et al, 2013, A&A, 550, A111
- Zhang et al. (2014) Zhang, S., Lu, F. J., Zhang, S.N. 2014, International Society for Optics and Photonics, 9144.
- Zhang et al. (2018) Zhang, S., Zhang, S. N., Lu, F. J. et al. 2018, SPIE, 106991U.