Correlating the nanoscale structural, magnetic and magneto-transport properties in SrRuO3-based perovskite oxide ultra-thin films
Abstract
We investigated the structural and magnetic properties of bare SrRuO3 (SRO) ultra-thin films and SrRuO3/SrIrO3/SrZrO3 (SRO/SIO/SZO: RIZ) trilayer heterostructures between 10 K and 80 K, by comparing macroscopic data using magneto-optical Kerr effect (MOKE) and magneto-transport (anomalous Hall effect: AHE), with nanoscale fingerprints when applying non-contact scanning force microscopy (nc-SFM) and magnetic force microscopy (MFM). SRO and RIZ ultra-thin films were epitaxially grown at onto vicinal SrTiO3 (100) single-crystalline substrates to a nominal thickness of 4 and 4/2/2 unit cells (uc), respectively. Our correlated analysis allows associating topographic sample features of overgrown individual layers to their residual magnetization, as is shown here to be relevant for interpreting the macroscopic AHE data. Although the hump-like features in the AHE suggest a magnetically textured skyrmion phase to exist around 55 K associated to the topological Hall effect (THE), both our MOKE and MFM data cannot support this theory. In contrast, our SFM/MFM local-scale analysis finds the local coercive field to be strongly dependent on the effective layer thickness and stoichiometry in both the SRO and RIZ samples, with huge impact on the local band-structure. In fact, it is these variations that in turn mimic a potential THE through anomalies in the AHE resistivity loops.
I Introduction
Magneto-transport and Hall measurements are versatile techniques to inspect and characterize magnetically active materials on the micrometer length scale. Extra contributions to the ordinary Hall effect arising through the sample magnetization dependence, have been identified as the so-called anomalous Hall effect (AHE). In ferromagnetic materials, the AHE usually is proportional to the sample magnetization and therefore shows the same hysteretic behavior Karplus54 ; Nagaosa10 .
Recently, additional contributions to the AHE have been postulated that arise from topologically non-trivial magnetic textures Bruno04 . This component was labelled as the Topological Hall Effect (THE) and is of great importance when proving the existence of skyrmions by simple transport measurements. As a non-trivial topological magnetic texture, skyrmion lattices (SkLs) are expected to contribute to the THE, being visible as hump-like anomalies on top of the expected AHE Neubauer09 . As a conclusion, it is often assumed that any contribution resembling the THE recognized in the Hall data might originate from the presence of skyrmions Matsuno16 .
The research field in skyrmion phenomena is given a lot of attention these days, specifically also with the big view of finding the next-generation material that supports skyrmion formation, especially for data storage applications Fert13 . One avenue of research is to discover an insulating skyrmion host material, that in turn, would allow electric field manipulation of magnetic domains/phases using standard gating techniques Mizuno17 ; Ohuchi18 . Hence, epitaxially-grown ferromagnetic perovskite oxide heterostructures are of central interests Matsuno16 ; Ohuchi18 ; Sohn18 ; Wang18 ; Meng19 since they undergo a metal-to-insulator transition for layer thicknesses measuring between 3 and 6 unit cells Kan18 .
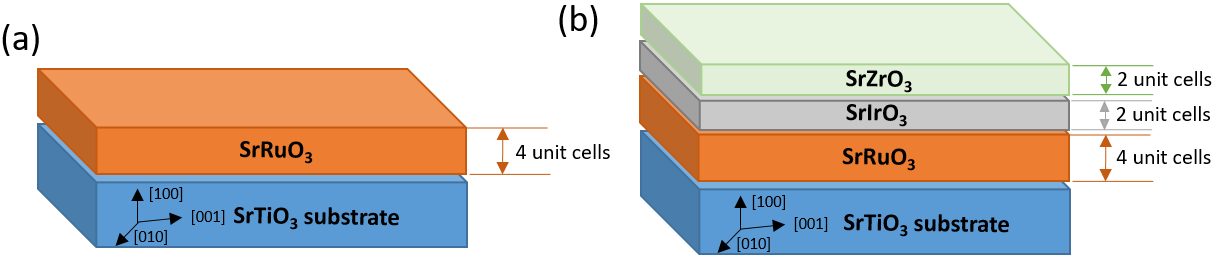
A ferromagnetic perovskite oxide that is well suited for generating skyrmions, is the 4d-transition metal SrRuO3 (SRO). Epitaxial layers of SRO and heterostructures involving SRO-layers recently have been in the research focus, because of peculiar features appearing in the AHE resistivity loops that hint towards a significant THE contribution possibly inferred by skyrmions. This interpretation is currently under heated debate Kan18 ; Wu19 . Therefore, we combine here magneto-transport with both nanometer- and micrometer-scale spectroscopy/microscopy for inspecting two selected samples, a bare SrRuO3 ultra-thin film of a 4uc-thickness (4SRO) and a 4SRO layer overgrown with 2-by-2 uc of SrIrO3 and SrZrO3, resulting in the trilayer 4RIZ heterostructure. Our study unambiguously proves that the origin for the observed THE lies within the 4SRO layer, needing absolutely no skyrmions to be present in order to mimic the hump-like features observed in the THE data.
II Material
SrRuO3 (SRO) constitutes one of the few functional perovskite materials with formula ABO3 that is ferromagnetic Zhu14 ; Kundu16 . The ferromagnetic order is robust and preserved down to at least 3 unit cells (uc) when epitaxially grown on SrTiO3 (STO) (100) single crystals Matsuno16 . Furthermore, SRO films have a large magneto-crystalline anisotropy Snyder19 that is easily manipulated for instance through epitaxial heterostructuring. At ordered perovskite interfaces, strong structural coupling via the oxygen octahedra provides a valuable way to engineer magnetic anisotropy, by controlling the easy-axes orientation of the magnetization Kan15 ; Kan16 . Magnetic interfacial coupling also provides an appropriate route to manipulate magnetic ordering, for instance in SrRuO3/La0.7Sr0.3MnO3 superlattices engineered for strong anti-ferromagnetic interlayer coupling that results in non-collinear magnetic ordering Ziese12 ; Kim12 .
In 1999, a Lorentz transmission electron microscopy study Marshall99 reported on 30-100-nm-thick SRO films revealing magnetic stripe domains that are separated by 3-nm-narrow domain walls (DWs). These domains drastically impact the linear magnetoresistance for zero-field cooled SRO films, as documented by Klein et al. Klein98 . A more recent study reports on a 4-K MFM investigation of patterned rectangular magnetic nano-islands of a 10-nm-thick SRO film Landau12 .
With respect to skyrmion formation in heterostructures based on broken inversion symmetry, SRO is a very attractive candidate due to the perpendicular magnetic anisotropy, exhibited when epitaxially grown on single crystalline (sc) STO(100). A very recent example is the work on SrRuO3/SrIrO3 (SRO/SIO) bilayers on STO(100) substrates, in which the ferromagnetic ultra-thin SRO layer is interfaced with the paramagnetic SIO that exhibits large spin-orbit coupling (SOC) Matsuno16 . The inherent inversion symmetry breaking at the interface as well as the proximity of the large SOC of heavy 5d Ir ions, are expected to result in a strong interfacial Dzyaloshinskii-Moriya interaction (DMI). The latter may lead to non-collinear magnetic ordering in the ultra-thin SRO layers (around 4 - 6 unit cells) with strong perpendicular magnetic anisotropy Matsuno16 ; Ohuchi18 .
Matsuno et al. showed MFM investigations of a 5uc-SRO/2uc-SIO bilayer heterostructure that were claimed to hint towards the formation of tiny bubble-like magnetic domains, interpreted as a possible skyrmion phase Matsuno16 . Therefore, we investigate here the magnetic domain formation and morphology in epitaxial ultra-thin SRO films and SRO/SIO/SZO (RIZ) heterostructures, in which the SRO layer thickness is kept the same (i.e. 4uc). We find the nanoscopic origins of SRO layer overgrowth as well as the locally varying coercive field within the 4uc SRO films to be the origin of macroscopic AHE anomalies, rather than a textured skyrmion phase.
III Sample preparation
The heterostructures under study [see Fig. 1] were fabricated by pulsed-laser deposition (PLD) using a KrF excimer laser. High-oxygen pressure reflective high energy electron diffraction (RHEED) was used for both monitoring the layer-growth in-situ and to analyze the film structure at the growth temperature and after cooling (see also supplemental information S1). sc-STO(100) vicinally cut under an angle of about were used as substrates after etching in buffered HF and annealing at for 2 hours in air. These substrates then show a uniform and continuous TiO2 surface termination, hence providing a stepped sample surface with regularly distributed terraces of a 200 - 450 nm width.
Stoichiometric SRO, SIO, and SrZrO3 (SZO) targets were employed for PLD. The layer growth was performed in a 0.133 mbar O2 atmosphere, and STO substrates were heated to . The laser fluence was set to 2 J/cm2 while the laser repetition rate for the SRO and SIO/SZO were 5 and 1-2 Hz, respectively. SZO was used here as a protective capping layer on top of the SRO/SIO bilayer, in order to avoid deterioration in the SIO stoichiometry due to moisture Groenendijk16 . Both the SIO and SZO were grown to a 2 pseudo-cubic uc thickness each, as determined by RHEED specular spot oscillations. As a result, we obtained a set of 2 samples [see Fig. 1]: (a) a 4uc-thin bare SRO sample (furtheron labelled as 4SRO), and (b) a 4/2/2-uc thin SRO/SIO/SZO trilayer heterostructure (labelled furtheron as the 4RIZ sample).
IV Magnetic and magneto-transport studies
4SRO and 4RIZ samples firstly were analyzed at the macroscopic length scale, employing the magneto-optical Kerr effect (MOKE) (for details see supplement S2), and magneto-transport measurements using a van-der-Pauw Hall setup in transverse geometry. In order to suppress the contribution of the linear magnetoresistance, electrical contacts were cyclically permutated to read proper Hall data.
It is commonly assumed that the total Hall resistivity of a ferromagnet is given by the sum of the ordinary Hall resistivity and the anomalous Hall resistivity contribution as:
| (1) |
Here is the permeability of vacuum, is the Hall coefficient that mainly depends on the majority-charge carrier density, and denotes the magnitude of the external magnetic field applied perpendicular to the - sample plane. The second term in Eq. (1) accounts for the anomalous Hall effect exhibited in the presence of a spontaneous magnetization and large spin-orbit coupling; the AHE resistivity is directly proportional to the macroscopic magnetization component perpendicular to the current flow direction Pugh1953 , with denoting the anomalous Hall coefficient Nagaosa10 .
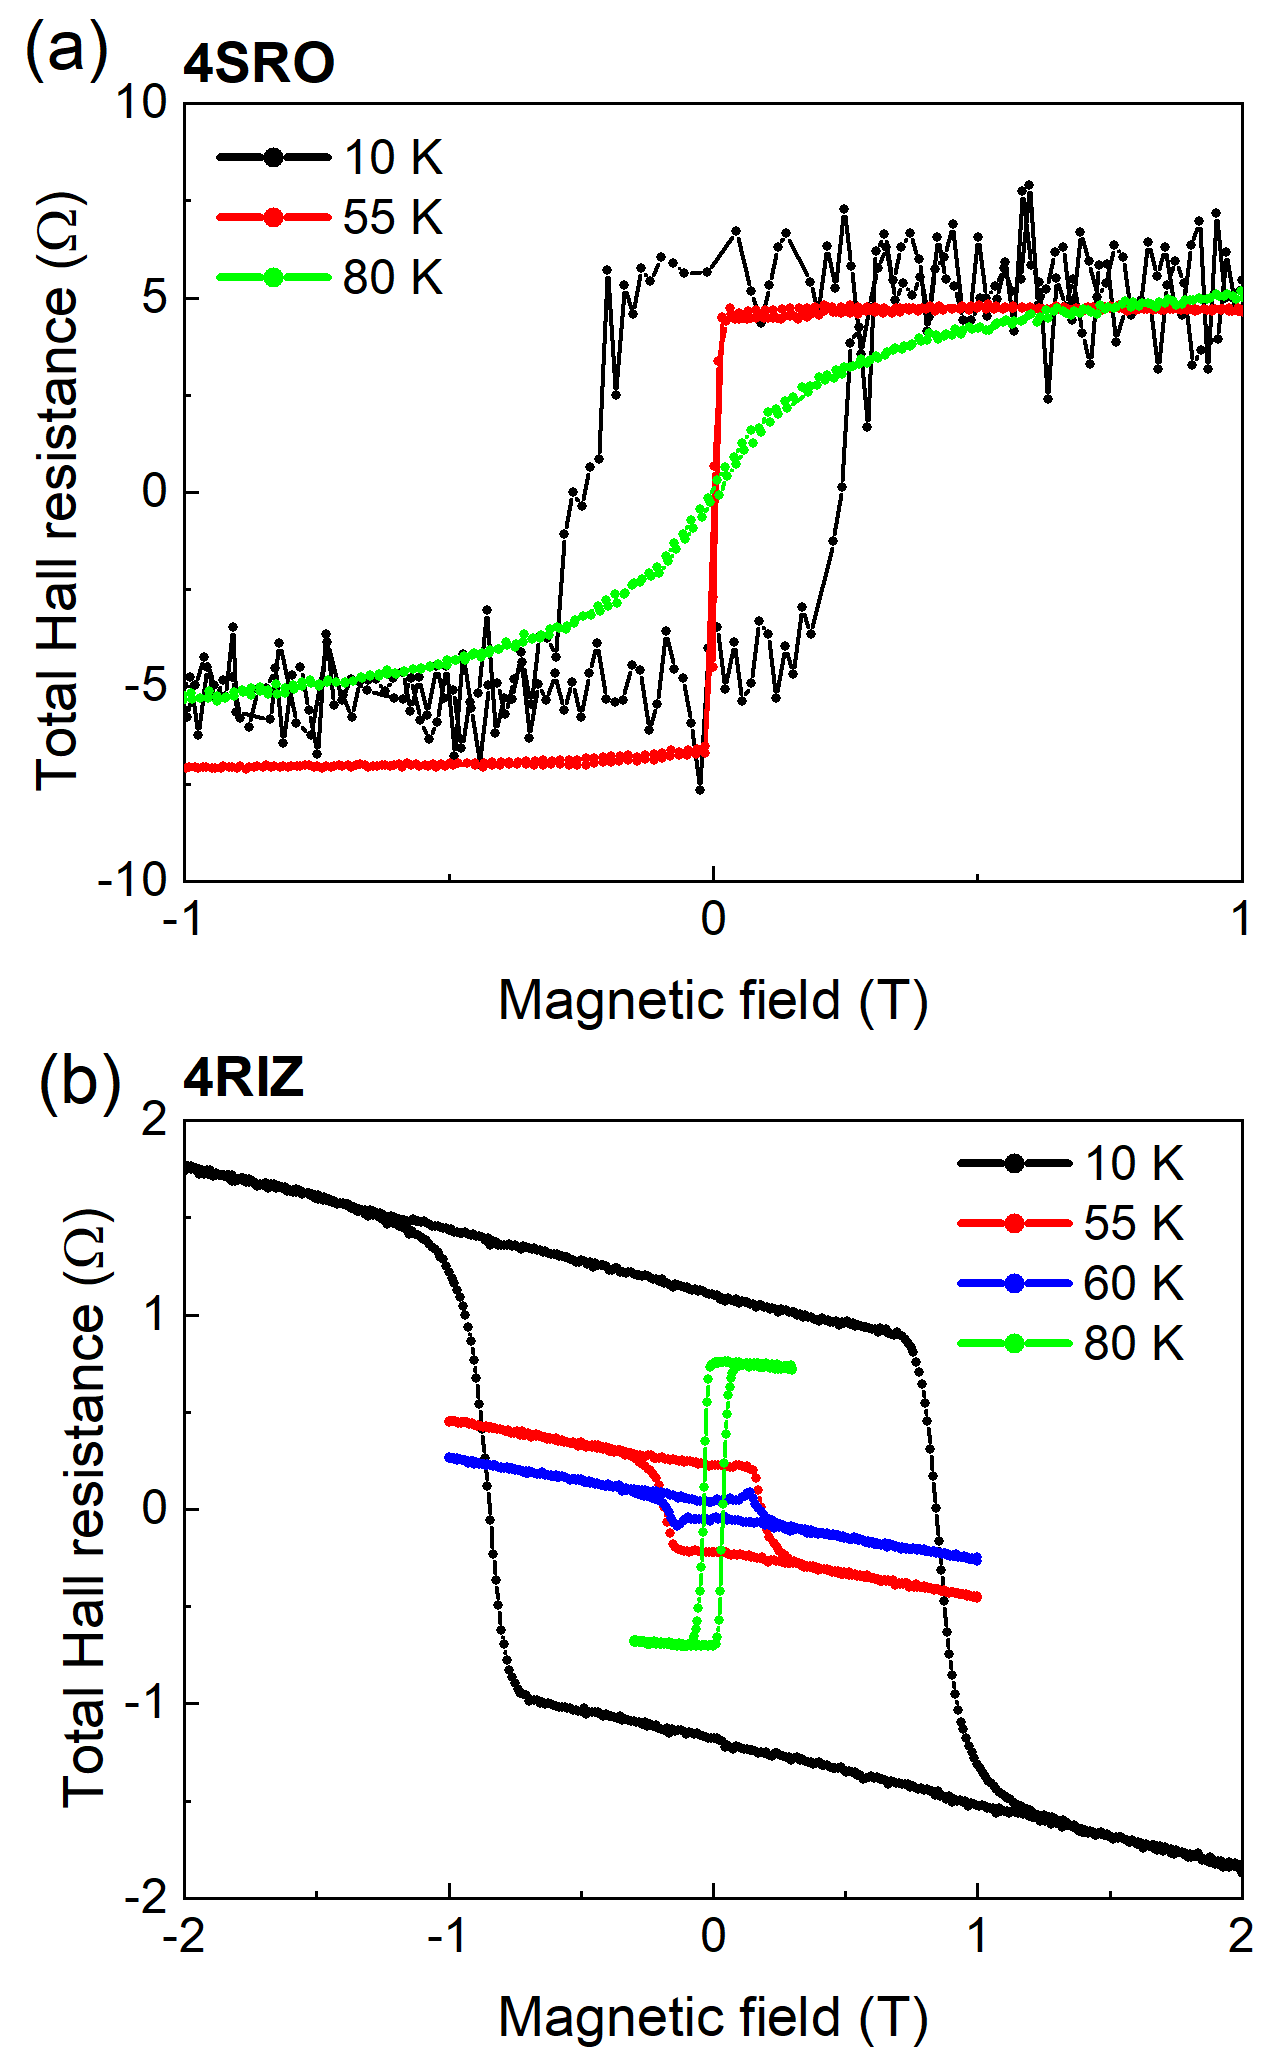
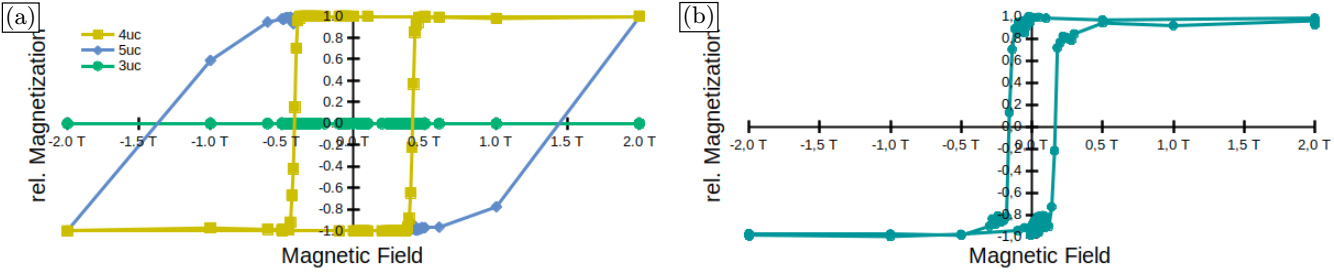
Fig. 2 displays the magnetic field dependence of the total Hall resistance as measured for (a) the bare 4SRO thin film, and (b) the 4RIZ trilayer heterostructure at selected temperatures. Capping the nominally 4SRO layer with 2-by-2 layers of the strong SOC SIO and the large bandgap insulator SZO, results in dramatic changes in both the magnetic and magneto-transport behavior of the SRO layers.
Bare 4SRO thin film exhibits a positive anomalous Hall effect constant within its ferromagnetic phase [Fig. 2(a)], while the 4RIZ trilayer shows a negative at low temperatures switching to positive values close to 70 K. [Fig. 2(b)].
Due to the previously found dependence of the anomalous Hall effect of SRO on the details of its band structure Fang03 , the observed variations of the AHE characteristics may be related to differences in the crystal structure of the SRO layers Ziese11 . The non-monotonous AHE temperature dependence already reported for a broad variety of SRO single crystals and epitaxial films Ziese11 ; Fang03 including our 4RIZ trilayer structure, is a clear indication of structural stabilization of orthorhombic SRO layers by the overgrown layers of orthorhombic SIO and SZO. The stabilization of a tetragonal structure due to the suppression of the RuO6 octahedra tilts was observed for SRO layers grown on DyScO3(110) substrates when being capped with the cubic SrTiO3 with no tilts of the oxygen octahedra, with direct impact on the Curie temperature of the ferromagnetic SRO film Thomas17 . In case of our trilayer sample, the ferromagnetic transition temperature of the underlying SRO is significantly enhanced.
The Hall resistance loops of the 4SRO films at 80 K exhibits a -shaped behavior, indicating that the layer must already be in its paramagnetic state. However, at 80 K, the Hall loop of the 4RIZ trilayer still displays an open hysteresis curve, which demonstrates that the SRO layer here is ferromagnetic, in agreement with our MFM investigations (see later).
In strong magnetic fields where the sample magnetization is assumed to be constant, the total Hall resistance of the 4RIZ trilayer reveals a negative slope that is attributed to electron-dominated Hall transport [see Fig. 2(b)]; moreover, the corresponding fluctuations in the Hall resistivity of the 4SRO layer [Fig. 2(a)] are negligibly small. The observed differences of the transport properties hence clearly indicate severe changes in the electronic band structure for the SRO layer of the 4RIZ trilayer structure.
Close to the temperature where the AHE changes sign (around 55 K), hump-like anomalies pop up in the Hall resistance when investigating our 4RIZ trilayer [see Fig. 2(b)], in fact mimicking a contribution that might be attributed to the THE. Recently, several works claim the observation of a THE contribution to the AHE resistivity hysteresis loops in SRO ultrathin films and SRO/SIO bilayers Matsuno16 ; Ohuchi18 ; Qin19 ; Wu19 . Notably, no such features were detected in our bare 4SRO layers.
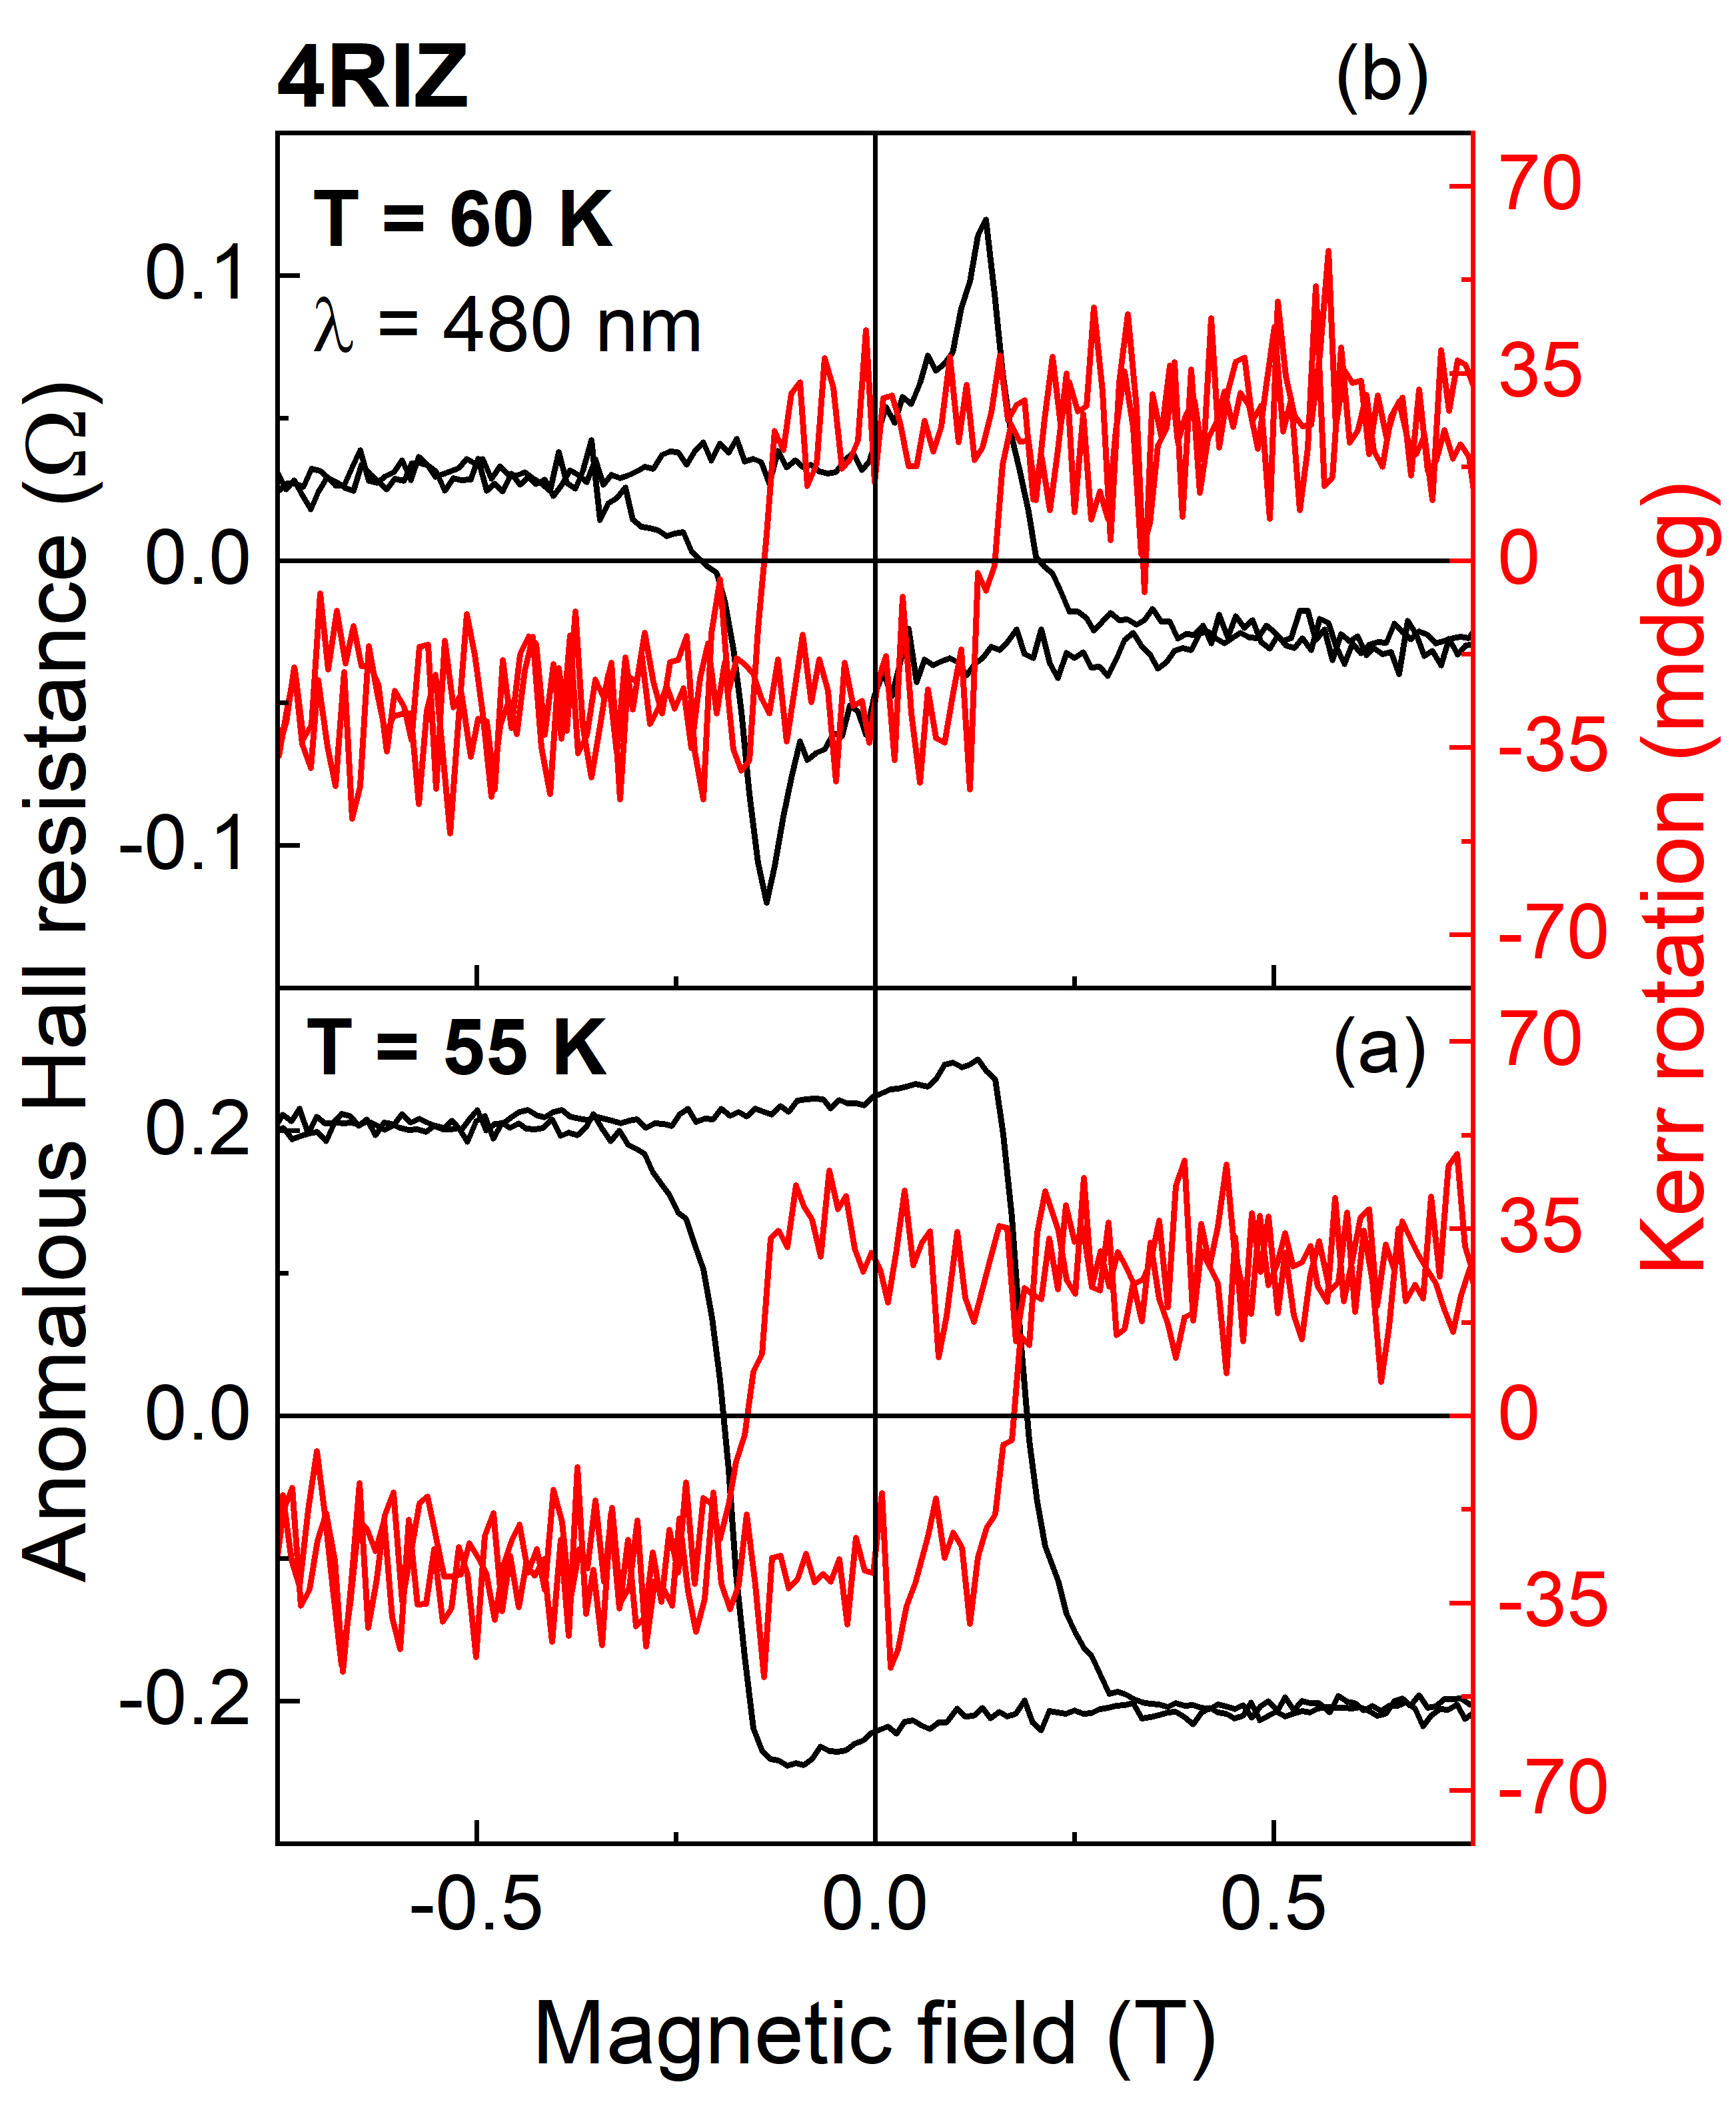
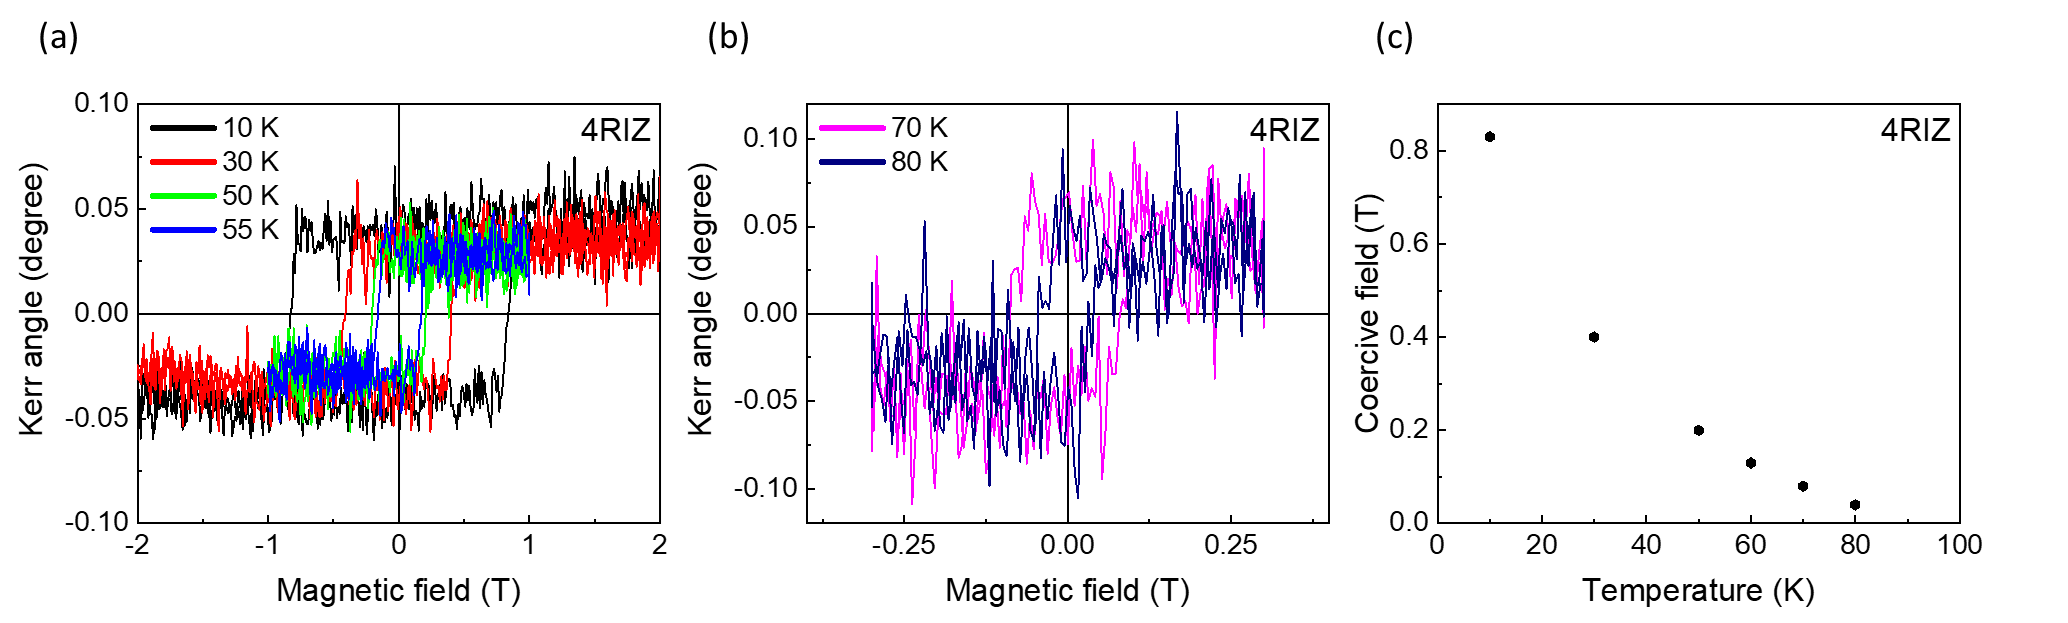
To clarify such an extra contribution, we compare our AHE with MOKE data obtained in-situ using a home-built MOKE setup (for details see supplementary information S2). Firstly, when sweeping the external magnetic field, the macroscopic MOKE rotation loops recorded on the 4RIZ thin film, resemble the switching behavior of a hard ferromagnetic layer in the easy axis configuration, independent of temperature [see Fig. 3]. In fact, MOKE delivers no hints for the existence of an additional nontrivial magnetic phase, as inferred by the Hall measurements. Moreover, the coercive field strength and the magnetic field where the AHE vanishes, differ drastically [see Fig. 3(b)].
These strong discrepancies hence can be solved only with a proper analysis of domain nucleation in SRO thin films, and shedding light on those nanoscale processes that unambiguously contribute to magnetization reversal in the 4RIZ heterostructures. We therefore apply low-temperature (LT) non-contact scanning-force microscopy (nc-SFM) and magnetic-force microscopy (MFM) to correlate the macroscopic AHE findings with local-scale structural and magnetic information on both the 4SRO and the 4RIZ samples, respectively. SFM/MFM was performed over the full temperature range from 10 to 80 K; the 55-K-results are discussed within the main text here, while all other data can be found in the supplement (see chapter S3).
V Low-temperature SFM and MFM measurements
The nanoscale analysis of the two sample systems 4SRO and 4RIZ is carried out with our low-temperature (LT) non-contact scanning force microscope (SFM) operating under ultrahigh vacuum (base pressure below mbar). SSS-QMFMR-type MFM probes with a hard magnetic coating were used for both topographic (SFM) and magnetic (MFM) inspection, revealing a mechanical quality factor of . The nominal cantilever oscillation amplitude of 10 nm is kept constant at all times, while then taking the measured frequency shift for topographic and magnetic feedback control in SFM and MFM, respectively.
MFM is performed in a two-path-mode, quantifying the sample topography in the first scan while then retracting the tip by 20 nm for the second scan, in order to be sensitive to the longer-ranged magnetic forces, only Kazakova19 .
V.1 Nanoscale real-space analysis of 4SRO and 4RIZ
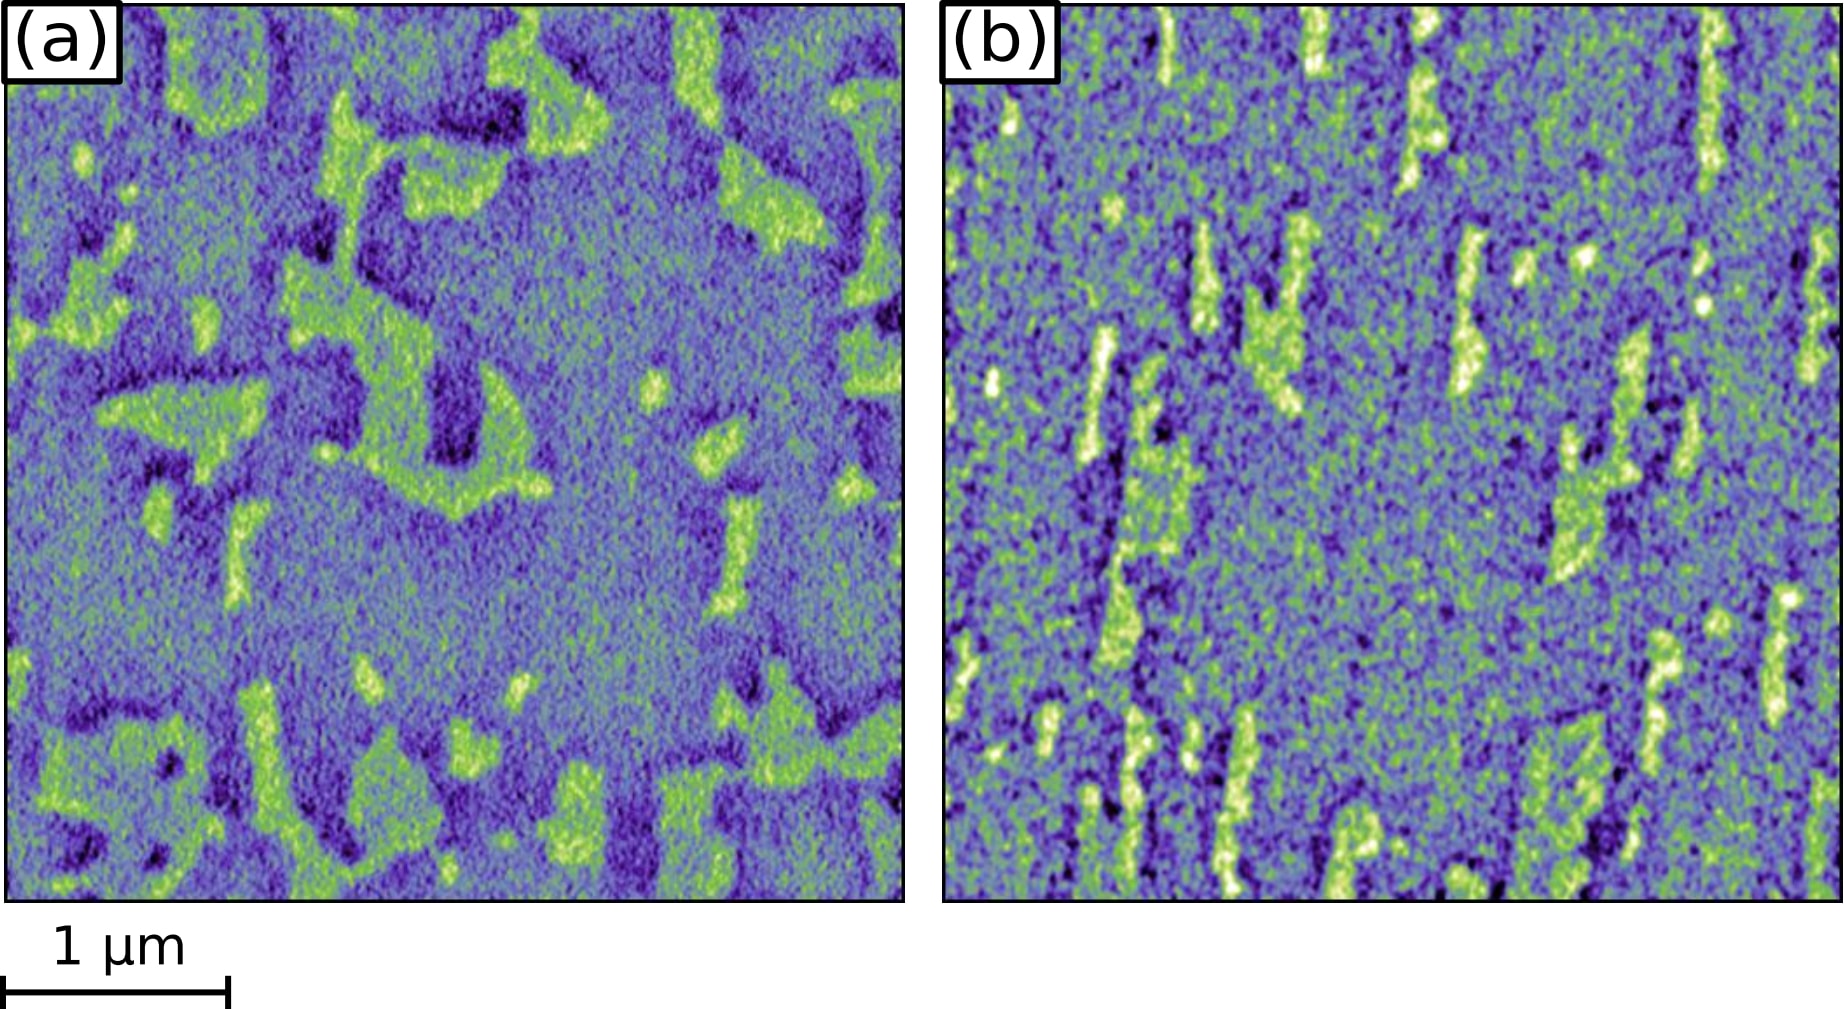
Fig. 4 displays typical topographic nc-SFM scans of both the 4SRO (a) and the 4RIZ (b) samples. We clearly observe the stepped surface morphology with terraces of a 0.39 nm height extending over 200 - 450 nm each, as induced by the vicinal STO substrate. Due to the stochastic nature of the deposition process, step edges of the 4SRO surface do not exactly terminate at straight STO step edges, creating areas of sample over- and undergrowth by 5uc and 3uc of SRO, respectively. Fig. 4(a),(b) show this behavior for the two samples in a birds-view illustration (-scan), while Fig. 4(c),(d) and Fig. 4(e),(f) display the same fact in a cross-sectional and pseudo 3D manner.
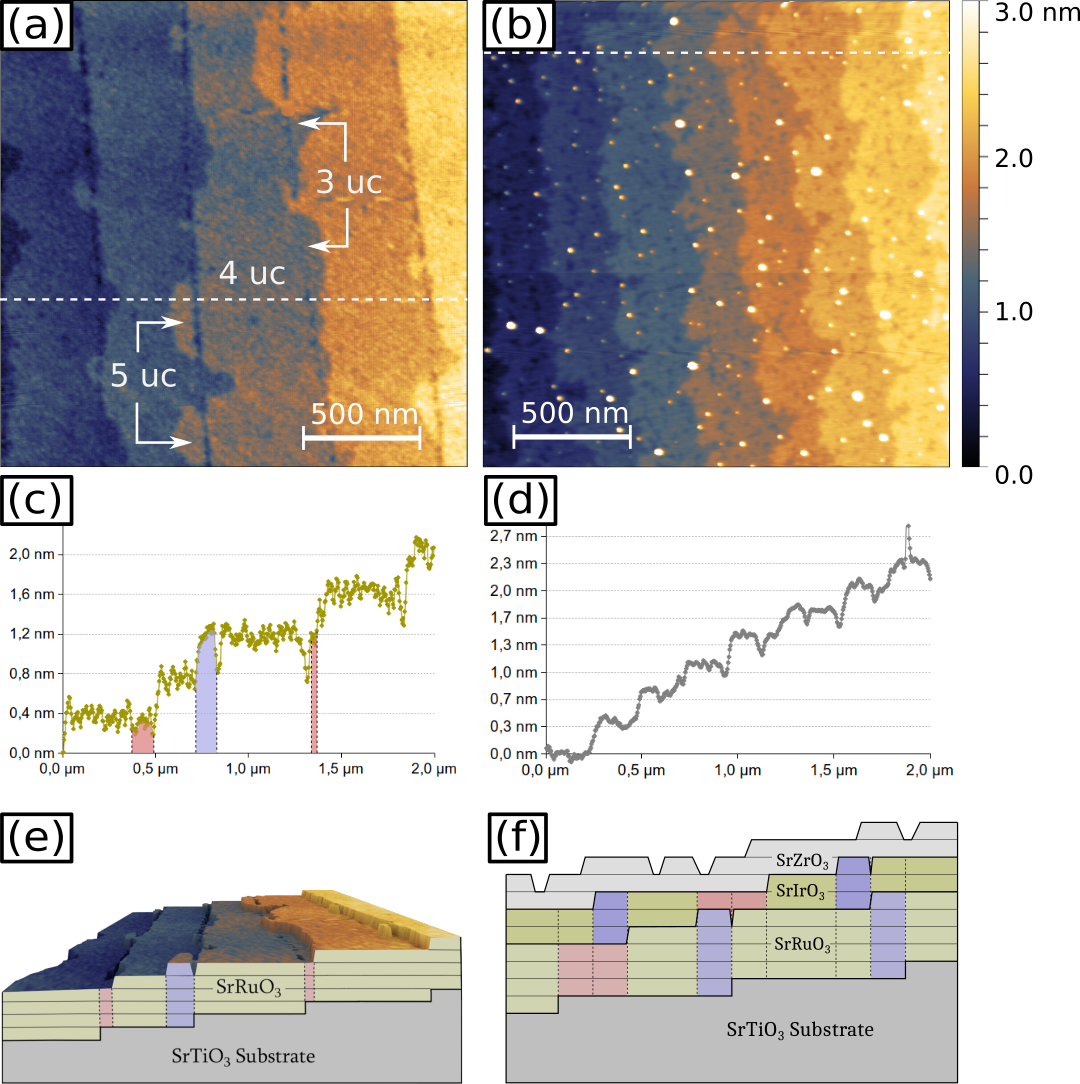

The 4RIZ structure is presented in Fig. 4(b). This topographic scan shows a considerably more disturbed surface arrangement, with both several nm high peaks and many dips in the stepped surface, reaching depths comparable to the observed step height. Unlike for the bare 4SRO film, the discrimination of different layer heights is no longer possible, since SRO, SIO, and SZO layers intermix in numerous stacking variants, as illustrated in Fig. 4(f).
Step-and-terrace morphology that is typical to films grown in the PLD step-flow growth regime on vicinal substrates, turns out to play a crucial role in crystallographic domain formation and growth Gan99 ; Ziese10 . Preferential alignment with terrace step edges oriented along the [001] orthorhombic axes has been reported for thinner SRO films, while rotation of the magnetic easy axis into the substrate plane is observed for medium-range film thicknesses (between 3 and 7.5 nm) Schultz09 . Both our 4SRO and 4RIZ films clearly belong to the first class and scenario, concluding that the easy axis of the 4uc SRO layer always stands perpendicular to the sample surface. This is of great importance also to our MFM data acquisition and interpretation.
V.2 MFM of the 4RIZ trilayer heterostructure
MFM/nc-SFM was applied for inspecting both the 4SRO and 4RIZ thin films at all temperatures. The 4SRO data at 10 K, 55 K, and 80 K are found in the supplemental chapters S3.1, S3.2, and S3.3, respectively, while the 4RIZ MFM inspections are posted in chapters S3.4 and S3.5 for 10 K and 80 K. The 55 K RIZ findings are discussed here and now.
A series of relevant MFM images when switching the 4RIZ trilayer heterostructure at 55 K from +2 T to -2 T are illustrated in Fig. 5. The terraced substrate sample surface is still vaguely visible, aligned along the y-axes in all images. When sweeping from high magnetic fields at +2 T [Fig. 5(k)] to the zero field state, the 4RIZ sample remains fully magnetized and no domains with reversed magnetization form. This is in full accordance to our hysteresis magnetization loops where the remanent magnetization is equal to the saturated magnetization, and consistent with literature Xia09 .
Nevertheless, we still observe a low contrast visible along the step edges, due to differences in the magnetic susceptibility of different layer heights that in turn affects the MFM signal strength. At the negative field value of -22 mT, the tip changes its magnetization direction and aligns with the externally applied field.
Domain growth initiates at approximately -100 mT, forming small magnetic nuclei that rapidly increase their domain size when increasing the magnetic field; as shown, the film has mostly switched at -240 mT [see Fig. 5(e)], with some isolated areas remaining pinned and stable up to -300 mT.
When reversing the field, we observe strong pinning of both initial magnetic nuclei and the switch-resistant areas, with several sites and domain wall shapes surviving over larger field changes and field ramping. One also sees that domain growth is affected, but not dominated, by the stepped substrate topography, with sharp vertical domain walls parallel to the terrace direction (-axes) appearing during switching, a clear indication of realignment of the SRO to the topographically-induced anisotropy. Nonetheless, as grown/switched domains extend over multiple terraces reaching some micrometers in lateral size.
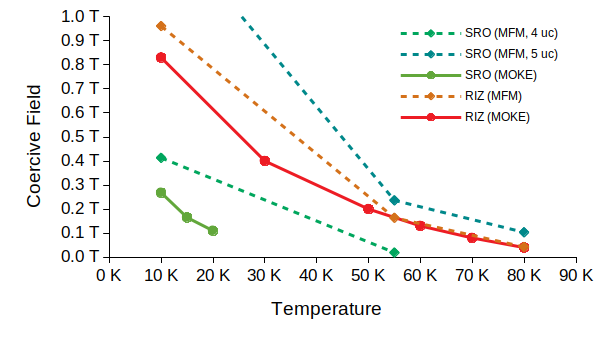
By using Otsu’s thresholding method Otsu79 to separate the domains (for details see supplement S4), it is possible to extract hysteresis curves from individual MFM images, obtained for both the 4SRO and 4RIZ samples at different temperatures. The temperature dependence of the coercive field is shown in Fig. 6 for comparison with MOKE measurements. The width, slope and coercive fields of MFM hysteresis curves are in good agreement to the hysteresis curves observed by MOKE, and therefore also considerably sharper than the peaks observed in the Hall data. At the critical field where the hump-like features start to appear in the AHE, the 4RIZ sample still appears uniformly magnetized under MFM. At no point do we see an intermediate state or second transition indicating the presence of a magnetic structure different from the uniformly polarized domains, skyrmionic or otherwise.
V.3 MFM of bare 4SRO thin films
For comparison reasons, field sweeps of the simpler 4SRO sample were as well investigated by MFM. While full MFM scans at all temperatures of 10 K, 55 K, and 80 K are found in the supplemental sections S3.1, S3.2, and S3.3, the summarized results for the 10 K and 55 K MFM findings on the 4RIZ thin films are illustrated in Fig. 7 here.
What is plotted in Fig. 7 is a 2-dimensional map that shows the variation in the average magnetic field value needed to locally switch the sample surface at exactly that sample surface spot. We run a full hysteresis loop at every position of this 512 pixel x 512 pixel image, and then deduce (by applying Otsu’s method) the corresponding local coercive field.

Notably, provided the thin-film sample is homogeneous, defect-free, and the growth being independent of any (topographic) structure, the resulting picture should reveal a uniform color/gray shade, since all areas/domains must switch at the same coercive field value, independent of temperatures. Concurrently, the error bar would be zero. Nevertheless, what we experimentally observe and display in Fig. 7, is that even bare 4SRO is far from being ideal, in that the material switches unevenly: To the one side, the coercive field shows strong variations when plotted over the whole sample area, ranging from 13 to 28 mT at 55 K [Fig. 7(b)] with an error bar of 15 mT, and 330 to 460 mT at 10 K [Fig. 7(a)] with a 130 mT error bar. Rectangular areas along step edges are seen to switch cooperatively as a whole. Note also the black areas in these two figures that correspond to the 5uc and 3uc over-/undergrown areas.
Also note from Fig. 7 that larger patches displayed in uniform color indicate areas that switch at the same coercive field, as nicely seen for very low temperatures at 10 K [Fig. 7(a)]. All the greenish areas in Fig. 7 thus are 4uc SRO layers, and hence are expected to show the same switching behavior on the uniformly TiO2-terminated STO (100) sample surface. Nevertheless, we find these areas to split up into SRO regions that have completely different switching fields, both parallel and perpendicular to the step edges. Variation of the epitaxial strain over the length scale of a terrace width is highly unlikely, which leaves us to conclude that electronic band structure variations for these different patches must be the origin for the documented variable switching behavior.
Also, the underlying anisotropy of the material causes the domains to elongate first perpendicular to the step edges before then growing along them. While at 10 K, this shape asymmetry becomes less pronounced and domain growth is observed both along and perpendicular to the STO step edges [see Fig. 7(a)], the material also shows a strong preference for hosting nucleation sites, most preferentially at terrace step edges. This is an indicator that despite the large difference in coercive fields between the 4SRO and 4RIZ sample, the observed memory effect in the domain growth of the heterostructure is due to these defects within continuous 4SRO layers.
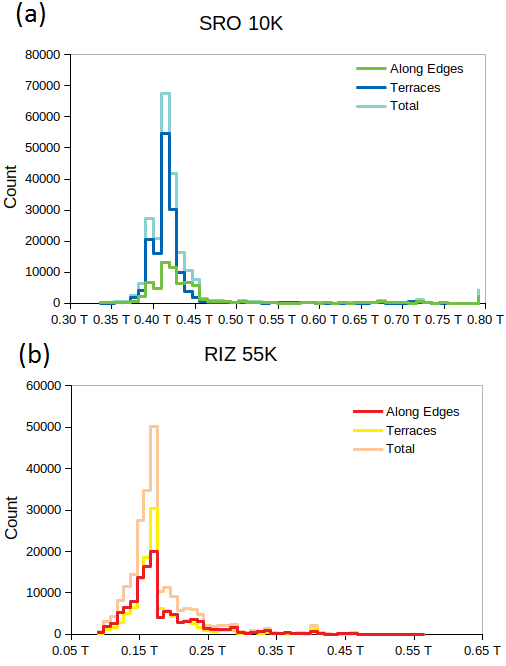
These field maps can be used for further analysis. We created histograms of areas adjacent to and far from the observed topographic step edges for the 4SRO-10-K and 4RIZ-55-K measurements to try and correlate changes in the field with these features. The results can be seen in Fig. 8: In both cases, the histograms close to the edges are slightly, but not significantly wider than on the terraces. For SRO, the distribution close to the edges shows a higher number of points switching later, while for RIZ, there is no obvious tendency to either direction. This is not an artefact of the larger scan range used for the RIZ measurements: If the SRO pictures are downsampled to feature a similar pixel resolution per m, the resulting histograms retain their shapes and features.
In fact, one might have the impression that domains monitored at an early stage of nucleation or at the later annihilation stage, do resemble isolated skyrmion bubbles such as the ones reported for metallic multilayer systems Pt/Ir/Co Moreau-Luchaire16 . However, our MFM investigations clearly cannot support this picture:
-
•
Firstly smallest feature sizes that could possibly be interpreted as skyrmions are of a nm size only, but mostly at the resolution limit of our MFM investigations.
-
•
Secondly, these bubble-like features occur quite rarely, and always as isolated structures that never form a continuous SkL.
Our MFM investigations hence cannot support the presence of any skrymions in these samples, neither isolated skyrmions nor any SkL, as we had found in many other single crystalline materials Milde13 ; Kezsmarki15 ; Milde16 ; Zhang16 ; Butykai17 ; Neuber18 . What seems much more likely though, is that the local sample inhomogeneities (stoichiometry, band-structure) reflected through the varying local coercive fields, are the origin for mimicking the THE behavior in our transport data. The anomalous Hall constant in turn varies slightly and impacts the AHE loops at 55 K and 60 K to differ from both the Kerr loops and local-scale magnetization loops acquired by MFM.
VI Conclusions
Our correlated study involving MOKE, nc-SFM, MFM, and Hall transport proves that subtle differences in both the magnetization and structural overgrowth of the 4uc SRO layered thin film are the origin for both macroscopic transport anomalies and nanoscopic magnetic hysteresis fluctuations. MOKE and MFM results are extremely consistent when analyzing both type of samples, the bare 4uc SRO film PLD grown on vicinal STO(100), and the 4SRO overgrown by 2uc SIO and 2uc SZO. Our results strongly indicate that anomalies of the Hall resistance loops, which resemble a topological Hall effect contribution, may have other origins than non-trivial topological magnetic domains (e.g. isolated skyrmions or skyrmion lattices). Inhomogeneities of the local stoichiometry may result in variations of the local magnetization switching behavior and affect the anomalous Hall constant, and thus impact on the AHE resistivity loops measured while switching the magnetization of the samples between the saturated states.
VII References
References
- (1) Karplus, R., Luttinger, J.M., Phys. Rev. 95:1154–1160, (1954).
- (2) Nagaosa, N., Sinova, J., Onoda, S., MacDonald, A.H., Ong, N.P., Rev. Mod. Phys. 82:1539–1592, (2010).
- (3) Bruno, P., Dugaev, V.K., Taillefumier, M., Phys. Rev. Lett. 93:096806, (2004).
- (4) Neubauer, A., Pfleiderer, C., Binz, B., Rosch, A., Ritz, R., Niklowitz, P.G., Böni, P., Phys. Rev. Lett. 102:186602, (2009).
- (5) Matsuno, J., Ogawa, N., Yasuda, K., Kagawa, F., Koshibae, W., Nagaosa, N., Tokura, Y., Kawasaki, M., Science Advances 2:e1600304, (2016).
- (6) Fert, A., Cros, V., Sampaio, J., Nature Nanotechnology 8:152–156, (2013).
- (7) Mizuno, H., Yamada, K.T., Kan, D., Moriyama, T., Shimakawa, Y., Ono, T., Phys. Rev. B 96:214422, (2017).
- (8) Ohuchi, Y., Matsuno, J., Ogawa, N., Kozuka, Y., Uchida, M., Tokura, Y., Kawasaki, M., Nature Communications 9:213, (2018).
- (9) Sohn, B., Kim, B., Choi, Y., Noh, T.W., Kim, C. Topological hall effect in ultra-thin srruo3 film 2018 . URL http://meetings.aps.org/link/BAPS.2018.MAR.R22.4.
- (10) Wang, L., Feng, Q., Kim, Y., Kim, R., Lee, K., Hoon, Pollard, S.D., Shin, Y.J., Zhou, H., Peng, W., Lee, D., Meng, W., Yang, H., Han, J.H., Kim, M., Lu, Q., Noh, T.W., Nature Materials 17:1087 – 1094, (2018).
- (11) Meng, K.Y., Ahmed, A.S., Baćani, M., Mandru, A.O., Zhao, X., Bagués, N., Esser, B.D., Flores, J., McComb, D.W., Hug, H.J., Yang, F., Nano Letters 19:3169–3175, (2019).
- (12) Kan, D., Moriyama, T., Kobayashi, K., Shimakawa, Y., Phys. Rev. B 98:180408, (2018).
- (13) Wu, L., Wen, F., Fu, Y., Wilson, J.H., Liu, X., Zhang, Y., Vasiukov, D.M., Kareev, M.S., Pixley, J.H., Chakhalian, J., arXiv:1907.07579, (2019).
- (14) Zhu, J., Li, H., Zhong, L., Xiao, P., Xu, X., Yang, X., Zhao, Z., Li, J., ACS Catalysis 4:2917 – 2940, (2014).
- (15) Kundu, A.K. Magnetic Perovskites - 2016 Synthesis, Structure and Physical Properties. Springer 2916 .
- (16) Snyder, G.J., arXiv:1904.12193, (2019).
- (17) Kan, D., Aso, R., Kurata, H., Shimakawa, Y., APL Materials 3:062302, (2015).
- (18) Kan, D., Aso, R., Sato, R., Haruta, M., Kurata, H., Shimakawa, Y., Nature Materials 15:432–438, (2016).
- (19) Ziese, M., Bern, F., Pippel, E., Hesse, D., Vrejoiu, I., Nano Letters 12:4276–4281, (2012).
- (20) Kim, J.H., Vrejoiu, I., Khaydukov, Y., Keller, T., Stahn, J., Rühm, A., Satapathy, D.K., Hinkov, V., Keimer, B., Phys. Rev. B 86:180402, (2012).
- (21) Marshall, A.F., Klein, L., Dodge, J.S., Ahn, C.H., Reiner, J.W., Mieville, L., Antagonazza, L., Kapitulnik, A., Geballe, T.H., Beasley, M.R., Journal of Applied Physics 85:4131–4140, (1999).
- (22) Klein, L., Marshall, A., Reiner, J., Ahn, C., Geballe, T., Beasley, M., Kapitulnik, A., Journal of Magnetism and Magnetic Materials 188:319 – 325, (1998).
- (23) Landau, L., Reiner, J.W., Klein, L., Journal of Applied Physics 111:07B901, (2012).
- (24) Groenendijk, D.J., Manca, N., Mattoni, G., Kootstra, L., Gariglio, S., Huang, Y., van Heumen, E., Caviglia, A.D., Applied Physics Letters 109:041906, (2016).
- (25) Pugh, E., Rostoker, N., Reviews of Modern Physics 25:151–157, (1953).
- (26) Fang, Z., Nagaosa, N., Takahashi, K.S., Asamitsu, A., Mathieu, R., Ogasawara, T., Yamada, H., Kawasaki, M., Tokura, Y., Terakura, K., Science 302:92–95, (2003).
- (27) Ziese, M., Vrejoiu, I., Physical Review B - Condensed Matter and Materials Physics 84:1–8, (2011).
- (28) Thomas, S., Kuiper, B., Hu, J., Smit, J., Liao, Z., Zhong, Z., Rijnders, G., Vailionis, A., Wu, R., Koster, G., Xia, J., Phys. Rev. Lett. 119:177203, (2017).
- (29) Qin, Q., Liu, L., Lin, W., Shu, X., Xie, Q., Lim, Z., Li, C., He, S., Chow, G.M., Chen, J., Advanced Materials 31:1807008, (2019).
- (30) Kazakova, O., Puttock, R., Barton, C., Corte-León, H., Jaafar, M., Neu, V., Asenjo, A., Journal of Applied Physics 125:060901, (2019).
- (31) Gan, Q., Rao, R.A., Eom, C.B., Wu, L., Tsui, F., Journal of Applied Physics 85:5297–5299, (1999).
- (32) Ziese, M., Vrejoiu, I., Hesse, D., Phys. Rev. B 81:184418, (2010).
- (33) Schultz, M., Reiner, J.W., Klein, L., Journal of Applied Physics 105:07E906, (2009).
- (34) Xia, J., Siemons, W., Koster, G., Beasley, M.R., Kapitulnik, A., Phys. Rev. B 79:140407, (2009).
- (35) Otsu, N., IEEE Transactions on Systems, Man, and Cybernetics 9:62–66, (1979).
- (36) Moreau-Luchaire, C., Moutafis, C., Reyren, N., Sampaio, J., Vaz, C.A.F., Van Horne, N., Bouzehouane, K., Garcia, K., Deranlot, C., Warnicke, P., Wohlhüter, P., George, J.M., Weigand, M., Raabe, J., Cros, V., Fert, A., Nature Nanotechnology 11:444–448, (2016).
- (37) Milde, P., Koehler, D., Seidel, J., Eng, L.M., Bauer, A., Chacon, A., Kindervater, J., Muehlbauer, S., Pfleiderer, C., Buhrandt, S., Schuette, C., Rosch, A., Science 340:1076–1080, (2013).
- (38) Kezsmarki, I., Bordacs, S., Milde, P., Neuber, E., Eng, L.M., White, J.S., Ronnow, H.M., Dewhurst, C.D., Mochizuki, M., Yanai, K., Nakamura, H., Ehlers, D., Tsurkan, V., Loidl, A., Nature Materials 14:1116+, (2015).
- (39) Milde, P., Neuber, E., Bauer, A., Pfleiderer, C., Berger, H., Eng, L.M., Nano Letters 16:5612–5618, (2016).
- (40) Zhang, S.L., Bauer, A., Burn, D.M., Milde, P., Neuber, E., Eng, L.M., Berger, H., Pfleiderer, C., van der Laan, G., Hesjedal, T., Nano Letters 16:3285–3291, (2016).
- (41) Butykai, A., Bordacs, S., Kezsmarki, I., Tsurkan, V., Loidl, A., Doering, J., Neuber, E., Milde, P., Kehr, S.C., Eng, L.M., Scientific Reports 7 (2017).
- (42) Neuber, E., Milde, P., Butykai, A., Bordacs, S., Nakamura, H., Waki, T., Tabata, Y., Geirhos, K., Lunkenheimer, P., Kersmarki, I., Ondrejkovic, P., Hlinka, J., Eng, L.M., Journal of Physics: Condensed Matter 30 (2018).
VIII Acknowledgements
G.M., D.I., P.M. and L.M.E. gratefully acknowledge financial support by the German Science Foundation (DFG) through the Collaborative Research Center Correlated Magnetism: From Frustration to Topology (CRC1143) Project No. 247310070, the SPP2137 (Project No. EN 434/ 40-1), and projects No. EN 434/ 38-1 and No. MI 2004/ 3-1. L.M.E. also gratefully acknowledges financial support through the Center of Excellence - Complexity and Topology in Quantum Matter (ct.qmat) - EXC 2147. I.L-V. thanks the DFG for financial support (project LI3015/3-1, No. 335038432, and project LI3015/5-1, No. 403504808 within SPP 2137) and through the CRC1238.
IX Competing financial interests
The authors declare no competing financial interests.
Supplementary Online Material
S1 Pulsed Laser Deposition
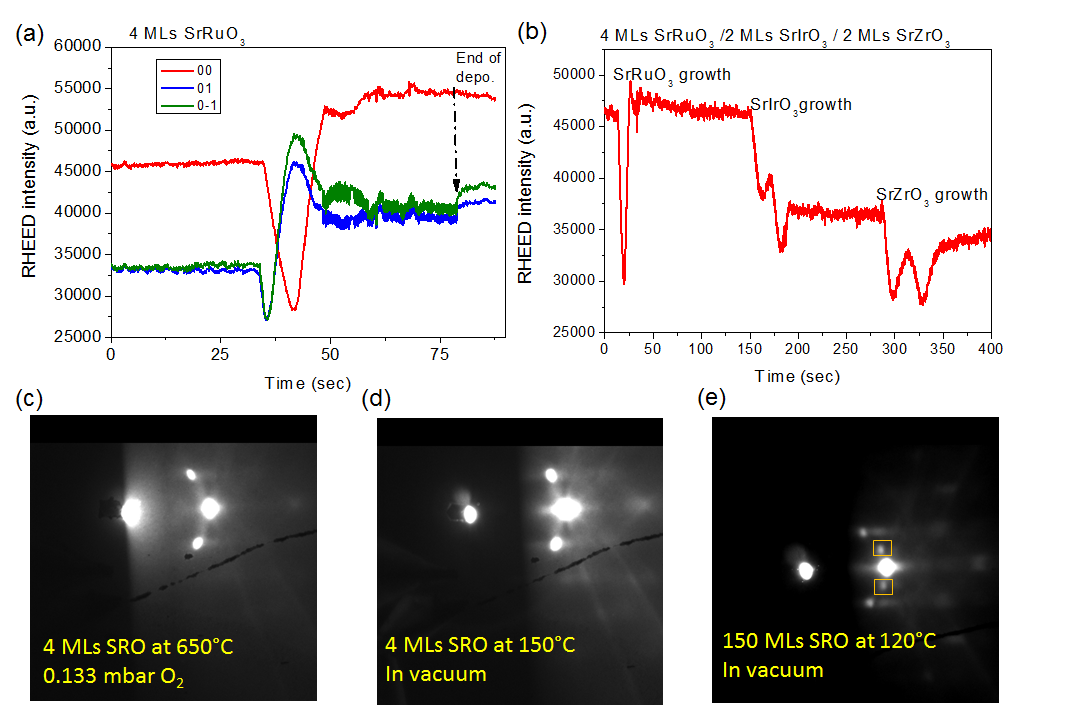
We monitored the PLD layer growth by reflective high energy electron diffraction (RHEED), in order to observe the growth mode and also to calibrate the layer thickness of the individual layers of the samples. Fig. S.1 summarizes the RHHED investigations of both the 4SRO [Fig. S.1(a)] and 4RIZ [Fig. S.1(b)] sample, where the intensity of the RHEED specular spot (00) is plotted in red. These intensity behaviors indicate that the SRO layer in both samples was growing in a step-flow manner up to the 4uc nominal thickness, while the SIO and SZO layers for the 4RIZ sample grew in layer-by-layer mode to the desired 2uc thickness [two oscillations are monitored during SIO and SZO growth; see Fig. S.1(b)].
The RHEED patterns taken after the 4uc SRO layer growth at and indicated a very smooth growth pseudomorphic to the STO(100) substrate, also showing no orthorhombic reflections. In comparison, the RHEED pattern of a thick SRO film (150 MLs, i.e. about 60 nm thick) grown under the same conditions, shows orthorhombic reflections when cooled down to [see Fig. S.1(c)].
S2 MOKE investigations
The results of the magneto-optical Kerr effect investigations of the 4SRO film are summarized in Fig. S.2. The squarish hysteresis loops are in good agreement with the sharp magnetization reversal observed in the microscopic MFM studies. Above 20 K, the background contribution is much larger than the signal originating from the bare 4 uc SRO film disabling a proper extraction of the sample contribution.
In Fig. S.3 we summarize the magneto-optical Kerr effect studies of 4RIZ film. In accordance with the MFM investigations, the Kerr rotation angle loops show the switching behavior of a conventional ferromagnet for the magnetic field applied along the magnetic easy axis for the whole ferromagnetic temperature range. As shown in Fig. S.3(c), the coercive field strength exhibits a fast decrease with increasing temperature. The finite coercive field strength at 80 K is related to the enhancement of the ferromagnetic transition temperature compared with the bare SRO thin film.

S3 MFM measurement details on the 4SRO and 4RIZ thin-film samples
S3.1 4SRO ultra-thin film at 10 K
The series of MFM measurements of bare 4uc SRO ultra-thin film were performed down to the lowest temperature that is possible with our SFM setup, which is approximately 10 K. A series of relevant 10-K-MFM images as acquired while sweeping the external magnetic field from +2 T to -2 T, are displayed in Fig. S.4. At +2 T, the 4SRO sample is magnetically saturated. When reaching the zero field, no domain nucleation with opposite magnetization is observed, while the full SRO layer remains fully magnetized.
Nevertheless, a small but non-zero magnetic contrast is always visible at 0 T whenever comparing areas of a 4 and 3 uc height. Due to the different magnetic susceptibilities of these layers a clear, net magnetization for the 3 uc structure arises that in turn reveals the documented MFM contrast.
At the negative field value of -60 mT, the tip changes its magnetization direction and aligns with the applied field.
Starting at a field of -360 mT domains nucleate, with tiny round domains of less than 100 nm appearing, visible as dark round spots in Fig. S.4(b). For a field of -390 mT [Fig. S.4(c)] more domains appear and part of those already nucleated expand in size or coalesce with neighbors [Fig. S.4(d)]. In a field of -500 mT [Fig. S.4(e)] almost the entire area switched its magnetization, except a few domains which switch only in fields higher than -1 T. These domains correspond to the topographic features observed as islands formed on top of the terraces in Fig. 4(a), i.e. to areas of 5 uc thick SRO film.

Measurements performed on reversing the field between -2 T and positive fields exceeding the coercive field allowed us to observe memory effects in the nucleation of the domains. Comparing the MFM images taken in a field of 360 mT [Fig. S.4(g)] and the MFM image scanned in -360 mT [Fig. S.4(b)], we observed that most of the nuclei appeared at the same sites. As not only these domains appear in the same positions, but these positions lie predominantly at step edges of either the SRO or STO surfaces, it has to be assumed that there is a strong preference for the nucleation to start at the sites of lattice defects.
From the switched magnetization versus unswitched magnetization area a coercive field value of about 400 mT was determined for 4 uc, see Fig. S.4(c). The thickness of 5 uc in SRO layer lead to sensitively higher coercive field above 1 T, that is close to the value in SIO/SRO/SZO trilayered heterostructure. The magnetization almost reached saturation for 500 mT [Fig. S.4(n)], only few domains with size smaller than 100 nm were unswitched, besides those domains related to the island in the topography, which switch in high fields.
S3.2 4SRO ultra-thin film at 55 K
Imaging at 55 K revealed similarities in the observed phenomenons of differing coercive fields for areas of differing film thickness and a strong pinning to specific sites. Representative images from the MFM field sweeps are shown in Fig. S.5.
The sample was magnetized in a high perpendicular magnetic field of 2 T and slowly switched to the low magnetic field of -2 T, and back. The coercive field is drastically reduced with the temperature, with the first domain of opposite magnetization is observed at applied field of -12 mT. Unlike for low temperatures, the shape and size of the nucleated domains (about 400 nm) match the terrace width of the substrate. All domains reach across the entire width of its step, even the line-shaped domain visible in Fig. S.5(a), marked with a white ellipse, strongly indicating that the nucleation of domains begins by a very rapid elongation of the initial nucleus perpendicular to the step edge.

While no memory effect could be observed for the initial nucleation due to the speed of domain growth, comparing the locations of domain walls across several images reveals a number of domain wall pinning sites, at which the growth stops for a time (Compare the red lines in Fig. S.5(d) to those in (a) and (b)).
For the areas with 5 uc of SRO, the coercive field remains higher than for the main terraces, although it is similarly reduced by the higher temperature, to a value of approximately 250 mT.
For a field value between -18 mT and -20 mT, the fraction of domains of magnetization aligned with the applied field direction reaches 50%. Thus the value of the coercive field is a bit lower than 20 mT at 55 K. For a field value of -30 mT almost the entire scanned area switched its magnetization in the direction of the applied field.
Two important conclusions can be drawn for the behavior of field-driven magnetic domains in bare SRO ultra-thin film at 55 K. Firstly, formation of the domains at this temperature is strongly influenced by the step-and-terrace morphology of the substrate. The size of nucleated domains matches the terrace width, and once formed these domains grow along the terraces and do not cross the surface steps. The 0.39 nm high surface steps appear to act as potential barrier for the domain wall propagation.
Strong memory effects were exhibited as the domains nucleated at the same sites for both positive and negative field of about the same value. Secondly, at no stage of the magnetization reversal between saturation states did we observe the formation of either domains or skyrmions.
S3.3 4SRO ultra-thin film at 80 K
MFM investigations of bare SRO ultra-thin film at 80 K are presented in Fig. S.6. It shows that the 4 uc thick SRO terraces remain in its paramagnetic phase, while the 5 uc thick areas still display ferromagnetic behavior. It is the first important difference to the SIO/SRO/SZO trilayer.

S3.4 4RIZ heterostructure at 10 K
In contrast to the growth of the domains for the bare film, where the magnetic states of neighboring steps could be regarded as independent, the growth in the trilayer 4RIZ samples progresses both along and perpendicular to the steps. Similarly to the bare sample, the speed of the growth appears strongly dependent on local features, with swift growth to a fixed point followed by uncorrelated pauses of stagnation. Similarly, not every spot appears equally suitable for the cross-step growth, as the straight lines of step edges can still be observed as a strongly preferred domain edge.

One example of pinning sites can be seen in Fig. S.7, which shows slices taken from successive sweeps of the same location on the crystal. In both directions and despite the long time (3 days) between those sweeps, a hammerhead shaped domain is visible, remaining stable against the magnetization reversal longer than the surrounding material. This structure spans several step edges in width and has several parallel boundary lines at an angle to the grid given by the vicinal surface, indicating a stronger influence of a different crystallographic direction on the domain wall stability at these spots.
S3.5 4RIZ heterostructure at 80 K
The magnetic domains in 4RIZ heterostructure formed upon zero-field cooled to 80 K, shown in the MFM image in Fig. S.8(a). The domains have random shapes and sizes ranging from about 100 nm to a few m. However, the domain patterns show a clear influence of the terrace ledges when they form after applying a large perpendicular magnetic field of 2 T, then removing the saturation field and applying a field of opposite polarity (values of 40-50 mT, which exceeded the coercive field at 80 K). The domains formed follow the direction of the terraces, being elongated parallel to the ledges and extended in widths primarily across a single terrace (200-450 nm width), as is shown in Fig. S.8(b).
S4 Local-scale MFM hysteresis loops and Otsu’s method
To extract magnetization value and therefore hysteresis from the MFM images, an thresholding approach is used: A threshold value is chosen for the image such that the upwards magnetized areas are above this value in signal, and the downwards magnetized areas below. Then, the total magnetization, as a ratio compared to the saturation magnetization, can be simply obtained as a ratio of the thus selected areas.
The thresholding is automated using the optimization measure invented by Noboyuki Otsu Otsu79 , splitting the image such that the sum of weighted variances of the resulting parts is minimal. This algorithm is known to produce good results for images containing two classes of brightness, even if the width of the classes is so large as to cause significant overlap in the histogram.
For the initial saturated state and the onset of nucleation, the assumptions for the validity of Otsu’s method are not fulfilled, resulting in the algorithm giving a nonsensical value for the magnetization based on its attempt to separate the measurement noise on top of the constant saturation value. To correct for these cases, additional fixed thresholds were chosen above and below the average value of the image, with their value corresponding to the greatest distance of Otsu’s threshold value to the image average. These thresholds are sensitive to the initial nucleation and final domains respectively, allowing for the total hysteresis to be stitched together from the three curves by merging them at their tangent points.
While the method can only be applied for ferromagnetic transitions and is insensitive to paramagnetic responses, it at the very least gives the correct value for the coercive field. In addition, as it is based on the MFM images, it can be used to spatially resolve this field, by determining when any individual pixel switches magnetization, as determined by its progress over the relevant threshold.