Blood lactate concentration prediction in critical care patients: handling missing values
Abstract
Blood lactate concentration is a strong indicator of mortality risk in critically ill patients. While frequent lactate measurements are necessary to assess patient’s health state, the measurement is an invasive procedure that can increase risk of hospital-acquired infections. For this reason we formally define the problem of lactate prediction as a clinically relevant benchmark problem for machine learning community so as to assist clinical decision making in blood lactate testing. Accordingly, we demonstrate the relevant challenges of the problem and its data in addition to the adopted solutions. Also, we evaluate the performance of different prediction algorithms on a large dataset of ICU patients from the multi-centre eICU database. More specifically, we focus on investigating the impact of missing value imputation methods in lactate prediction for each algorithm. The experimental analysis shows promising prediction results that encourages further investigation of this problem.
1 Introduction
Blood lactate concentration is a biochemical indicator of tissue oxygen delivery and extraction, measured through a blood gas analyser. Inadequate tissue oxygenation results in increased lactate generation. In healthy individuals there is a continuous cycle of lactate production and clearance (metabolised primarily in the liver), while in critically ill patients lactate metabolism is impaired, resulting in elevated lactate concentration. Elevated blood lactate levels are correlated with hospital mortality (Nichol et al.,, 2010; Husain et al.,, 2003), therefore frequent lactate measurements are necessary to track and assess patients’ state. However, lactate concentration cannot be measured without drawing arterial or venous blood, which is an invasive procedure that can increase risk of infections. As a consequence, blood gas analysis may not be ordered as frequently leading to sub optimal rates of lactate measurements (Rhee et al.,, 2015).
In this respect, there is ample potential for machine learning methods to play a significant role in lactate guided clinical decision making. Such role is especially important when considering that lactate-guided therapy significantly reduced hospital mortality and length of stay as evidenced by several multicentre randomised controlled trials (Jansen et al.,, 2010; Jones et al.,, 2010; Tian et al.,, 2012). However, this potential has not been explored thus far.
Addressing the evident need for prediction of blood lactate concentration, we define a clinically useful problem (Wiens et al.,, 2019) and compare the performance of several machine learning methods in lactate prediction. Furthermore, we investigate the effect of imputation strategies and missing values on prediction performance. We evaluate the influence of missing value imputation and handling on lactate concentration prediction using 13,464 patients (containing 12,196,798 clinical records) extracted from multi-centre eICU critical care database (Pollard et al.,, 2018). The main contributions of our work are as follows:
-
–
We define a clinically useful problem in critical care, that of blood lactate concentration prediction, and investigate it using machine learning methods;
-
–
We compare performance of different algorithms on lactate prediction using a large patient dataset collected from multiple hospitals and ICU units;
-
–
We investigate the effect of missing value imputation and handling methods on performance of both traditional machine learning and deep learning algorithms on the defined problem;
-
–
Our work can serve as a baseline for future research work to build on top of our results and further advance decision making in critical care.
The source code for our experiments will be made public at our GitHub repository so that anyone with access to eICU database can replicate our experiments or build upon our work.
2 Methods
The first step to successfully deploy machine learning algorithms in healthcare is identifying the right problem to focus on, where the right problem should be of clinical relevance and have appropriate data (Wiens et al.,, 2019). Accordingly, we first define the lactate concentration prediction problem and then investigate the data and its challenges. Finally, the well-known prediction models are introduced as baseline methods.
2.1 Problem definition
We formally define the problem of lactate concentration prediction as follows:
For each patient with the set of clinical parameters where represents blood lactate concentration, represents the set of all other clinical measures, and is the time index, we want to predict based on where is the selected set of clinically relevant measurements out of . Therefore, we formulate a regression problem using equation 1.
| (1) | |||
In other words, the objective of lactate prediction is to predict the blood lactate concentration of a patient in the next hours using a selected set of their measurements taken in the past hours.
2.2 Dataset
For our work we use eICU Collaborative Research Database (Pollard et al.,, 2018), a multi-center intensive care unit database with high granularity data for over 200,000 admissions to ICUs monitored by eICU programs across the United States. The eICU database comprises 200,859 patient unit encounters for 139,367 unique patients admitted between 2014 and 2015 to hospitals located throughout the US. We selected adult patients only with at least 2 lactate measurements that stayed at an ICU unit for more than 18 hours.
The final patient cohort contained 13,464 patients (14,477 ICU stays) with 12,196,798 clinical records, where we grouped these records into 2 hour windows. Patient’s mean age was 61.8 years (45% female). The complete process of data preparation is described in Section 3.
| Age | 61.815.7 |
|---|---|
| LoS* (day) | 6.8 9.3 |
| Male | 7391 (55%) |
| Female | 6073 (45%) |
| Alive* | 10906 (81%) |
| Dead* | 2558 (19%) |
| Top Diagnosis | |
| Sepsis, Pulmonary | 1634 (12.1%) |
| Cardiac arrest | 1155 (8.5%) |
| Sepsis, Renal/UTI | 859 (6.3%) |
| Sepsis, GI | 714 (5.3%) |
2.3 Challenges
Critical care is an especially data-intensive field, as continuous monitoring of patients in Intensive Care Units (ICU) generates large streams of data. This stream of data creates a great opportunity for the machine learning community and reciprocally machine learning can enhance decision making in critical care (Johnson et al., 2016a, ). However, critical care data suffers from several limitations. The main challenges of ICU data can be categorised into three groups: the challenge of data acquisition, the corruption of data, and inherent complexity of ICU data (Johnson et al., 2016a, ). Thanks to the recent availability of large ICU databases such as eICU (Pollard et al.,, 2018) and MIMIC III (Johnson et al., 2016b, ), the first challenge is becoming less severe.
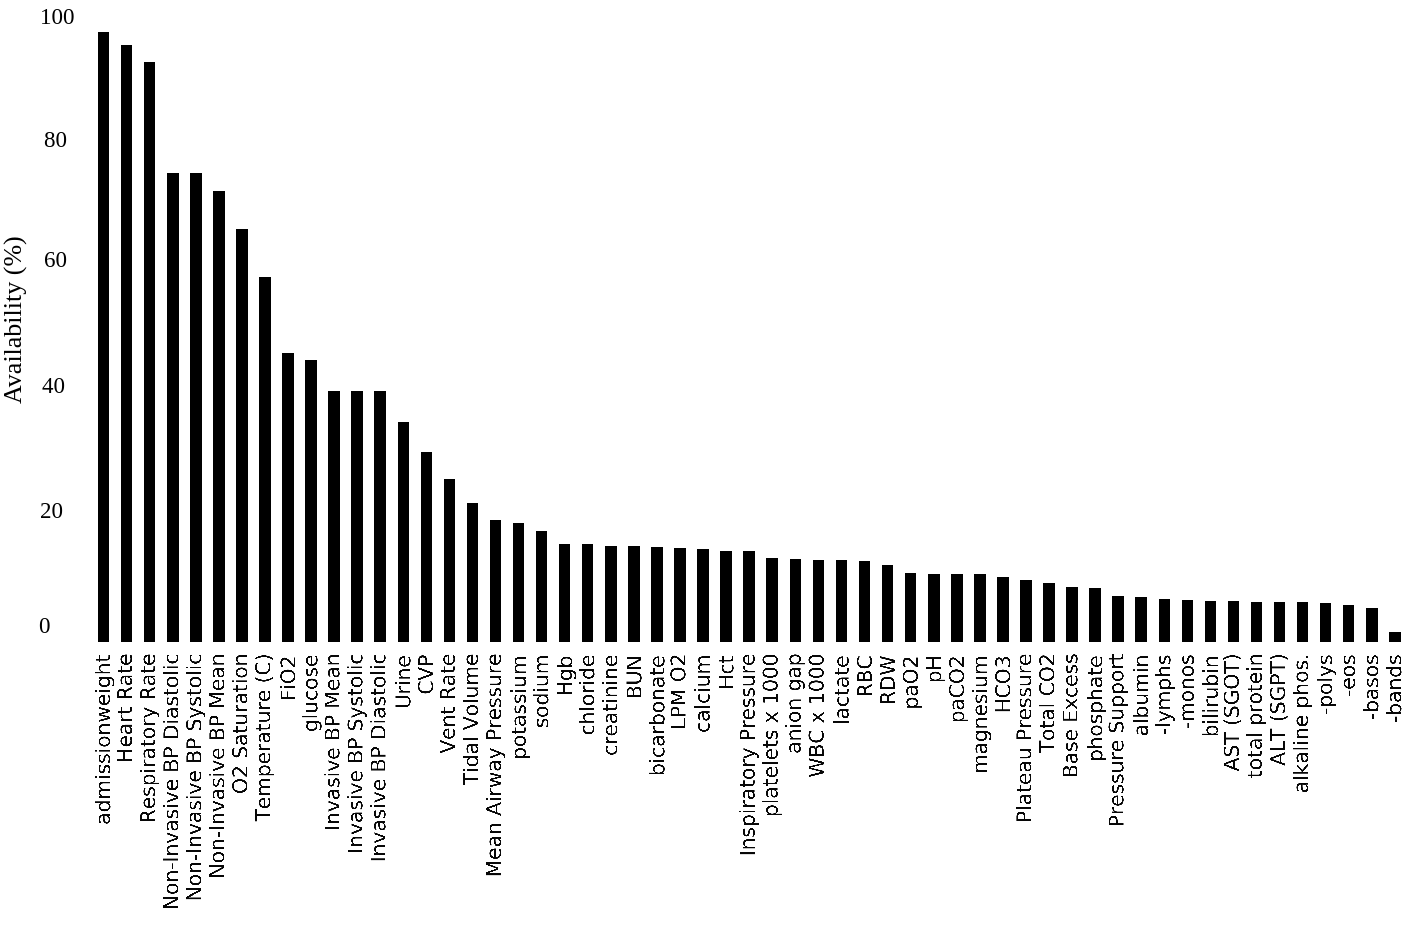
The corruption of data mainly refers to noise and missing values. It is common to handle noise based on domain knowledge of statistical rules-of-thumb by simply eliminating the unreasonable values. Missing values on the other hand has attracted a lot of attention since most machine learning methods do not function with them (Stiglic et al.,, 2017). Figure 1 shows the percentage of observed data in the relevant features of eICU dataset regarding lactate prediction. The simplest way to handle missing values is to only consider the complete cases, called complete case analysis. Although simple, based on the missing type and rate it could be effective (Hughes et al.,, 2019). In our case the missing rate is so high that complete case analysis is not possible. Addressing missing values is typically dependent on the cause of missingness. Statistically speaking, there are three types of missing values: missing completely at random (MCAR) which happens on an unrelated cause, missing at random (MAR) which implies a relation between missing value and other present values, and missing not at random (MNAR) which implies a relationship between the value of the variable and its missingness (Rubin,, 1976).
ICU data can contain all types of missingness. Malfunction of machines or human mistakes in ICU can cause MCAR in data. For example, if the material of a test is accidentally broken, the test results would be missing completely at random. This way, missingness is not related to either observed or missing data. MAR is also unavoidable since assessment of some measures are conditioned on the value of other measures. In other words, availability of clinical test may be dependent on patient observation or results of previous tests. In other words, missing at random depends on the observed data. The last but not the least cause of missingness is difference in frequency of assessing each measure. For example some measures are assessed on an hourly basis, such as blood pressure, and some are performed only daily, such as lab tests. Since this type of missingness is informative about the variable itself, it can be considered as MNAR. Another case for MNAR is that normal values are very likely to be missed in some variables, such as individuals’ normal weight.
The third category of challenges reflect the inherent complexity of ICU data which machine learning methods will be responsible to handle. Specifically, we call your attention to two considerable challenges in the introduced lactate prediction problem: complex temporal relations and imbalanced data. The ICU data is longitudinal and each measure can be a time series with varied length and frequency. These time series are not stationary and irregular in time since performing the measurements depends on the status of patient and decision of caregiver.
Predicting blood lactate concentration is a particularly challenging problem as distribution of lactate measurements follows a long-tailed distribution, resulting in a highly imbalanced dataset. Lactate concentration levels for critically ill patients can be divided into four categories: normal (0 to 2.00 ), mild (2.01 to 4.00 ), moderate (4.01 to 6.00 ) and severe hyperlactemia (> 6.01 ) (Nichol et al.,, 2010).
| 0 to 2.00 | 46212 | 53.1% |
|---|---|---|
| 2.01 to 4.00 | 23037 | 26.5% |
| 4.01 to 6.00 | 7769 | 8.9% |
| > 6.01 | 9979 | 11.5% |
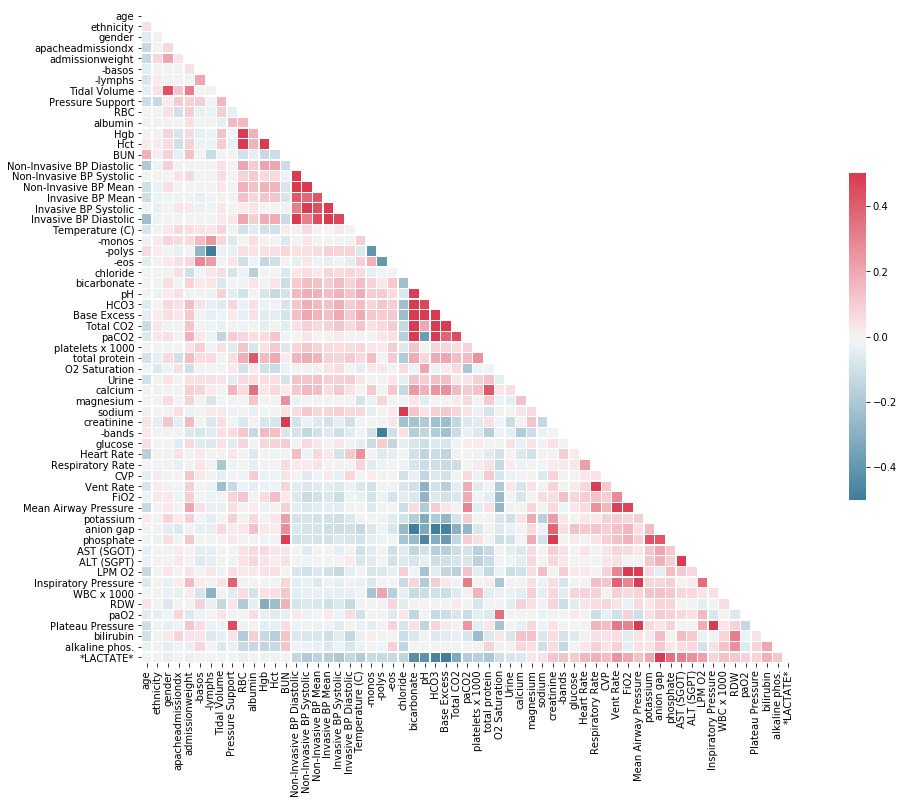
As shown in Table 2 almost 80% of lactate readings are concentrated within normal and mild levels, rendering the problem of predicting moderate and severe hyperlactemia particularly challenging. Furthermore, there is a low linear correlation between lactate levels and relevant clinical parameters (shown in Appendix A, Figure 3).
2.4 Imputation methods
The proper imputation method for lactate prediction should consider all forms of missingness in ICU data. Mean, Group mean (Sim et al.,, 2015), median, zero and forward imputation are basic single-value imputation methods, which only consider the information in the past values of the variable. Therefore, they work best for data under MCAR assumption and introduce bias and loss of information under MAR or MNAR cases. Yet, these methods are very popular because of their simplicity to implement and interpret.
Multiple imputation (Azur et al.,, 2011), K Nearest Neighbours (Batista et al.,, 2002), Matrix Factorisation (Koren et al.,, 2009), PCA (Josse and Husson,, 2012), SoftImpute (Mazumder et al.,, 2010) and Random Forest (Stekhoven and Bühlmann,, 2011) are the most known traditional machine learning methods that find the substitute for missing values based on the relation between observed and missing features. These methods perform best when handling MAR cases. In MCAR case the missingness is completely at random but the missing value might have a relation with other present features; therefore MCAR cases can also benefit from these methods.
Finally, MNAR cases are the hardest to manage. Resampling and alignment are widely used to correct the difference of frequencies in measurements and their uneven alignments. Even after that, a lot of missing values remain. A helpful solution to capture the information behind missingness of variables is to use missing indicators. These indicators can either be used directly aside data or inside the prediction model structure. Note that indicators can also be useful in MAR and MCAR, since they differentiate the imputed values from the observed ones and the prediction method can use this information to ignore bad imputations.
2.5 Prediction models
There are a vast number of successful regression methods used for healthcare data which could be grouped into three categories: the statistical regression methods, the traditional machine learning methods and the rising deep learning methods. Since this problem is basically a regression problem of a real value, it is only logical to apply statistical regression methods as a baseline. The statistical regression methods investigate the relationship between the target variable and other variables. There are several types of statistical regression methods including linear, polynomial, step-wise, ridge, and lasso. Here we apply lasso regression to benefit from its abilities in feature selection and reducing over-fitting. Yet, this method is linear and can only model linear relations in data.
To model the nonlinear relationships in the data, machine learning offers a wide range of methods including support vector regression, back propagation neural networks, K nearest neighbours and decision trees. Among these, random forest (RF) which is an ensemble of decision trees, has shown great performance with clinical data. This may be because RF is able to learn complex and highly non-linear relationships in data and yet it is easily interpretable.
Another informative characteristic of the ICU data is its temporal relations which is not naturally covered by either lasso regression or random forest. Recurrent Neural Networks (RNN) address the temporal relation of data by maintaining an internal state. LSTM and GRU are the well-known RNN models which use gating mechanism to avoid gradient explosion/vanishing. Consequently, they are the preferred choice for ICU data.
3 Results and discussion
In this section the introduced lactate prediction problem is investigated using several imputation methods and prediction models. The parameter of the task (introduced in Section 2), is set to 6 hours based on the recommendation of SSC on serial lactate testing (Levy et al.,, 2018) and is set to 2. In other words, we want to predict the next record (2 hours) of lactate level for a patient based on their available data from at least 6 previous hours. To do so, all details of the data preparation and parameters of both imputation methods and prediction methods are provided.
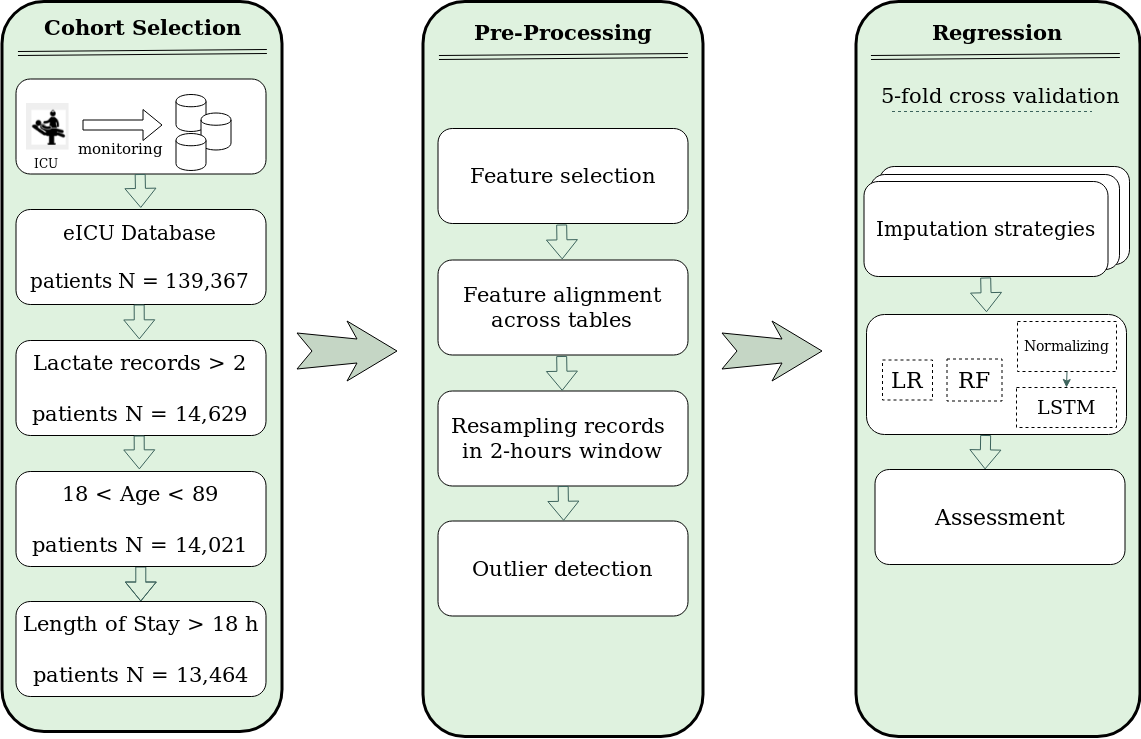
Data preparation. Data is prepossessed in six steps. (1) Patient cohort is selected based on three inclusion criteria; adult patients (age > 18), with at least two measured lactate levels, and with at least 18 hours length of stay in ICU. (2) The relevant variables are selected based on advice from the clinician. The eICU database consists of 31 different tables which document multiple aspects of each patient’s care such as doctor notes, laboratory tests, active problems, treatments planned, and more (Pollard et al.,, 2018). For our case study, the relevant clinical features for the selected cohort are outlined in Table 3. A detailed description of each variable is provided in the original eICU paper (Pollard et al.,, 2018). The Pearson correlation of the lactate and selected variables is provided in Appendix A. (3) Some features exist in more than one table under different names. These features are aligned to a unique feature in time. (4) The selected data is aligned in time since each feature is measured in an arbitrary time and frequency. We resampled time-series data into regularly aligned periods where each feature is sampled every 2 hours. In case a feature is measured more than once during each two hour interval, the last record is used. (5) Noise and outliers are addressed as follows: for each feature, the valid interval is defined based on clinical knowledge and the values out of the valid scope are considered as missing values. (6) The data is split into training and testing parts, which is done using five-fold cross validation where at each fold 80% of the data is considered as training and the rest is test data (the diagram in Appendix A, Figure 4 outlines cohort selection, data preprocessing and analysis pipeline).
| eICU Tables | Variables |
|---|---|
| Patient | gender, age, ethnicity, admissionweight, apacheadmissiondx |
| Lab | Respiratory Rate, O2 Saturation, FiO2, glucose, potassium, sodium, Hgb, chloride, creatinine, BUN, bicarbonate, LPM O2, calcium, Hct, platelets x 1000, anion gap, WBC x 1000, lactate, RBC, RDW, paO2, pH, paCO2, magnesium, HCO3, Total CO2, Base Excess, phosphate, Pressure Support, albumin, -lymphs, -polys, -eos, -basos, -bands, -monos, bilirubin, AST (SGOT), ALT (SGPT), total protein, alkaline phos. |
| NurseCharting | Heart Rate, Respiratory Rate, Temperature (C), Invasive BP Mean, Invasive BP Systolic, Invasive BP Diastolic, Non-Invasive BP Mean, Non-Invasive BP Systolic, Non-Invasive BP Diastolic, O2 Saturation, glucose, CVP, LPM O2, Total CO2 |
| RespiratoryCharting | Heart Rate, Respiratory Rate, FiO2, Total CO2, Tidal Volume, Inspiratory Pressure, LPM O2, Vent Rate, Plateau Pressure, Mean Airway Pressure, Pressure Support, Inspiratory Pressure |
| VitalPeriodic | Heart Rate, Respiratory Rate, Temperature (C), Invasive BP Mean, Invasive BP Systolic, Invasive BP Diastolic, CVP |
| VitalAperiodic | Non-Invasive BP Mean, Non-Invasive BP Systolic, Non-Invasive BP Diastolic |
| IntakeOutput | Urine |
Imputation settings. To investigate the impact of different imputation methods on prediction, we selected a wide range of methods based on their popularity in previous research. List of the selected methods and their description is provided in Appendix A, Table 5. Mean, Median and FeedForward are selected from a single imputation group. Also Group mean, based on severity scale of previous lactate (as shown in Table 2), is investigated. PCA, Matrix Factorization (MF), SoftImpute, KNN, MICE, and MissForest are picked from traditional machine learning solutions and missing indicators, while Auto-Encoder (AE) are examples of recent imputation methods. Generally, there are two types of architectures available for autoencoders (Charte et al.,, 2018): overcomplete, where there are more nodes in hidden layers rather than input layer and undercomplete, where hidden layers have fewer nodes than input layer. Our architecture for AE is similar to (Gondara and Wang,, 2017). As autoencoder needs a complete dataset for initialisation, missing values in training and test data are pre-imputed by mean and zero respectively. All the methods were applied using python based on fancyimpute, predictive_imputer, and sklearn open-source libraries. Also for all the machine learning methods, the default parameters proposed by their authors are used.
Prediction settings. Among the introduced prediction models, we compared the results of Lasso regression (LR), Random Forest (RF) and LSTM as is common practice. Since each patient has different number of ICU records, the data samples have different lengths as well. Lasso regression and Random Forest can not handle different sizes of samples and therefore all samples are zero padded to have the same size. To ease LSTM convergence, data is normalised to have zero mean and a standard deviation of one. The LSTM network has 2 layers of 1024 units with Glorot normalisation and tanh activation, each followed by a drop out layer of 0.6. Adam optimizer is used with learning rate starting from 0.0001 and the model is trained for 20 epochs with batch size 100. The LSTM model is implemented using Keras and Tensorflow as backend and one GTX 2080 Ti as GPU.
Evaluation Metrics. To measure the quality of imputation methods regarding lactate prediction while preserving the structure of data (no artificial missing values are added), we report Mean Absolute Error (MAE), Root Mean Squared Error (RMSE), and R-squared () as indicators of the predictive performance of the regression models. MAE measures the average magnitude of the errors in a set of predictions and RMSE is a quadratic scoring rule that measures the average square of the error. RMSE has the benefit of penalising large errors more and MAE is more interpretable. Both metrics are negatively-oriented scores. On the other hand R-squared measures the percent of variance explained by the model. This measure calculates how good is the model compared to naive mean model and it is positive oriented. We also report the standard deviation over cross validation folds.
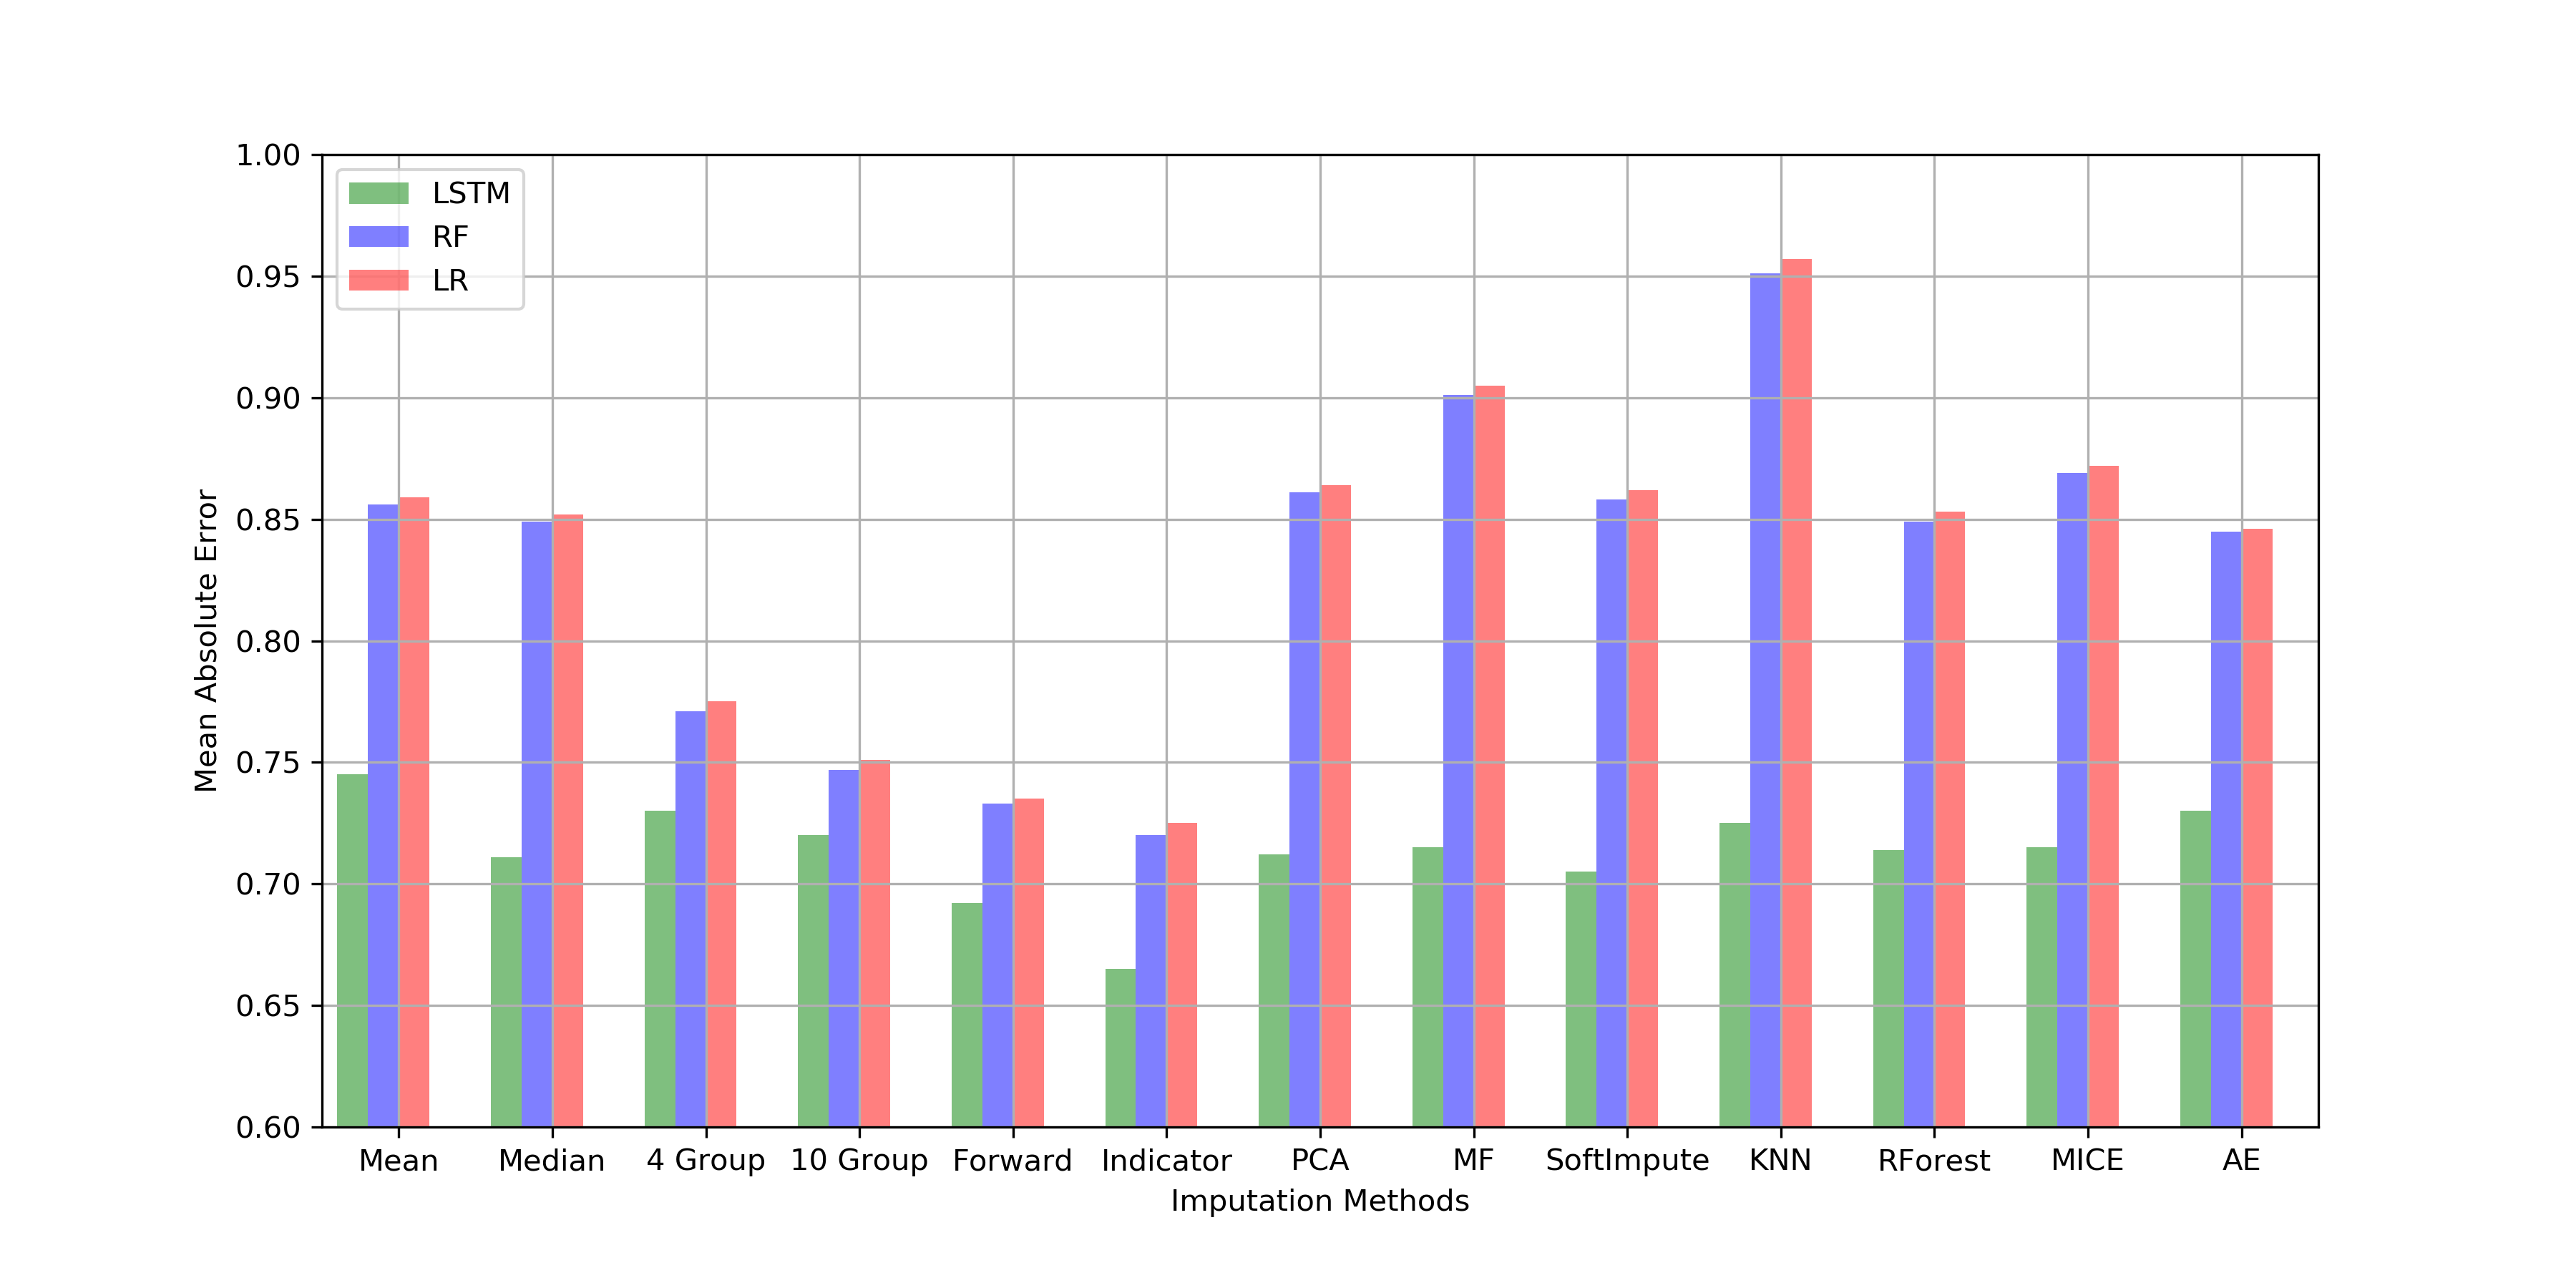
Results. All combinations of introduced prediction models and imputation methods are examined on eICU data and their results are reported in Table 4. The mean and standard deviation of each measure on five fold cross-validation of data is reported. The best results are shown in bold. To have a better understanding of the results, the MAE is plotted for all models and methods in Figure 2. The models are presented in colours and the imputation methods are in horizontal axis. As the results suggest, both regression model and imputation method affect the prediction results. LSTM performed significantly better compared to LR an RF using the same imputation method. Therefore, it can be concluded that the data contains complex relations not only between measurements but also across their values in time. On the other hand, missing values are best handled using Indicators and Mean method which indicates that missingness is meaningful and happens under MNAR as well as MAR and MCAR assumptions. Forward imputation also shows good results which is related to the fact that different frequency of measurement is the reason behind most of the missingness in ICU data. Since the frequency of a measurement is based on the importance of change in the value of that variable, it makes sense to use the last measured value between the measurement periods.
| Measure | LR | RF | LSTM | |
|---|---|---|---|---|
| MAE | Mean | 0.859 0.006 | 0.856 0.007 | 0.745 0.045 |
| Median | 0.852 0.007 | 0.849 0.009 | 0.711 0.006 | |
| Groups mean(4) | 0.775 0.006 | 0.771 0.007 | 0.730 0.004 | |
| Feed Forward | 0.735 0.008 | 0.733 0.009 | 0.692 0.008 | |
| Indicator | 0.725 0.009 | 0.720 0.010 | 0.665 0.009 | |
| PCA | 0.864 0.006 | 0.861 0.008 | 0.712 0.008 | |
| MF | 0.905 0.009 | 0.901 0.010 | 0.715 0.012 | |
| SoftImpute | 0.862 0.010 | 0.858 0.011 | 0.705 0.006 | |
| KNN | 0.957 0.010 | 0.951 0.010 | 0.725 0.006 | |
| MissForest | 0.853 0.008 | 0.849 0.005 | 0.714 0.010 | |
| MICE | 0.872 0.007 | 0.869 0.008 | 0.715 0.009 | |
| AE | 0.846 0.007 | 0.845 0.008 | 0.730 0.051 | |
| RMSE | Mean | 1.263 0.013 | 1.257 0.015 | 1.120 0.016 |
| Median | 1.259 0.014 | 1.253 0.016 | 1.100 0.014 | |
| Groups mean(4) | 1.155 0.009 | 1.149 0.011 | 1.113 0.017 | |
| Feed Forward | 1.120 0.014 | 1.115 0.015 | 1.075 0.016 | |
| Indicator | 1.090 0.013 | 1.085 0.016 | 1.016 0.025 | |
| PCA | 1.268 0.014 | 1.262 0.016 | 1.104 0.014 | |
| MF | 1.304 0.015 | 1.298 0.016 | 1.100 0.018 | |
| SoftImpute | 1.268 0.016 | 1.264 0.017 | 1.095 0.017 | |
| KNN | 1.357 0.016 | 1.349 0.017 | 1.110 0.011 | |
| MissForest | 1.254 0.016 | 1.248 0.011 | 1.100 0.011 | |
| MICE | 1.270 0.014 | 1.266 0.015 | 1.105 0.016 | |
| AE | 1.245 0.013 | 1.241 0.015 | 1.103 0.022 | |
| Mean | 0.475 0.010 | 0.480 0.013 | 0.585 0.022 | |
| Median | 0.478 0.009 | 0.483 0.012 | 0.601 0.006 | |
| Groups mean(4) | 0.561 0.010 | 0.566 0.013 | 0.592 0.011 | |
| Feed Forward | 0.587 0.008 | 0.591 0.011 | 0.620 0.013 | |
| Indicator | 0.605 0.012 | 0.610 0.013 | 0.660 0.017 | |
| PCA | 0.471 0.011 | 0.476 0.014 | 0.598 0.011 | |
| MF | 0.440 0.013 | 0.445 0.015 | 0.601 0.014 | |
| SoftImpute | 0.471 0.010 | 0.475 0.013 | 0.605 0.006 | |
| KNN | 0.391 0.011 | 0.397 0.016 | 0.595 0.010 | |
| MissForest | 0.482 0.007 | 0.487 0.006 | 0.601 0.012 | |
| MICE | 0.469 0.010 | 0.472 0.012 | 0.598 0.011 | |
| AE | 0.489 0.010 | 0.493 0.012 | 0.599 0.024 |
4 Related Work
There are no related works concerning lactate prediction; therefore, an overview on the problems defined on EHR data is provided, and then the literature of ICU data challenges are reviewed. While there is an extensive body of research on machine learning for secondary use of EHR data, the common benchmark problems are limited to mortality detection, length of stay (LOS) prediction, phenotyping and sepsis detection (Purushotham et al.,, 2017; Harutyunyan et al.,, 2017). These problems are well-defined with proper data and baseline results and consequently have been the primary focus of machine learning community for the last decade. Beside these, only a small number of other topics with medical relevance are considered by machine learning researchers (Zheng et al.,, 2017; Kawaler et al.,, 2012). Instead, the target has been to improve the results of the well-known benchmarks using different machine learning methods, from traditional to state of the art (Shickel et al.,, 2017). In (Harutyunyan et al.,, 2017), linear regression and LSTM-based methods are studied on the benchmark problems where unsurprisingly LSTM outperforms the linear models. Purushotham et al. provid the results of a range of methods including linear regression, tree-based models, neural networks and deep learning methods on the famous benchmark problems (Purushotham et al.,, 2017). Johnson et al. analyze the results of several studies on mortality detection and compare them with linear regression and random forrest (Johnson et al.,, 2017).
Another common research direction is to understand the challenges of health data and the best ways to handle them (Schmitt et al.,, 2015; Le et al.,, 2018). Vesin et al. are the first to properly address missing values in ICU data (Vesin et al.,, 2013) reporting that only 4 percent of published manuscripts mention and handle the missing values. Cismondi et al. demonstrate the effect of imputation on a real ICU database with 16 features and up to 69% of missingness (Cismondi et al.,, 2013). They used resampling and ignored those missing data that could be explained by other variables. Johnson et al. provided a comprehensive research on ICU data, its challenges and the solutions offered by machine learning methods(Johnson et al., 2016a, ). Other valuable researches on handling missing values in ICU data includes (Lipton et al.,, 2016; Sharafoddini et al.,, 2019) where missing indicators are investigated for phenotyping and mortality detection. They concluded that enriching the data with missing indicators lead to prediction improvement. Another direction of study tries to modify the LSTM or GRU units to internally consider indicators and their time intervals (Che et al.,, 2018).
5 Conclusion
In this study we have defined a clinical problem that has not been addressed previously, describing the necessity of lactate concentration prediction in critical care decision making. Performance comparison between a number of algorithms shows that LSTM-based method can predict lactate level with a Mean Absolute Error of 0.665 across 13,464 patients from different hospitals and ICU units. Furthermore, we show that indicator imputation method achieves highest performance in our dataset, suggesting that a missing value indicator is informational and increases predictive power over other, mean-based imputation methods. Our work is a promising first step towards applying machine learning techniques in predicting lactate concentration while there is apparent room for improvement. The presented results can serve as a basis for future work and further investigation of clinical decision making in critical care.
6 Future directions
We are investigating a number of future directions for this research, including: i) validation of our results using external datasets: eICU data is collected from multiple ICU centres across the United States that may result in lower systematic bias in comparison to a single centre dataset, such as MIMIC III; however the latter has a richer collection of pharmacological interventions which may further improve the prediction results, especially for patients with high lactate levels, where pharmacological interventions are more frequent; ii) lactate distribution by nature is highly imbalanced, yet addressing imbalance in a regression task is far less mature than in a classification task (Krawczyk,, 2016), where ensemble learning may play a role; iii) categorise lactate levels into four groups according to severity of hyperlactatemia (Table 2), effectively converting the task into a classification problem and addressing the previous challenge; iv) a promising avenue is to tailor state of the art deep learning methods (such as GRU-D) to capture informative missingness or learn compressed representations of multivariate time series using generative models; and v) model interpretability will play an important role in increasing trust as translating machine learning models effectively to clinical practice requires establishing clinicians’ trust.
References
- Azur et al., (2011) Azur, M. J., Stuart, E. A., Frangakis, C., and Leaf, P. J. (2011). Multiple imputation by chained equations: what is it and how does it work? International journal of methods in psychiatric research, 20(1):40–49.
- Batista et al., (2002) Batista, G. E., Monard, M. C., et al. (2002). A study of k-nearest neighbour as an imputation method. HIS, 87(251-260):48.
- Charte et al., (2018) Charte, D., Charte, F., García, S., del Jesus, M. J., and Herrera, F. (2018). A practical tutorial on autoencoders for nonlinear feature fusion: Taxonomy, models, software and guidelines. Information Fusion, 44:78–96.
- Che et al., (2018) Che, Z., Purushotham, S., Cho, K., Sontag, D., and Liu, Y. (2018). Recurrent neural networks for multivariate time series with missing values. Scientific reports, 8(1):6085.
- Cismondi et al., (2013) Cismondi, F., Fialho, A. S., Vieira, S. M., Reti, S. R., Sousa, J. M., and Finkelstein, S. N. (2013). Missing data in medical databases: Impute, delete or classify? Artificial intelligence in medicine, 58(1):63–72.
- Gondara and Wang, (2017) Gondara, L. and Wang, K. (2017). Multiple imputation using deep denoising autoencoders. arXiv preprint arXiv:1705.02737.
- Harutyunyan et al., (2017) Harutyunyan, H., Khachatrian, H., Kale, D. C., Steeg, G. V., and Galstyan, A. (2017). Multitask learning and benchmarking with clinical time series data. arXiv preprint arXiv:1703.07771.
- Hughes et al., (2019) Hughes, R. A., Heron, J., Sterne, J. A., and Tilling, K. (2019). Accounting for missing data in statistical analyses: multiple imputation is not always the answer. International journal of epidemiology, 1:11.
- Husain et al., (2003) Husain, F. A., Martin, M. J., Mullenix, P. S., Steele, S. R., and Elliott, D. C. (2003). Serum lactate and base deficit as predictors of mortality and morbidity. The American journal of surgery, 185(5):485–491.
- Jansen et al., (2010) Jansen, T. C., van Bommel, J., Schoonderbeek, F. J., Sleeswijk Visser, S. J., van der Klooster, J. M., Lima, A. P., Willemsen, S. P., and Bakker, J. (2010). Early lactate-guided therapy in intensive care unit patients: a multicenter, open-label, randomized controlled trial. American journal of respiratory and critical care medicine, 182(6):752–761.
- (11) Johnson, A. E., Ghassemi, M. M., Nemati, S., Niehaus, K. E., Clifton, D. A., and Clifford, G. D. (2016a). Machine learning and decision support in critical care. Proceedings of the IEEE. Institute of Electrical and Electronics Engineers, 104(2):444.
- Johnson et al., (2017) Johnson, A. E., Pollard, T. J., and Mark, R. G. (2017). Reproducibility in critical care: a mortality prediction case study. In Machine Learning for Healthcare Conference, pages 361–376.
- (13) Johnson, A. E., Pollard, T. J., Shen, L., Li-wei, H. L., Feng, M., Ghassemi, M., Moody, B., Szolovits, P., Celi, L. A., and Mark, R. G. (2016b). Mimic-iii, a freely accessible critical care database. Scientific data, 3:160035.
- Jones et al., (2010) Jones, A. E., Shapiro, N. I., Trzeciak, S., Arnold, R. C., Claremont, H. A., Kline, J. A., Investigators, E. M. S. R. N. E., et al. (2010). Lactate clearance vs central venous oxygen saturation as goals of early sepsis therapy: a randomized clinical trial. Jama, 303(8):739–746.
- Josse and Husson, (2012) Josse, J. and Husson, F. (2012). Handling missing values in exploratory multivariate data analysis methods. Journal de la Société Française de Statistique, 153(2):79–99.
- Kawaler et al., (2012) Kawaler, E., Cobian, A., Peissig, P., Cross, D., Yale, S., and Craven, M. (2012). Learning to predict post-hospitalization vte risk from ehr data. In AMIA annual symposium proceedings, volume 2012, page 436. American Medical Informatics Association.
- Koren et al., (2009) Koren, Y., Bell, R., and Volinsky, C. (2009). Matrix factorization techniques for recommender systems. Computer, (8):30–37.
- Krawczyk, (2016) Krawczyk, B. (2016). Learning from imbalanced data: open challenges and future directions. Progress in Artificial Intelligence, 5(4):221–232.
- Le et al., (2018) Le, T. D., Beuran, R., and Tan, Y. (2018). Comparison of the most influential missing data imputation algorithms for healthcare. In 2018 10th International Conference on Knowledge and Systems Engineering (KSE), pages 247–251. IEEE.
- Levy et al., (2018) Levy, M. M., Evans, L. E., and Rhodes, A. (2018). The surviving sepsis campaign bundle: 2018 update. Intensive care medicine, 44(6):925–928.
- Lipton et al., (2016) Lipton, Z. C., Kale, D., and Wetzel, R. (2016). Directly modeling missing data in sequences with rnns: Improved classification of clinical time series. In Machine Learning for Healthcare Conference, pages 253–270.
- Mazumder et al., (2010) Mazumder, R., Hastie, T., and Tibshirani, R. (2010). Spectral regularization algorithms for learning large incomplete matrices. Journal of machine learning research, 11(Aug):2287–2322.
- Nichol et al., (2010) Nichol, A. D., Egi, M., Pettila, V., Bellomo, R., French, C., Hart, G., Davies, A., Stachowski, E., Reade, M. C., Bailey, M., et al. (2010). Relative hyperlactatemia and hospital mortality in critically ill patients: a retrospective multi-centre study. Critical care, 14(1):R25.
- Pollard et al., (2018) Pollard, T. J., Johnson, A. E., Raffa, J. D., Celi, L. A., Mark, R. G., and Badawi, O. (2018). The eicu collaborative research database, a freely available multi-center database for critical care research. Scientific data, 5.
- Purushotham et al., (2017) Purushotham, S., Meng, C., Che, Z., and Liu, Y. (2017). Benchmark of deep learning models on large healthcare mimic datasets. arXiv preprint arXiv:1710.08531.
- Rhee et al., (2015) Rhee, C., Murphy, M. V., Li, L., Platt, R., and Klompas, M. (2015). Lactate testing in suspected sepsis: trends and predictors of failure to measure levels. Critical care medicine, 43(8):1669.
- Rubin, (1976) Rubin, D. B. (1976). Inference and missing data. Biometrika, 63(3):581–592.
- Schmitt et al., (2015) Schmitt, P., Mandel, J., and Guedj, M. (2015). A comparison of six methods for missing data imputation. Journal of Biometrics & Biostatistics, 6(1):1.
- Sharafoddini et al., (2019) Sharafoddini, A., Dubin, J. A., Maslove, D. M., and Lee, J. (2019). A new insight into missing data in intensive care unit patient profiles: Observational study. JMIR medical informatics, 7(1):e11605.
- Shickel et al., (2017) Shickel, B., Tighe, P. J., Bihorac, A., and Rashidi, P. (2017). Deep ehr: a survey of recent advances in deep learning techniques for electronic health record (ehr) analysis. IEEE journal of biomedical and health informatics, 22(5):1589–1604.
- Sim et al., (2015) Sim, J., Lee, J. S., and Kwon, O. (2015). Missing values and optimal selection of an imputation method and classification algorithm to improve the accuracy of ubiquitous computing applications. Mathematical Problems in Engineering, 2015.
- Stekhoven and Bühlmann, (2011) Stekhoven, D. J. and Bühlmann, P. (2011). Missforest—non-parametric missing value imputation for mixed-type data. Bioinformatics, 28(1):112–118.
- Stiglic et al., (2017) Stiglic, G., Kocbek, P., Fijacko, N., Sheikh, A., and Pajnkihar, M. (2017). Challenges associated with missing data in electronic health records: a case study of a risk prediction model for diabetes using data from slovenian primary care. Health informatics journal, page 1460458217733288.
- Tian et al., (2012) Tian, H., Han, S., Lv, C., Wang, T., Li, Z., Hao, D., Shang, Q., and Wang, X. (2012). The effect of early goal lactate clearance rate on the outcome of septic shock patients with severe pneumonia. Zhongguo wei zhong bing ji jiu yi xue= Chinese critical care medicine= Zhongguo weizhongbing jijiuyixue, 24(1):42–45.
- Vesin et al., (2013) Vesin, A., Azoulay, E., Ruckly, S., Vignoud, L., Rusinovà, K., Benoit, D., Soares, M., Azeivedo-Maia, P., Abroug, F., Benbenishty, J., et al. (2013). Reporting and handling missing values in clinical studies in intensive care units. Intensive care medicine, 39(8):1396–1404.
- Wiens et al., (2019) Wiens, J., Saria, S., Sendak, M., Ghassemi, M., Liu, V. X., Doshi-Velez, F., Jung, K., Heller, K., Kale, D., Saeed, M., et al. (2019). Do no harm: a roadmap for responsible machine learning for health care. Nature medicine, pages 1–4.
- Zheng et al., (2017) Zheng, T., Xie, W., Xu, L., He, X., Zhang, Y., You, M., Yang, G., and Chen, Y. (2017). A machine learning-based framework to identify type 2 diabetes through electronic health records. International journal of medical informatics, 97:120–127.
Appendix A Appendix
| Methods | Description |
|---|---|
| Mean and Median | Impute missing values with overall mean or median of observed data for each variable. |
| Group mean | Group data based on other observed variables and replace the missing values with the mean of the corresponding group. |
| Feed Forward | Propagate measurements forward (or backward) in time to fill missing data using the nearest valid value. |
| Indicator & Mean | Impute with mean of observed data while keeping a binary indicator column for each variable representing if the value is imputed or not. |
| PCA | Fill in missing values using probabilistic principal components analysis (PCA). |
| MF | (Matrix Factorization) Use direct factorization of the incomplete matrix into two low-rank matrices. |
| SoftImpute | Iterative method for matrix completion with iterative soft-thresholded Singular Value Decomposition (SVD) to impute the missing values. |
| KNN | Impute missing values based on the K most similar observed neighbours of missing data. |
| MissForest | Iteratively use Random Forest to create multiple imputations of each variable. |
| MICE | (Multiple Imputation by Chained Equations) Use sequential regression to create several imputations for each feature. |
| AE | (Autoencoder) Reconstruct input data by learning a function using neural network. |