Positive Ion Chemistry in an N2-CH4 Plasma Discharge: Key Precursors to the Growth of Titan Tholins
Abstract
Titan is unique in the solar system as it hosts a dense atmosphere mainly made of molecular nitrogen N2 and methane CH4. The Cassini-Huygens Mission revealed the presence of an intense atmospheric photochemistry initiated by the photo-dissociation and ionization of N2 and CH4. In the upper atmosphere, Cassini detected signatures compatible with the presence of heavily charged molecules which are precursors for the solid core of the aerosols. These observations have indicated that ion chemistry has an important role for organic growth. However, the processes coupling ion chemistry and aerosol formation and growth are still mostly unknown. In this study, we investigated the cation chemistry responsible for an efficient organic growth that we observe in Titan’s upper atmosphere, simulated using the PAMPRE plasma reactor. Positive ion precursors were measured by in situ ion mass spectrometry in a cold plasma and compared with INMS observations taken during the T40 flyby. A series of positive ion measurements were performed in three \ceCH4 mixing ratios (1%, 5% and 10%) showing a variability in ion population. Low methane concentrations result in an abundance of amine cations such as \ceNH4+ whereas aliphatic compounds dominate at higher methane concentrations. In conditions of favored tholin production, the presence of C2 compounds such as \ceHCNH+ and \ceC2H5+ is found to be consistent with copolymeric growth structures seen in tholin material. The observed abundance of these two ions particularly in conditions with lower \ceCH4 amounts is consistent with modeling work simulating aerosol growth in Titan’s ionosphere, which includes mass exchange primarily between \ceHCNH+ and \ceC2H5+ and negatively charged particles. These results also confirm the prevalent role of C2 cations as precursors to molecular growth and subsequent mass transfer to the charged aerosol particles as the \ceCH4 abundance decreases towards lower altitudes.
keywords:
Titan , Atmospheres, chemistry , Experimental techniques1 Introduction
Titan is Saturn’s largest satellite. It hosts a dense atmosphere mainly made up of molecular nitrogen N2 and methane CH4, with a surface pressure of 1.5 bar. Early seminal studies (Khare and Sagan, 1973; Sagan, 1973; Hanel et al., 1981) showed how Titan’s reducing atmosphere is also composed of complex and heavy organic molecules and aerosols. This chemistry is initiated at high altitudes and participates in the formation of solid organic particles (Waite et al., 2007; Hörst, 2017). At these altitudes, the atmosphere is under the influence of energy deposition such as solar ultraviolet (UV) radiation, solar X-rays, galactic cosmic rays, Saturn’s magnetospheric energetic electrons and solar wind (Krasnopolsky, 2009, 2014; Lavvas et al., 2011; Sittler et al., 2009).
In Titan’s upper atmosphere, Cassini’s Ion and Neutral Mass Spectrometer (INMS)
detected neutral and positive ion signatures (Waite et al., 2007). Subsequently, the
Cassini Plasma Spectrometer electron spectrometer (CAPS-ELS) unveiled the existence
of negative ion-molecules well over the detection range of INMS ( 100 u)
consistent with the presence of heavy molecules (over 10,000 u in mass) which
are presumably precursors for the solid core of the aerosols (Coates et al., 2007; Desai et al., 2017; Dubois et al., 2019a). Furthermore, Lavvas et al. (2013) modeled the photochemistry and microphysics in the ionosphere, characterizing the interaction between the aerosols and charged particles. They showed the dusty nature of the ionosphere (where the charged aerosol population dominates the overall gas phase/aerosol particles charge balance), and found that the aerosol growth in the ionosphere, notably below 1,000 km, occurs as negatively charged particles collide with background positive ions. This in turn, leads to a rapid and important growth in mass (e.g. 500 u at 1,000 km). Ion-molecule reactions are thought to produce most of the positive ions present in Titan’s ionosphere, and are thus controlled by the two initial neutral main constituents, \ceN2 and \ceCH4. The direct ionization of \ceN2 and \ceCH4 and formation of the \ceN+ and \ceN+2 primary ions make \ceCH+3 readily available which is predicted to participate in the production of the first light hydrocarbons such as \ceC2H5+, one of the major ions produced (Reaction 1). The ionization rate peaks at the ionospheric peak, at about 1,150 km. Ip (1990) determined, using the Chapman layer theory, the electron density
peak to be at an altitude of 1,200 km, while Keller et al. (1992) found it at an altitude of 1,175 km. Later, Fox and Yelle (1997) predicted it to be at 1,040 km with a solar zenith angle of 60º. They also predicted that \ceHCNH+ would be the major ion,
which included a model with over 60 species and 600 reactions. Keller et al. (1998), with an improved model, estimated the major m/z 28 peak to consist
of HCNH+ at 75%. Some other major ion species include \ceCH+5, \ceC3H+3 and \ceC3H+5. Based on Yung et al. (1984) and Toublanc et al. (1995), Keller et al. (1998) predicted higher masses than previous models, to be detected by Cassini, of up to C6 species in the ionospheric peak region.
| (1) |
Since the Cassini era, extended models based on Keller et al. (1998) have been used to predict ion densities and mass distributions, and construct a more cohesive view of neutral-ion interactions in Titan’s ionosphere. Photochemical models (e.g. Vuitton et al., 2007; Carrasco et al., 2008b; Vuitton et al., 2008) have
provided insight on the chemical species involved in ion-molecule, proton transfer
or ionization reactions to produce positive ions. In recent years, e.g. Ågren et al. (2009); Shebanits et al. (2013, 2017); Vigren et al. (2014, 2015) have explored electron number
densities with Solar Zenith Angle (SZA) dependencies and dayside/nightside ion
charge densities with EUV flux correlations. This has shown how
the positive ion and dust grain charge densities are diurnally sensitive
to EUV fluctuations and thus impact ion density distributions.
Furthermore, the gas-to-solid conversion at these high altitudes coexists in a fully
coupled ionic and neutral chemistry (e.g. Lavvas et al., 2013; Vuitton et al., 2019). However, the processes coupling ion and neutral
chemistry and aerosol production are still mostly unknown at the moment. Using laboratory simulations with different gas mixtures, it is possible to influence the chemistry and thus constrain species. In this way, laboratory results
can for example, provide potential new species, rule out some, or probe
masses with a higher resolution that were out of reach of the Cassini instruments,
while improving understanding of chemical pathways. Detecting these ions (positive or negative) in
Titan-like conditions in the laboratory remains challenging. Sciamma-O’Brien et al. (2014) used Time-of-Flight mass spectrometry to study neutrals and positive ions produced in a pulsed plasma
jet expansion at low temperatures ( 150 K). In such an apparatus, the ions are not fragmented by any kind of internal ionization. In that study, the authors focused on the first chemical stages before tholin (Titan aerosol analogs produced in the laboratory) production, by studying simple binary gas mixtures to more complex ones with light hydrocarbons and benzene. With comparisons to CAPS-IBS data, they suggested for example that some
of the ions of larger masses (m/z 100) could correspond to aromatic compounds.
In the present study, we have used PAMPRE for the first time to study cations directly inside our radiofrequency capacitively coupled (RF-CC) plasma discharge with an ion mass spectrometer. We have used different \ceN2:\ceCH4 initial gas mixtures ranging from 1% to 10% \ceCH4 to address the complexity of the precursor gas phase chemistry which controls the complexity of tholins and pathway trends towards their formation. Finally, we have compared our experimental results with INMS measurements obtained during the T40 flyby.
2 Materials and methods
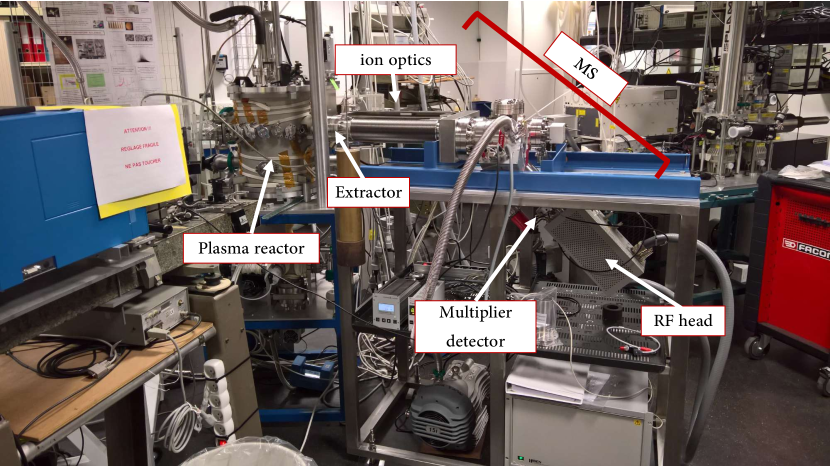
We used the cold plasma reactor PAMPRE (Szopa et al. (2006) and Figure 1) to reach analogous conditions to Titan’s ionosphere using various initial \ceCH4 conditions. This plasma reactor has previously been used to characterize the gas and solid phase particles produced in the discharge (e.g. Carrasco et al., 2012; Gautier et al., 2012; Dubois et al., 2019a, b). A newly acquired ion mass spectrometer was fitted to the existing chamber, in order to detect the ions directly within the plasma in situ. Different experimental conditions were tested and are detailed hereafter. The plasma chamber and mass spectrometry techniques are presented in the following sections, respectively.
2.1 The PAMPRE cold plasma experiment
The PAMPRE plasma reactor delivers electrons with an energy distribution function comparable to that of the solar spectrum (Szopa et al., 2006). The plasma discharge is delivered through a radiofrequency (13.56 MHz) generator. \ceN2:\ceCH4 gas influx is monitored with mass flow controllers at 55 sccm (standard cubic centimeters per minute) in standard conditions, tuned from \ceCH4 mixing ratios from 1% to 10%. This corresponds to a working pressure of 0.9 mbar. High purity ( 99.999%) cylinders of \ceN2 and \ceN2:\ceCH4 were used. Plasma power was kept constant throughout the experiment at 30 W.
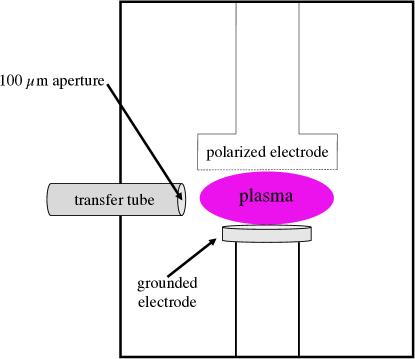
The plasma operates between a polarized electrode (anode) and a grounded electrode (Szopa et al., 2006). The showerhead-shaped anode of PAMPRE can be configured in two different ways: with cage or cage-free. Previous studies using this reactor have analyzed the plasma parameters with a fitted cage (e.g. Wattieaux et al., 2015) ensuring a controlled geometry of the discharge, but preventing ion collection. Without this cage, an expanded plasma operates between the polarized electrode and a grounded plate at the bottom of the reactor, 10 cm from each other (Figure 2).
2.2 Positive ion mass spectrometry
A new Hiden Analytical EQP 200 quadrupole mass spectrometer (Figure 3), coupled with a Pfeiffer turbo pump, has been fitted to PAMPRE. Its mass range goes up to 200 u. The turbo pump enables us to reach secondary vacuum of 10-9 mbar inside the MS chamber, and mbar during ion extraction. Different extraction apertures can be fitted to the extractor, depending on the pressure in the reactor. The extractor, where a negative potential is applied, directly extracts ions from the plasma. A gate valve was placed between the chamber and the spectrometer to enable the 10-9 mbar vacuum inside the spectrometer and reduce the \ceCO2 and \ceH2O contaminations as much as possible. However, an accumulation of tholins within the instrument is possible over time. To mitigate accumulation of tholins, which will contaminate the experiment, we both isolate the extractor and perform an ultrasound bath and/or an \ceO2 plasma before and after each experiment.

A 0.1 u mass increment is used throughout the entire mass range for all experiments. The ion extractor, in contact with the plasma, delivers ions from the plasma to the mass spectrometer for analysis (Figure 2). This proved to be efficient enough to have a high count detection ( 106 c/s), while staying outside of the inter-electrode space. The spectrometer unit converts signal into a number of counts-per-second, over an integration period called hereafter dwell time. The dwell time is user-defined, and set to 100 ms. Once enough signal has been accumulated, the measurement starts. With a 0.1 u mass step and a dwelling time of 100 ms over a 100 u range, a scan typically takes s/scan. Any signal 10 c/s corresponds to instrumental and electrical background noise. Limiting air and water contamination in the plasma and spectrometer chambers is essential in avoiding over-interpreting spectra (e.g. masses 18 and 32). A motorized Z-drive is mounted to the ion extractor, giving a 300 mm stroke in order to approach the plasma closely ( 2cm) and measure the ion composition. This Z-drive system consists of a coil-shaped structure enclosing the transfer tube and is prone to water condensation in the gap of each spiral. Water contamination can be evaluated from the contribution of its main ion in the discharge, which is \ceH3O+ at m/z 19. As seen on Figure 5, the peak at m/z 19 is two orders of magnitude lower than the main ions in the C1 block, confirming a weak water contamination in our experiment. Indeed before each experiment, we ensured an efficient degassing of water in the plasma reactor by a first bake-out of the transfer tube enclosure and reactor at 110∘C, followed by a pure \ceN2 discharge removing residual adsorbed molecules on the walls. Once the extractor has been inserted into the plasma, a scan is completed, satisfying both mass range detection and ion count intensity. The intensity limit for this instrument is c/s. For further experimental details, the reader is referred to the Supplementary Material.
3 Results
We present here the positive ion mass spectra obtained in conditions ranging from [CH4]0 = 1 to [CH4]0 = 10 covering Titan methane conditions and staying consistent with previous studies (Sciamma-O’Brien et al., 2010; Dubois et al., 2019b). Firstly, three [CH4]0 conditions are presented, showing the diversity in ion population. We used 1%, 5% and 10% methane mixing ratios. Then, we show the disparity in ion distributions and compare our results with INMS measurements taken during the Cassini T40 flyby.
3.1 Ion diversity
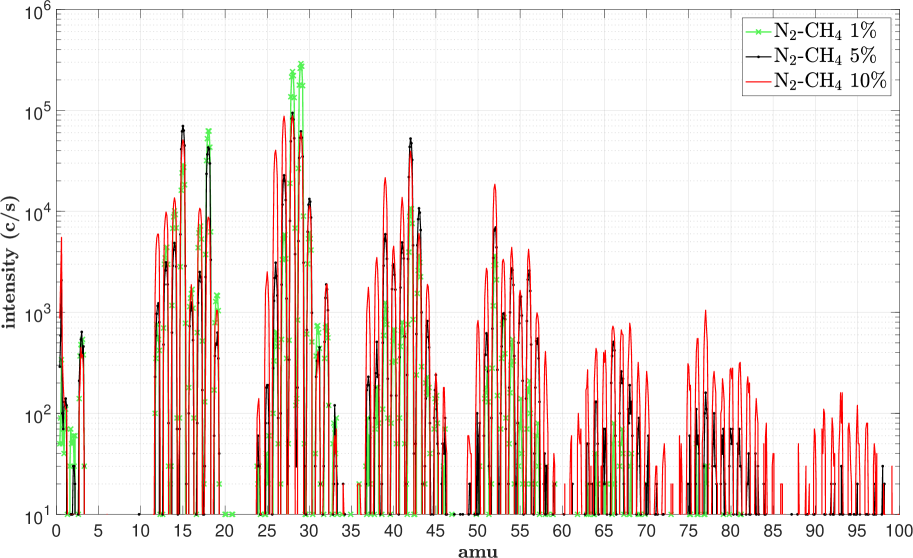
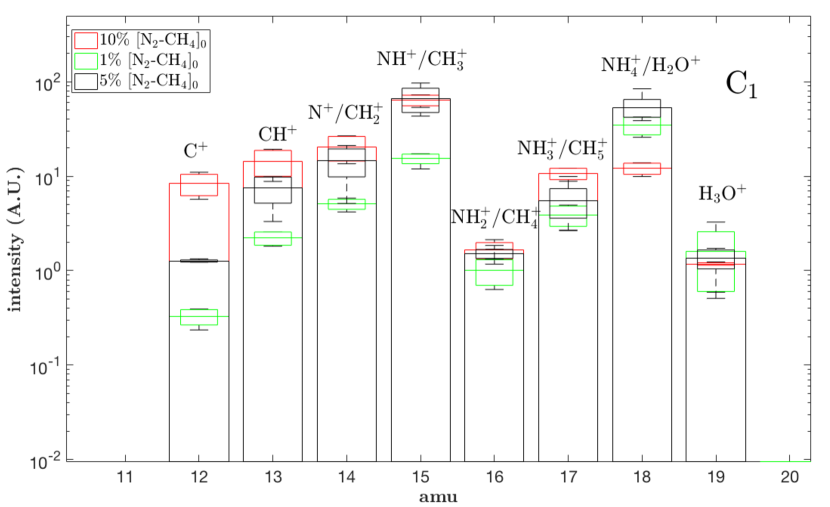
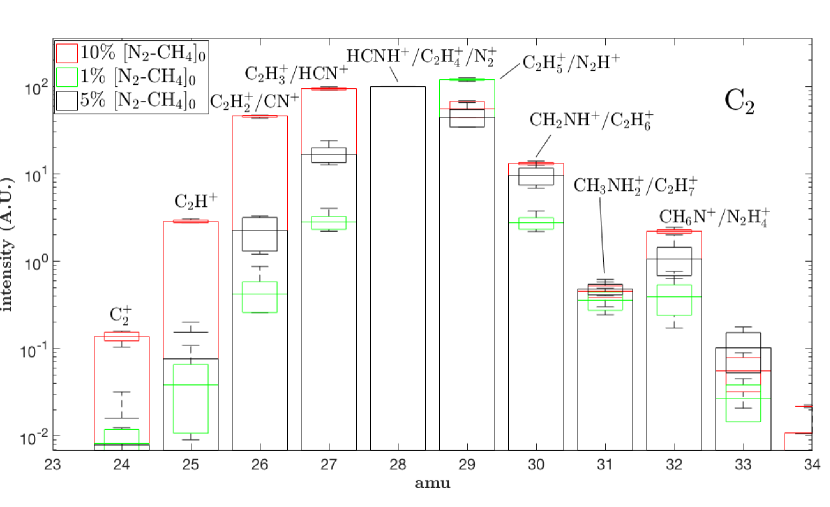
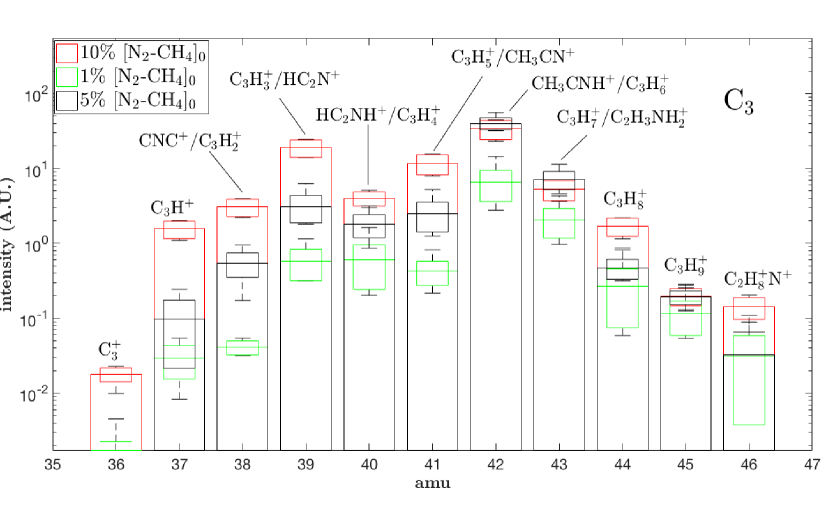
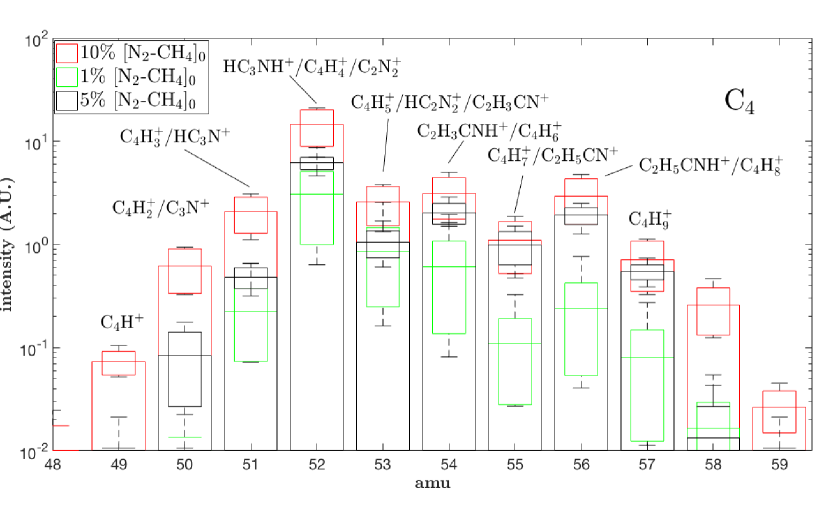
As explained in the Supplementary Material, all spectra are normalized to m/z 28 and units are expressed in arbitrary units (A.U.). Figure 4 shows a large variability (e.g. C8 blocks) in the spectra. Here, we tentatively assign positively charged species to the measured peaks. These assignations are listed in Table 1. We focus on the first four groups (m/z ) as it becomes speculative to attribute higher masses beyond this limit (influence of polymers, aromatics…). These group comparisons for three different initial methane mixing ratios are shown in the box plots Figures 5 through 8. Plotted values correspond to averaged normalized values taken from four data sets in each initial methane concentration. Lower and upper limits of the boxes represent the 1st and 3rd quartiles, respectively, of the minima and maxima experimental values (black whiskers), indicating the variability in intensity displayed in all four spectra. The spectra in green, black and red correspond to measurements carried out with 1%, 5% and 10% \ceCH4, respectively.
| Group | m/z | Species |
|---|---|---|
| C1 | 14 | N+/CH |
| 15 | CH/NH+ | |
| 16 | CH/NH | |
| 17 | CH/NH | |
| 18 | NH/H2O+ | |
| 19 | H3O+ | |
| C2 | 26 | C2H/CN+ |
| 27 | C2H/HCN+ | |
| 28 | HCNH+/N/C2H | |
| 29 | C2H/N2H+/CH2NH+ | |
| 30 | CH2NH/C2H | |
| C3 | 38 | CNC+/C3H |
| 39 | C3H/HC2N+ | |
| 40 | HC2NH+/C3H | |
| 41 | CH3CN+/C3H | |
| 42 | CH3CNH+/N/C3H | |
| 43 | C3H/C2H3NH | |
| 44 | C3H/CO | |
| 45 | C3H | |
| C4 | 51 | HC3N+/C4H |
| 52 | HC3NH+/C2N/C4H | |
| 53 | C4H/HC2N/C2H3CN+ and m/z 52 isotopes | |
| 54 | C2H3CNH+/C4H | |
| 55 | C4H/C2H5CN+ | |
| 56 | C4H/C2H5CNH+ | |
| 57 | C4H |
-
1.
- In Figure 5, the major ion detected at 5% and 10% CH4 is at m/z 15, which can be attributed to the \ceNH+ radical or the methyl CH cation. Other CH4 fragments, consistent with a \ceCH4 fragmentation pattern are also visible in all conditions at m/z 14 and 13, corresponding to CH and CH+. The N+ fragment also contributes to m/z 14. CH and NH may contribute to m/z 17. There is a strong discrepancy between the 1% and 10% conditions, in particular regarding the m/z 15 and m/z 18 peak inversions. In a [NCH4] mixing ratio, m/z 15 dominates the rest of the grouping, presumably due to the methane influence along with \ceCH+, \ceCH2+ and \ceCH3+. Carrasco et al. (2012) discussed the influence between the methyl ion and the favored production of ammonia with increasing methane. Mutsukura (2001), also using a CH4/N2 RF plasma albeit with much higher methane concentrations (50%), found that the m/z 15 and m/z 18 ions were dominant in methane-rich conditions. This is confirmed by our results (Figure 5), showing the importance of CH in methane-rich mixtures. However, in a nitrogen-rich plasma with a mixing ratio of [NCH4], m/z 18 NH becomes the most abundant ion. At 5% \ceCH4, m/z 18 is also important along with m/z 15. Water contamination cannot be ruled out and is included in Table 1.
-
1.
- Figure 6 shows the C2 species detected in the three conditions. This group is overall more intense than the group. The most abundant ions are at m/z 28 and 29 with intensities of a.u. There is a strong increase in masses on the left tail of the red distribution, i.e. with 10% \ceCH4 (m/z 24–27), as compared to the other two spectra. These species consistently increase well apart from the repeatability error bars with increasing methane. Presumably, these simple aliphatics such as C2H and C2H (m/z 26 and 27, respectively) increase by an order of magnitude from the black to red curve. m/z 29 is not as unambiguous, and \ceN2H+ shares the same peak as C2H. This peak is the most intense at 1% \ceCH4. As such, where m/z 28 dominates with a 10% \ceCH4 mixing ratio, the m/z 29 peak inversion occurs with decreasing CH4. Therefore, N-bearing species such as N2H+/\ceCH2NH+ are good candidates at this mass. Due to the limiting amount of \ceCH4 in the green spectrum, the ion at m/z 29 in this condition is likely to be \ceN2H+. However, with higher methane amounts, \ceC2H5+ formation prevails and becomes the dominant ion at m/z 29, as predicted by Vuitton et al. (2007). \ceC2H5+ formation partly depends on the presence of \ceC2H4, indicating its presence in the plasma, as suspected in Dubois et al. (2019b). \ceCH2NH2+/C2H6+ at m/z 30 increases with higher methane concentrations. It can thus most likely be attributed to \ceC2H6+.
-
1.
- This cluster is dominated by m/z 42 (Figure 7), whose overall intensity seems to be favored with increasing methane. The black and red curves reach intensities similar to the group (almost ). Except in the 10% CH4 condition, the second most abundant volatile is at m/z 43, which can be attributed to the protonated form of propene, C3H, or ethylenimine \ceC2H3NH2+. With 10% CH4, the intensity of the m/z 39 peak, attributed to C3H or \ceHC2N+, increases by almost two orders of magnitude. The production of this ion seems to be favored with a richer methane mixing ratio. Similar to the sharp increase seen in Figure 6 (red bars) in signal on the left-half of the C2 block, an important contribution of species present between m/z 36 and m/z 39 accompanies higher methane concentrations. This is consistent with proton addition reaction from hydrocarbon compounds.
-
1.
- This block is dominated by the ion at m/z 52, which can correspond to HC3NH+, \ceC4H4+ or \ceC2H3CN+ (Figure 8). We observe an overall increase in intensity of these species with increasing methane. Similar to the C3 case, this increase is especially relevant for the species between m/z 49 and 52 in the 10% \ceCH4 condition. In addition, the increase in intensity at m/z 52 with 10% \ceCH4 suggests that \ceC4H4+ contributes significantly at this mass. Ions produced in the plasma with a 1% \ceCH4 mixing ratio remain overall less intense than in the other two \ceCH4 conditions. To better characterize this observation among the different blocks, we represent these general trends as pie charts (Figure 9) as a function of initial methane concentration.
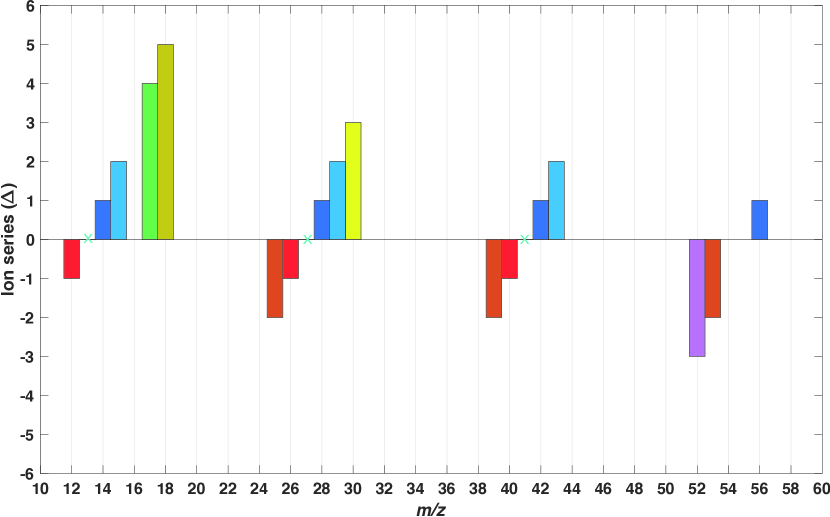
Each pie chart is color coded (horizontally and vertically) and is normalized over the sum of the mean values of all of the other masses (noted misc. in gray color). This representation helps to draw the relative weights of each Cx group and better visualize their relative contributions. Vertical color coding is represented according to the delta values of each m/z using the ion series analysis technique (McLafferty and Turecek, 1993; Canagaratna et al., 2007). Each m/z is assigned a value, where and is the grouping number. Thus, corresponds to linear saturated hydrocarbons (light blue), corresponds to heteroatomic compounds (yellow, green and brown) and corresponds to unsaturated and branched hydrocarbons (dark blue, aquamarine, red, orange and purple). Therefore, the value informs on the probable functional groups for each mass (the reader is referred to Figure 5 of the Supplementary Material for further information on the delta value determination).
The C1 species are dominated by the peak at m/z 18, which represents 11% normalized over the entire spectrum in the 1% \ceCH4 condition, 13% at 5% \ceCH4 and decreases to 2% with 10% \ceCH4. As we can see in the last condition, ions at m/z 15 accounts for the same contribution as m/z 18 does at 1% \ceCH4. In the intermediate methane condition, both ions at m/z 15 and m/z 18 can be considered major ions. The C2 compounds in a 1% \ceCH4 mixing ratio are significant, and represent almost 75% in intensity of the entire spectrum. This group is mainly represented by the ions at m/z 28 and m/z 29. This C2 influence decreases slightly at 5% \ceCH4 while still contributing to 44% of all species detected. We observe that with increasing initial methane, the C2 distribution gets wider and more populated, with eventually a more intense signature of peaks at m/z 26, m/z 29 and m/z 30, at 8%, 10% and 2%, respectively. This pattern is also seen in the C3 pie charts, and to a lesser extent, the C4 group. The C3 compounds are dominated by ions at m/z 42 in all three conditions. It is significant in particular at 5% \ceCH4 ( 10% normalized), a favorable condition for efficient tholin formation. As seen in Table 1, the peak at m/z 42 can either be attributed to protonated acetonitrile \ceCH3CNH+ or the cyclopropane positive ion \ceC3H6+.
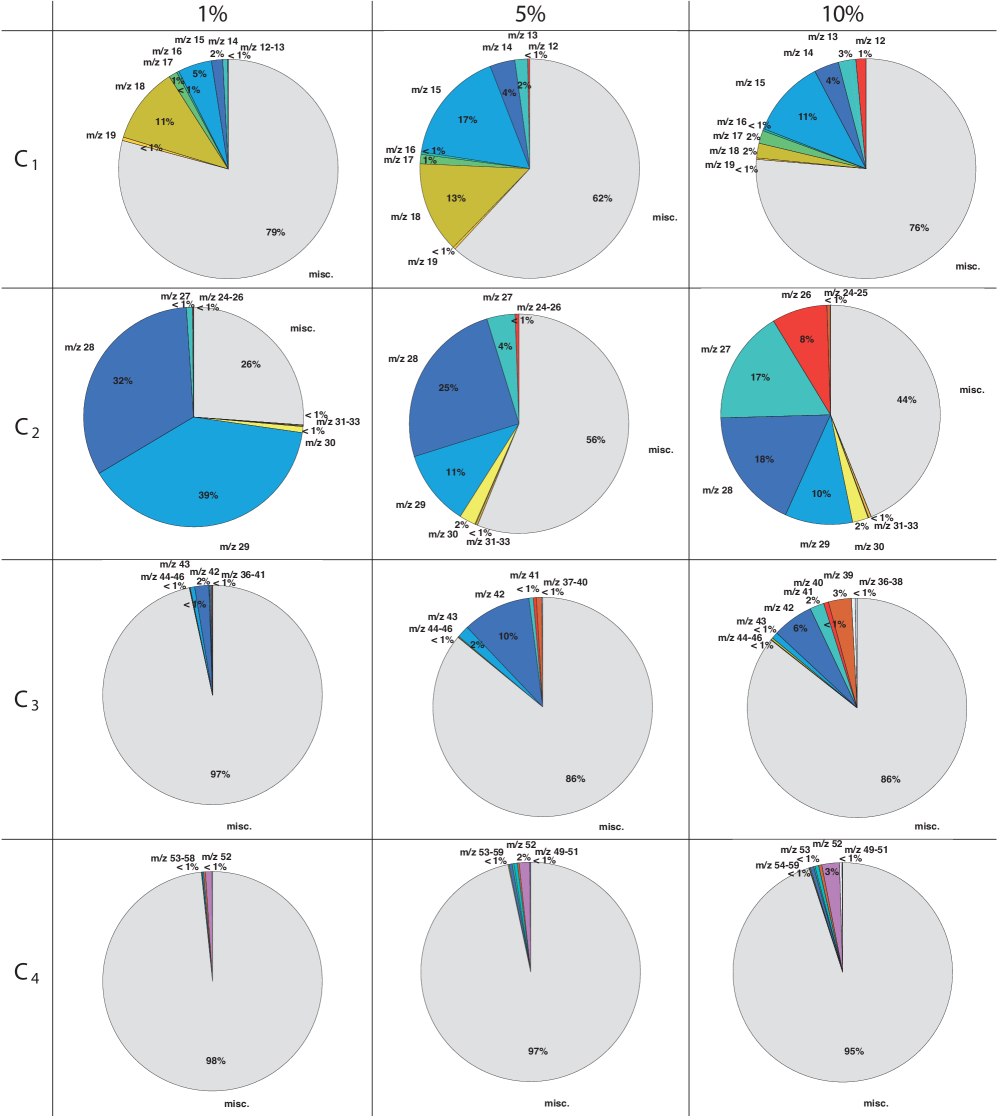
It is noteworthy to point out the 5% initial methane concentration charts (middle column, Figure 9). At this concentration, tholins are efficiently produced in our chamber. The presence of the C1 (at m/z 15 and 18) and C2 (at m/z 28 and 29) ions in this condition (\ceCH3+/\ceNH4+ and \ceHCNH+/\ceC2H5+, respectively) is significant. This comes in agreement with the copolymeric HCN/\ceC2H4 and poly-(\ceCH2)m(HCN)n-based structure found in the solid tholin material (Pernot et al., 2010; Gautier et al., 2014; Maillard et al., 2018). As the tholins are negatively charged, they may react with these major ions to nucleate and polymerize. These results could suggest that \ceHCNH+ and \ceC2H5+ are important contributors to the polymeric growth of tholins.
3.2 Comparison between neutral and cation species
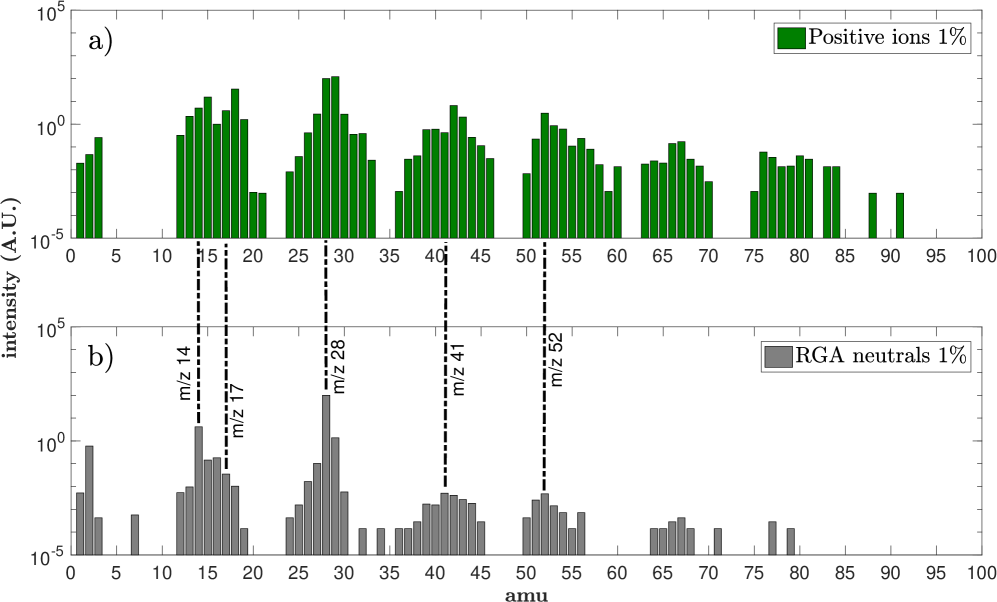
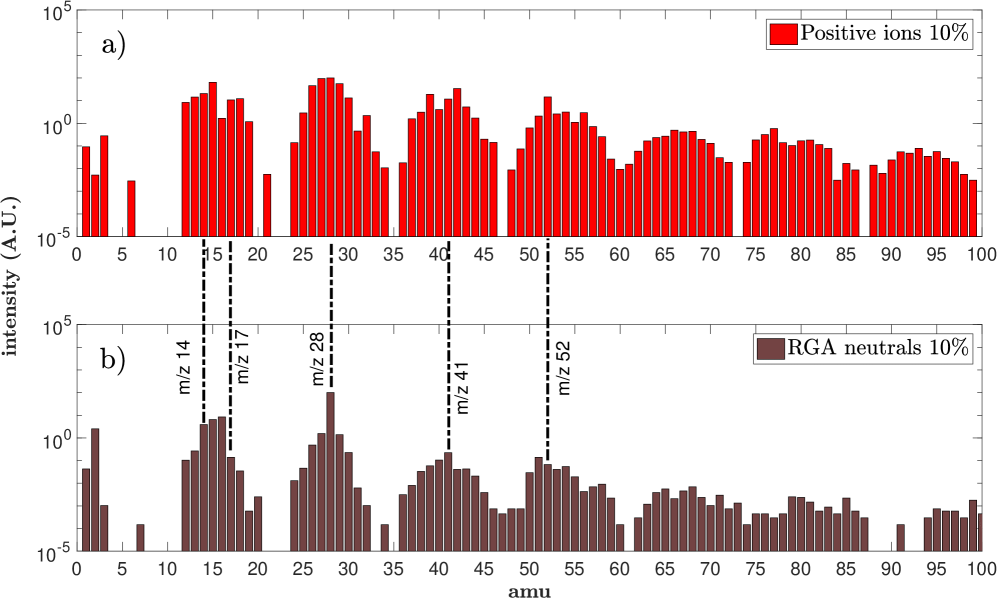
In order to see the interactions between the neutral and positive ion species, we show in Figures 10 and 11 comparisons between the averaged normalized spectra in positive ion and residual gas analyzer (RGA) neutral modes at 1% and 10% \ceCH4, respectively. The neutral mode setting used a 70 V electron energy using a filament emission of 5 A. Dubois et al. (2019b) had previously studied neutral volatile products released after being cryotrapped in the chamber, combining mass spectrometry and IR analysis for identification of major neutral products.
-
1.
The ions at m/z 28 and 29 in Figure 10 (a), dominate the spectrum as seen previously in Figure 9. In the neutral spectrum (gray bar graph), m/z 28 corresponds to contributions from \ceN2 and \ceC2H4. In the cryogenic study (Dubois et al., 2019b), m/z 28 was attributed to \ceC2H4, while the major m/z 17 peak was assigned to \ceNH3. In the middle plot, the ions at m/z 14, corresponding to the nitrogen atom or methylene \ceCH2, is the main C1 fragment. In positive ion mode however, the C1 group is much more populated, as are all of the other groups. In addition, the ions at m/z 15 and m/z 18 become the two major ions, coupled with a relatively richer spectrum on the right hand side of the group compared with the RGA spectrum. This 1 u shift is consistent with reactions involving \ceH+ addition (see Discussion Section). This pattern is also seen in the C2 and C3 groups with m/z 28 to 29 and m/z 41 to 42 shifts. The C4 shows no inversions in the m/z 52 peak. This molecule could be 1-buten-3-yne \ceC4H4 or cyanogen \ceC2N2, which were both identified in Gautier et al. (2011). Their cation counterparts \ceC4H4+ and \ceC2N2+, along with propiolonitrile \ceHC3NH+ could explain the intense m/z 52 signature at a.u.
-
2.
As seen at the beginning of this section and in Figure 9, the 10% \ceCH4 is marked by broader blocks, notably for the first three. The ions at m/z 12 to 16 of methane fragments in the (b) plot of Figure 11 are visible along with the corresponding methylene and methyl cations (red plot). C2 species are dominated by the peak at m/z 28 surrounded by m/z 26, 27 and 29. In our cryogenic study (Dubois et al., 2019b), the peak at m/z 28 was attributed to \ceC2H4. \ceN2 was absent from the chamber and so was ruled out. In the middle plot (b), \ceN2 was also present in the plasma and can also contribute to this peak. Furthermore, the cryogenic analysis in Dubois et al. (2019b) showed a higher HCN production at 10% than at 1% \ceCH4, indicating that HCN must significantly contribute to the C2 group with 10% CH4. There is a mass shift between the most intense peaks of the C3 group, i.e. from m/z 41 to 42 (in the brown and red plots, respectively), similar to that at 1% \ceCH4 (gray and green spectra, respectively), and again from m/z 51 in the neutral spectrum to m/z 52 only seen at 10% \ceCH4. However, unlike in the 1% \ceCH4 condition, the increase in intensity of the peak at m/z 42 is accompanied by the increase in intensity of the m/z 39 peak, which represent 6% and 3% in relative intensity to the rest of the spectrum, respectively (Figure 9). To a lesser extent, this is also visible with the increase in intensity at m/z 39 relative to m/z 41 from the neutral (Figure 10b) to the ion spectra (Figure 10a) at 1% \ceCH4.
This comparison between spectra taken in neutral and positive ion mode shows discrepancies and mass shifts between both datasets. Notably, mass shifts and sometimes peak inversions are visible in the first four Cx groups, which could be due to an enrichment of hydrogenated ion species, indicative of different chemistry. To go further in this inter-comparison and better understand specific chemical processes, future work will focus on modeling the neutral/cation interaction in the plasma.
4 Discussion
4.1 Chemical pathways contributing to the major precursors
The abundant reservoir of neutral species in Titan’s upper atmosphere is an important source for ion-molecule reactions. Ion chemistry is initialized by dissociative and ionizing processes of major neutral compounds forming \ceN2+ and \ceN+, and \ceCH4+, \ceCH3+, \ceCH2+ and \ceCH+ (see Introduction). These simple and primary cations are essential for further ion-neutral reactions (Reaction 1).
Thanks to photochemical models (see Introduction and references therein), many of the positive ions have been shown to be products resulting from proton exchange reactions between neutrals and ions. In this section, we will discuss potential pathways to explain some of our main ions detected in our three methane mixing ratios. These pathways are detailed in order to constrain our understanding of the cation gas phase reactivity in our plasma.
The ion variability observed in our PAMPRE reactor has shown to be highly methane-dependent. Few peak inversions exist (e.g. m/z 15 and 18). However, the decreasing slope after C2 is much higher at 1% \ceCH4 than at 10%, and higher amounts of \ceCH4 lead to larger wings with respect to the INMS spectra. As the neutral and ion chemistry are tightly coupled, comparing these two sets of data can shed light on protonation-driven chemical pathways, if any. We will first focus on the very light ions of the C1 group. The two major C1 ions are represented by m/z 15 and m/z 18 (Figure 5), respectively. The production of \ceCH3+ at m/z 15 comes from the direct ionization of methane or by charge transfer with \ceN2+ with a branching ratio (br) of 0.89 (Reaction 2), as proposed by Carrasco et al. (2008a). \ceCH3+ can react with other neutrals (Reaction 3), and thus decreases with higher methane mixing ratios.
| (2) |
| (3) |
| (4) |
| (5) |
In our chamber, \ceCH3+ might form according to Reaction 2, the same way the ammonium ion \ceNH4+ can form via Reactions 4 or 5 by proton attachment (Vuitton et al., 2007; Carrasco et al., 2008a). Initially, Keller et al. (1998) predicted the peak at m/z 18 to be dominated by \ceH2O+. After the early T5 Titan flyby, Cravens et al. (2006) and Vuitton et al. (2006) first suggested \ceNH4+ to be a good candidate for the detected peak at m/z 18, which was confirmed by Vuitton et al. (2007) and Carrasco et al. (2008a).
Note that in our experiment, a small \ceH2O+ contribution from residual air in the chamber cannot be ruled out, given the m/z 19 peak detection at (Figure 5 and Figure 9).
At 1% and 5% \ceCH4, \ceNH4+ is a major precursor, representing 11% and 13% in intensity (Figure 9), respectively. Reactions 4 and 5 require an ammonia reservoir. Pathways for \ceNH3 production in our chamber were detailed in Carrasco et al. (2012). The formation of ammonia (Reaction 6) relies on an \ceNH radical reservoir, which can come from (i) radical chemistry through \ceN + H -¿ NH, or (ii) ion-neutral chemistry with Reaction 7, and its subsequent recombination, Reaction 8. Note however that in the reaction volume (i.e. the plasma volume), wall effects can act as a catalyzer to adsorbed N and H, and contribute to Reaction 6, as described in Touvelle et al. (1987); Carrasco et al. (2012).
| (6) |
| (7) |
| (8) |
When increasing the methane concentration, ammonia production also increases, thanks to the available NH radicals. However, primary aliphatics also become more abundant. So, at 10% \ceCH4, \ceNH4+ no longer becomes significant, representing only 2% in intensity (Figure 9). The \ceNH4+ contribution at 5% \ceCH4 is still important (13%), notwithstanding the peak at m/z 15 already dominating the C1 group. At least at 1% and 5% \ceCH4, the ammonium ion \ceNH4+ is a major gas phase precursor, and its formation couples ion and neutral chemistry. This ion seems to be a relevant primary precursor for the formation of tholins with a 5% \ceCH4 mixing ratio (Sciamma-O’Brien et al., 2010). Further studies should explore intermediate conditions between 1% and 5% and examine the evolution of \ceNH4+
As seen in the previous section, the C2 group prevails in all spectra.
Comparing the neutral and ion mass spectra (Figures 10 and 11) gives us a clear evolution of the peaks. In the neutral spectrum at 1% \ceCH4, the ratio between signal intensities at m/z 28 and at m/z 29 was 2 orders of magnitude. In positive ion mode, m/z28/29 82% (Figure 9). Mass 28 can be attributed to \ceHCNH+, \ceC2H4+ or \ceN2+. Carrasco et al. (2012) showed that an increase in the peak at m/z 28 for neutral species with increasing \ceCH4 initial concentration was not necessarily due to \ceN2, but mainly \ceC2H4. The formation of \ceC2H4+ depends on methane, and occurs through the rearrangement reaction as given in Carrasco et al. (2008a):
| (9) |
However, according to Vuitton et al. (2007), \ceHCNH+ had a density over an order of magnitude greater than \ceC2H4+ in Titan’s ionosphere. Therefore, \ceHCNH+ is likely a prevailing contributing ion at this mass in our plasma conditions, too. Further modeling of the plasma conditions will be needed in order to evaluate contributions of these species.
HCNH+ is mainly formed by proton attachment, by Reaction 10, but can also directly depend on a reaction with methane (Reaction 11),
| (10) |
| (11) |
Mass 29 can be \ceC2H5+ or \ceN2H+. As noted previously, \ceN2H+ might be dominant at 1% \ceCH4, whereas \ceC2H5+ is the main ion at higher initial methane concentrations. Yelle et al. (2010) propose a mechanism where \ceN+ reacts with hydrogen by proton transfer (Reaction 12), and the formed \ceNH+ reacts with neutral \ceN2 (Reaction 13).
| (12) |
| (13) |
Two possible reactions can form \ceC2H5+, according to Vuitton et al. (2007) and Carrasco et al. (2008a):
| (14) |
| (15) |
Regarding the formation of \ceH2 relevant to Reaction 12, Lebonnois et al. (2003), and later Krasnopolsky (2009) presented a scheme where \ceH2 is linked to the amount of methane following \ceH + CH2 -¿ H2 + CH. Ongoing work in our laboratory focuses on \ceN2:\ceH2 mixtures, avoiding the carbon contribution from methane. We find that \ceN2H+ is the dominant ion for \ceH2 mixing ratios 5% (A. Chatain, private communication). So, given an abundant enough \ceH2 reservoir, \ceN2H+ should not be neglected compared to \ceC2H5+. \ceN2H+ is therefore most likely more abundant relative to \ceC2H5+ in \ceCH4-poor conditions. With increasing \ceCH4 concentration, \ceC2H5+ production is largely facilitated thanks to \ceCH4 and other hydrocarbons (Reactions 14 and 15), although \ceN2H+ might still be an important precursor at this mass (even with \ceH2 5 % without the presence of carbon in the mixture).
The C3 group is mainly represented by the peak at m/z 42 (e.g. 10% at 5% \ceCH4, see Figure 9), and can be attributed to \ceCH3CNH+ in agreement with the neutral acetonitrile already detected in abundance in Gautier et al. (2011). In our case, the peak at m/z 42 is largely the main peak detected. It can follow two protonation reactions:
| (16) |
| (17) |
Sciamma-O’Brien et al. (2014) examined the first products formed by \ceN2:\ceCH4 mixtures. They also find their highest m/z 42 intensity. Note that \ceC3H6+ is also likely present at this mass. In another similar study by Thissen et al. (2009), analogous conditions to Titan’s ionosphere were simulated using synchrotron radiation of a small gas cell. In that study, no more than C2 ions were effectively detected in N2-CH4 mixtures. After adding hydrocarbons such as \ceC2H2 and \ceC2H4, only then were some C3 and C4 observed. Depending on the mixture, \ceHCNH+, \ceC2H5+ and \ceN2H+ were dominant C2 precursors, confirming experimentally the importance of C2 unsaturated hydrocarbons to promote ion growth, in agreement with observations of Titan’s large ions by the Cassini CAPS instrument (Westlake et al., 2014). Depending on the mixture \ceHCNH+, \ceC2H5+ and \ceN2H+ were dominant C2 precursors.
Finally, the most abundant C4 ion is the one at m/z 52, which increases with increasing methane concentration. Sciamma-O’Brien et al. (2014) noticed an increase of this ion only when injecting \ceC6H6 to their 10% \ceN2:\ceCH4 mixture, and attributed it to the \ceC4H4+ benzene fragment. In our case, we detect it in all three methane conditions. Benzene may be a hydrocarbon aromatic product in our plasma, although its detection has been inconclusive (Gautier et al., 2011; Carrasco et al., 2012). Therefore, a \ceC4H4+ attribution is ambiguous here. The cyanogen \ceC2N2+ and propiolonitrile \ceHC3NH+ cations are the two other potential candidates. Gautier et al. (2011) noted the presence of neutral cyanogen using gas chromatography coupled with mass spectrometry, especially at 1% \ceCH4. Carrasco et al. (2012) firmly confirmed its presence. \ceC2N2 can form from two recombining CN radicals, or from the reaction between HCN and a CN radical (Yung, 1987; Seki et al., 1996), and can be an important ion in particular, at 1% \ceCH4. Protonated propiolonitrile \ceHC3NH+ forms via two proton transfer reactions (Reactions 18 and 19), and are consistent with higher methane amounts, and a shift in peaks from m/z 51 to m/z 52 (Figure 11). This absence of peak shift in the 1% \ceCH4 neutral and ion spectra (Figure 10) and m/z 52 being the most intense to begin with, confirms the attribution of \ceC2N2+ for m/z 52 in the positive ion spectrum at 1% \ceCH4.
| (18) |
| (19) |
4.2 Contribution of aliphatic, amine and nitrile positive ion precursors for tholin growth
The gas phase precursors present in the plasma form an extensive population of cations, whose ion-molecule reactions appear to mainly rely on protonation processes. These ions consist of nitriles (\ceHCNH+, \ceC2N2+), amine (\ceNH4+), aliphatics (e.g. \ceCH5+,C2H3+,C2H5+,C3H3+) and some imines (e.g. \ceCH2NH2+). Constraining the major ion tholin precursors is critical in understanding pathways to their formation in the laboratory, as analogs of Titan’s aerosols.
Infrared absorption of film solid phase material produced in the PAMPRE reactor was performed by Gautier et al. (2012). They found that changing the methane mixing ratio from 1% to 10% significantly impacted the absorption coefficient of tholins, particularly that of primary and secondary amine, aliphatic methyl and \ce-CN/-NC regions. At low \ceCH4 concentration, the amine signature is most intense while the aliphatic bands are hardly present. The saturated and unsaturated nitriles are abundant, and the saturated ones mostly remain up to 5% \ceCH4. This amine influence at 1% and 5% \ceCH4, mostly represented by \ceNH4+ in the current gas phase study, is consistent with the solid phase infrared analysis by Gautier et al. (2012). Future experiments probing intermediate methane conditions would be interesting in order to evaluate the sensitivity of main ions like \ceCH3+, \ceNH4+, \ceHCNH+, \ceN2H+ to a broader range of methane mixing ratios.
Aliphatic cations are especially important at 10% \ceCH4, where we detect the most ions with wider block distributions. This is in agreement with neutral gas phase studies Gautier et al. (2011); Carrasco et al. (2012); Dubois et al. (2019b) that found an increased production of volatiles with high methane concentrations. Cation pathways that might occur in these conditions rely on the efficient production of e.g. \ceCH3+, \ceC2H2+, \ceC2H4+, \ceC2H5+ (see Section 4.1). On the contrary, a small methane concentration was shown by Carrasco et al. (2012) to produce almost exclusively nitrogen-bearing volatile compounds. Our results show 1% \ceCH4 spectra largely dominated by the two m/z 28 and m/z 29 C2 species, attributed to \ceN2+/\ceHCNH+ and \ceN2H+, respectively. As a result, ion-molecule reaction schemes for the production of tholins involving species such as \ceNH4+, \ceN2H+ and \ceHCNH+ might be favored.
Sciamma-O’Brien et al. (2010) found an optimum tholin production for a 3-5% initial methane concentration. At 5% \ceCH4, the C2 represents 44% of all species, and are mainly supported by \ceHCNH+ and \ceC2H5+. Our results agree with previous studies by Pernot et al. (2010); Gautier et al. (2014); Maillard et al. (2018) which indicated copolymeric HCN/\ceC2H4 and poly-(\ceCH2)m(HCN)n structure found in the tholin material. These patterns also seem to be found as cation precursors.
The contribution of m/z 42 attributed to \ceCH3CNH+ is more intense than some of the C1 and C2 species. As seen in the previous section, its production is favored by increasing methane, specifically by \ceHCNH+ and \ceC2H5+. Protonated acetonitrile could be a key positive ion precursor in the peak tholin production region of 5% \ceCH4. A model where aliphatic chain precursors, along with some amine and nitrile cations are significant at 5% \ceCH4, is consistent with the solid phase analysis by Gautier et al. (2012).
4.3 Comparisons with the INMS T40 measurements and group patterns
One of the Ion and Neutral Mass Spectrometer’s (INMS) goals was to probe and analyze the neutral and ion chemistry of Titan’s upper atmosphere, and thus characterize the gas composition (for a more detailed review on the scientific objectives of INMS, see Waite et al., 2004a)). It was also possible to determine the gas number density thanks to the closed source mode. The mass range of INMS was from 1 u to 99 u, while the energy range was from 0 eV to 100 eV and a mass resolution of at 10% of mass peak height. This instrument consisted of two mechanical subsystems, (i) the closed ion source mode and (ii) the open ion source mode. The open ion source mode was used to analyze reactive neutral species and positive ions. The ions were guided through four focusing lenses and then through a set of four quadrupole switching lenses (QL). These switching lenses deflected the ions by 90º and subsequently directed them to a quadrupole mass analyzer. The QL essentially acted as an energy filter in open source mode, similar to our energy filter plates (3). Thus, it was possible to select specific masses (with their specific kinetic energies) and determine their ion energy distributions (range of 1–100 eV).
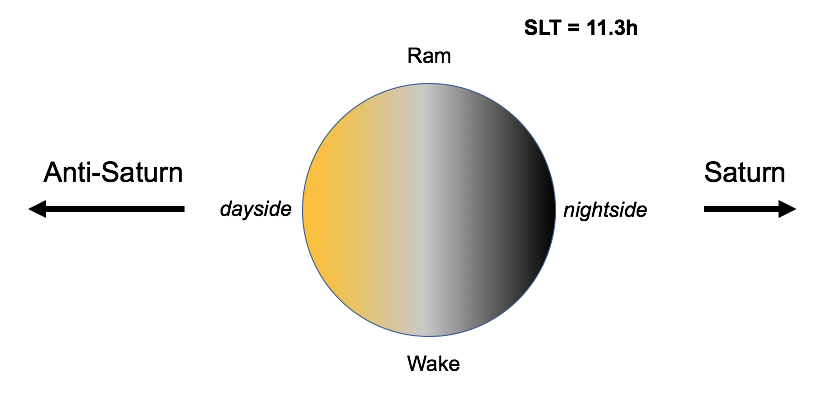
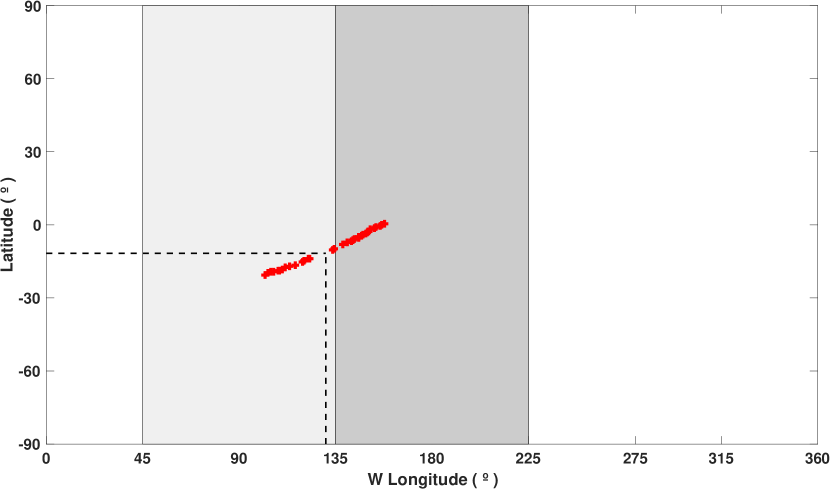
We compared our laboratory spectra with positive ion measurements taken by Cassini-INMS during the T40 flyby. This encounter with Titan took place on January 5, 2008 at 13.0 h, just after Saturn local noon (sunward) with a closest approach at 1010 km above the surface (Figure 12). The passage occurred at 11.7 S latitude and 130.4 W longitude at closest approach. Cassini had a speed of 6.3 , with a 37.6∘ solar phase angle.
During this flyby, four other instruments (VIMS, UVIS, ISS and CIRS) were also in operation. The INMS operated in open source ion mode, enabling a detection of positive ions with energies 100 eV. The integration period was ms, which corresponds to the sum of the set up/read out cycle and the sample integration period (Waite et al. (2004b)). Therefore, it took INMS s to acquire an entire scan.
The fact that this flyby was entirely on the dayside of Titan and measured an important quantity of ions makes it a valuable source for the investigation of positive ions, as well as comparing it with plasma discharge laboratory simulations like PAMPRE. Solar radiation and solar photoionization was thus dominant. Furthermore, Magee et al. (2009) derived a globally averaged methane mixing ratio between 1000 and 1100 km of 2.17 % which T40 was part of. The steady-state methane concentrations used in this study (from 0.5 % to 5 %) fall into or near this value (Sciamma-O’Brien et al., 2010).
Previous studies have specifically focused on this T40 flyby, which, incidentally, occurred during a solar minimum activity (Lavvas et al., 2011; Richard et al., 2015) with an index of 77.1. Westlake et al. (2011) found that the neutral average temperature during this flyby was 141 K. The plasma environment surrounding Titan during this encounter was unique. The measured electron distribution was categorized as bi-modal by Rymer et al. (2009), using CAPS Electron Spectrometer (ELS) and MIMI Low Energy Magnetospheric Measurements System (LEMMS) data. They proposed that this unusual distribution, also observed at T26, T31, T46 and T47, may have been the result of two sources: the more energetic ( 5 keV) electrons coming from the plasma sheet, while the less energetic electrons ( 0.2 keV) may be local pick-up electrons from the inner magnetosphere and interactions with Enceladus water group neutrals.
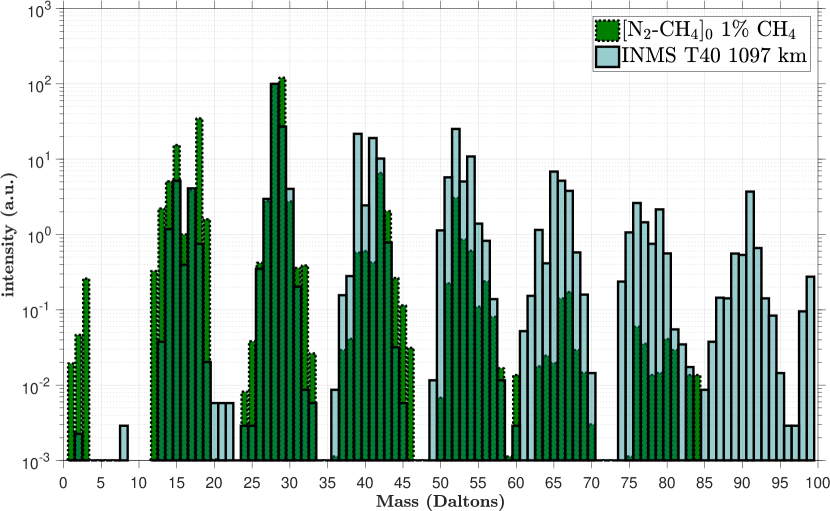
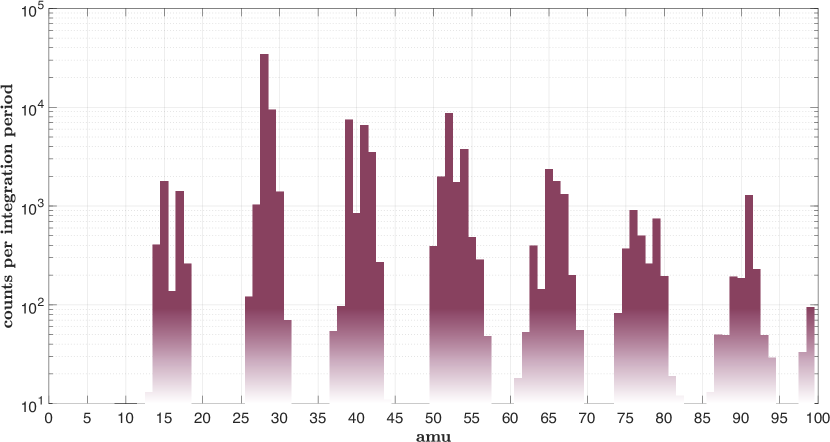
A T40 spectrum taken at an altitude of 1097 km in the outbound leg of the pass is plotted in Figure 13, on top of our normalized experimental 1%, 5% and 10% CH4 spectra (the reader is also referred to Figure 6 of the Supplementary Material for the reference spectrum). The INMS spectrum is represented as a histogram, with mass bins of 1 u. All are normalized to the intensity at m/z 28. The T40 spectrum is made of seven clusters, each separated by about 6-8 u. The main C1 compounds are at m/z 15 and m/z 17, which have been attributed to \ceCH3+ and \ceCH5+ by Vuitton et al. (2007). The presumed \ceHCNH+ and \ceC2H5+ are an order of magnitude higher in intensity. Our 1% spectrum reproduces fairly well the distributions of the grouping patterns of the lighter ions, up to the C4 species (Figure 13a). However, the subsequent intensities decrease by orders of magnitude with each new block, with no detection beyond m/z 84. Moreover, \ceNH4+ is overrepresented in the experimental spectrum (11% of the entire spectrum, Figure 9), although the efficient formation of ammonia and \ceCH4+ may be facilitated by wall catalysis effects (Touvelle et al., 1987; Carrasco et al., 2012). Note that a water presence in the reactor with the \ceH2O+ ion cannot be ruled out. The distribution of C2 compounds is faithfully reproduced by our experimental spectra, suggesting that they at least partially play a key role in reactions with primary ions as precursors to tholin formation. As indicated in Figure 9, C2 species represent 44% to 74% of the spectrum, depending on the \ceCH4 condition. The equivalent charts for the T40 spectrum at 1097 km are shown in Figure 14. The C2 species account for 47% of this spectrum, led by ions at m/z 28 at 35%, and m/z 29 at 10%. This distribution is similar to the one we find at 5% \ceCH4, i.e. 25% for m/z 28 and 11% for m/z 29 (Figure 13b) and Figure 14). The overall average C2 contribution is 44% in the experimental case (Figure 9), comparable with the 47% in the INMS spectrum (Figure 14). In the experimental spectra, increasing the methane concentration favors the production of different heavier ions, e.g. at m/z 39, m/z 51, m/z 55 and species larger than the C5 group.
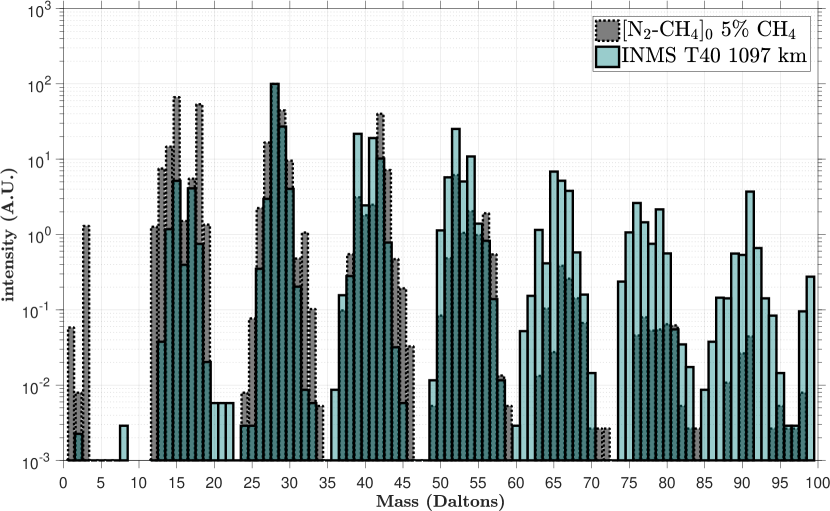

The 10% methane-rich condition (Figure 13c) displays the widest population of ions. We also see a rightward drift of the blocks, especially for higher masses. This is consistent with the rich presence of hydrogenated species. The major ions coincide with INMS’ for the C1, C2 and C4 groups. As seen previously, the ratio in normalized intensities reaches 2, when it was 12 with 1% \ceCH4. Nonetheless, m/z 42 remains the most abundant C3 ion in all three conditions we have studied, in particular with higher methane amounts. This coincidence with the main INMS cations is particularly noticeable for masses 15, 28, 39, 41, 42 and 52. Cx groups from the INMS and experimental data are asymmetrical and their respective mass ranges vary. The groups from the PAMPRE spectra obtained with 10% of methane are wider and more species are generally detected to the right hand side of each group. These right wings are consistent with a higher contribution of saturated species in our conditions with a high methane amount. Generally, we note that fewer higher mass ions are detected in all experimental spectra (with a noticeable decrease in intensity after m/z 60) compared to the INMS spectra. In the plasma discharge, the residence time of light and heavy neutral products is short (i.e. 28 s at 55 sccm with a pressure of 0.9 mbar) while the gas flow is fast. This lower contribution of large ions in our experiment compared to Titan’s ionosphere might also be due to surface recombination of radicals occurring on the walls of the chamber, limiting their lifetime and further growth chemistry. Modeling work by Alves et al. (2012) did indeed previously show an efficient wall loss process of N radicals in the case of a pure \ceN2 discharge.

The INMS measurements are characterized by a repetition of block patterns separated by 11-13 u, and 10-14 u in the PAMPRE spectra. The INMS data shows a significant contribution of the C2 group, 47% at 1097 km. Vuitton et al. (2007) determined that at the ionospheric peak during T5, the primary ions formed by ionization are quickly converted into higher mass hydrocarbons, such as \ceC2H5+ and \cec-C3H3+. The few nitrogen-bearing compounds are led by \ceHCNH+, \ceCH3CNH+ and \ceHC3NH+, with densities of , and cm-3, respectively. We find overlaps between the experimental and T40 spectra, for our 5% and 10% \ceCH4 spectra, with one discrepancy at m/z 39 and 41. The C3 ions detected during T40 are dominated by the peaks at m/z 39, m/z 41 and m/z 42, the latter being the most intense peak in our experimental spectra. The peak at m/z 39 is most intense with a 10% \ceCH4 mixing ratio, which confirms the attribution of \ceC3H3+.
Comparing these findings with neutral spectra is essential for interpretation. Acetonitrile was unambiguously attributed to m/z 41 by Gautier et al. (2011); Carrasco et al. (2012) in their neutral gas phase studies, and correlated with methane concentration. Protonation of acetonitrile seems therefore likely to explain its significant presence, notably at 5% \ceCH4 (Figure 9), following Reaction 16.
Westlake et al. (2012) used a 1-D photochemical model which was able to reproduce the ion-molecule chemistry between the primary ion products, using retrieved INMS data from the same T40 flyby. They deduced that among the two major nitrogen-bearing species in the C3 group, i.e. \ceHC2NH+ and \ceCH3CNH+, the latter had a higher density by a factor of 4 at the ionospheric peak.
Overall, the 5% experimental spectrum appears to match well the INMS spectra of the first four groups, as the intensity decreases for higher masses. The 10% \ceCH4 spectra also reproduce some of the higher mass features, although the group distributions present large wings, which is most likely due to unsaturated hydrocarbons.
According to Westlake et al. (2012), the three major ions, \ceCH5+, \ceC2H5+ and \ceHCNH+ are connected through the following reactions:
| (20) |
| (21) |
| (22) |
Figure 14 and Table 2 show a comparison of these three major ions between our experimental normalized intensities from Figure 9 and their signal from the T40 flyby near the ionospheric peak ( row) taken from Westlake et al. (2012) ( row). On average the 1% and 5% \ceCH4 row values for these three ions match with the intensities of T40, except for \ceC2H5+ which is much higher at 1% \ceCH4. Note however that, at 1% \ceCH4 in particular, \ceN2H+ may also be an important ion at m/z 29 in our experimental spectra, as explained in Section 4.1.
| [\ceCH4]0 | \ceCH5+ | \ceN2H+ — \ceC2H5+ | \ceHCNH+ | ||
|---|---|---|---|---|---|
| \hdashline | m/z 17 | m/z 29 | m/z 28 | ||
| 1% | 1% | 39% | - | 33% | 74% |
| 5% | 1% | - | 11% | 25% | 37% |
| 10% | 2% | - | 10% | 18% | 30% |
| 2% | - | 14% | 50% | 66% | |
| 1% | - | 10% | 35% | 46% | |
5 Conclusions
We have conducted the first positive ion analysis in our PAMPRE plasma chamber using an ion mass spectrometer, aimed at analyzing the gas phase cation precursors to the formation of Titan tholins. This setup enables us to approach the extracting tube in direct contact with the plasma and analyze the positive ions in situ. We used three initial methane concentrations, 1%, 5% and 10%, which showed a wide variability in peak distribution and size among the different conditions.
Furthermore, spectra taken in a 1% \ceCH4 mixing ratio condition are mostly dominated by nitrogen-bearing ions, such as \ceNH4+, \ceHCNH+ and \ceN2H+/\ceC2H5+. We also found that the spectra using this methane concentration are largely dominated by two C2 species, at m/z 28 and m/z 29, representing % of the entire spectrum. A 1% \ceCH4 condition also corresponds to the most efficient gas-to-solid carbon conversion, i.e. the amount of carbon converted into the tholin product as opposed to the gas phase products (Sciamma-O’Brien et al., 2010). The ammonium ion \ceNH4+ is the third major ion with an \ceN2:\ceCH4 (99:1) mixing ratio.
Positive ions in a methane-rich mixture of 10% \ceCH4 are more diverse and abundant in hydrocarbon cations. Primary methane ions (\ceCH+, \ceCH2+, \ceCH3+) dominate the C1 group. This aliphatic contribution in the gas phase agrees with aliphatic absorption present in the solid phase of 10% \ceCH4 tholins. The intermediate 5% methane concentration that we chose falls in the optimum of tholin production in our plasma discharge. Here, the ion precursors are composed of protonated nitrile and aliphatic species. \ceHCNH+ and \ceC2H5+ are major ions. C2 cations thus seem to play an important role as a gas phase precursor to tholin formation. Their dominating presence is in agreement with the HCN/\ceC2H4 copolymerization patterns found in tholins. The largest contribution of the heavier \ceCH3CNH+ ion is seen in this condition.
A majority of attributed ions seems to form via proton transfer reactions, consistent with methane injection. The primary ions of the C1 group are most abundant with a 5% \ceCH4 mixing ratio, suggesting that at least in this condition, these species are a key precursor reservoir, available to react with larger ions.
Our preliminary comparisons with INMS measurements performed near the ionospheric peak during the T40 flyby show promising overlaps, particularly with the 1% and 5% \ceCH4 spectra. Future work should thus explore intermediate concentrations to constrain the importance of the primary ions as key precursors involved in the reaction schemes leading to the formation of Titan tholins combined with modeling work investigating the ion-neutral coupling in the \ceN2:\ceCH4 discharge. Finally, while ground-based detections of cations in Titan’s upper atmosphere have yet to surface, their measurements would enhance Cassini’s legacy, especially since Titan passed aphelion in April of 2018 entering an 8-year southern winter, which could potentially impact the volatile distribution in the upper atmosphere. Relatively abundant species such as \ceHCNH+, \ceC2H5+ or \ceCH2NH2+, potentially involved in hydrogenation processes with prebiotic interest, would make good targets for observations in synergy with theoretical predictions.
Acknowledgements
The authors are indebted to two anonymous reviewers whose insightful comments substantially improved the quality of the manuscript. We acknowledge financial support from the European Research Council Starting Grant (grant agreement no. 636829), and data provided by the Cassini INMS instrument available through the PDS. We are also grateful for discussions on cation chemistry with Dr. Jérémy Bourgalais.
Supplementary Material
Appendix A Materials and methods
A.1 Positive ion mass spectrometry
The multiplier potential is set at 1800 V. Within the transfer tube, in positive ion mode, two guiding lenses are set at -19 V and -102 V, respectively.
Table 3 lists all the intrinsic parameters pertaining to the spectrometer’s optics used for our positive ion measurements. The different components can be seen in more detail in Figure 3. The detector consists of the multiplier (Figure 3). It is connected with (i) the 1st dynode which sets the voltage on the front of the detector and (ii) the discriminator setting a threshold on the pulse output of the multiplier. The Extraction group controls the gating system. This gating is only switched on and operational if the RF head is connected through a transistor-transistor logic (TTL) system, which was not the case in this study. The flight-focus mainly controls the guiding of the ions. The energy filter (described in the next section) is tunable along with a set of other lenses downstream of the flight-focus. The emission source is only set in neutral mode. Ion extraction was made possible by applying a negative polarity to the aperture, thus directly extracting said ions from the first chemical steps of the expanding plasma. The main relevant varying parameters here are the lens1 and extractor potentials. The latter has a negative value for positive ion extraction. As we will see in the following section, the energy variable part of the Sector component determines the energy filtering which will be fine-tuned for each gas mixture.
| Group | Name | Value | Units |
|---|---|---|---|
| Detector | 1st dynode | -3500 | V |
| discriminator | -10 | % | |
| multiplier | 1800 | V | |
| Extraction | extractor | -191 | V |
| gate delay | 0.1 | ||
| gate width | 0.0 | ||
| lens 1 | -19 | V | |
| Flight-focus | flight-focus | -69 | V |
| Quad | delta-m | 0 | % |
| focus2 | -176 | V | |
| resolution | 0 | % | |
| suppressor | -200 | V | |
| transit-energy | 0.0 | V | |
| Sector | D.C. quad | 22 | % |
| axis | -40.0 | V | |
| energy | 2.2 | V | |
| horiz | -5 | % | |
| lens2 | -102 | V | |
| plates | 7.4 | V | |
| vert | -20 | % | |
| Source | cage | 0.0 | V |
| electron-energy | 70.0 | V | |
| emission | 100.0 | ||
| Other | CRV-range | 7 | |
| CRV-resolution | 6 | bits | |
| gating | 0 | (1=on, 0=off) | |
| gating-invert | 0 | (0=normal, 1=invert) | |
| mass | 28.0 | u | |
| mode-change | 1000 | ms |
A.2 Ion filter energy profiles
Ion energy studies in plasma discharges have previously shown their dependences to experimental setups and plasma compositions. Field et al. (1991) first reported on the energy profile of certain ions (e.g. \ceO2+) derived from theoretical calculations and compared with experimental results in a radiofrequency plasma discharge. Further studies examined the role of plasma rf sheaths and pressure-dependence on ion energy distributions (Gudmundsson et al., 1999; Kawamura, 1999; Wang and Olthoff, 1999). In this setup, it is possible to measure and quantify the Energy Distribution (ED) at the energy filtering plate, for specific masses in different plasma conditions. The energy parameter from the Sector group (Table 3) corresponds to the energy filter (plates) of Figure 3 and controls the energy of the ions which are mass analyzed by the Quadrupole Mass Spectrometer (QMS) detector later on. Therefore, a lens optimization is crucial before each mass analysis. For Titan, as stated in the previous section, different ions may have different kinetic energies during detection by INMS. This variation may be due to atmospheric composition, plasma flow composition, spacecraft velocity, (Waite et al., 2004b; Lavvas et al., 2013). In our experiments, the main fluctuating parameter is the \ceN2-\ceCH4 mixing ratio. Corresponding mass spectra with an optimized energy filter will be presented in the following section.
A.3 Protocol
As stated previously, the analysis of cations in the plasma discharge requires that (i) the spectrometer not be obstructed by incoming tholins to provide accurate intensity measurements and not interfere with the optics potentials in the transfer tube, and (ii) the mass analysis be optimized to the corresponding energy distribution of the highest mass (m/z 28); the latter being significant in most methane mixing ratios. A set of four experiments is carried out for each chosen mixing ratio. Every other experiment, we ”calibrate” our measurement by carrying out an \ceO2 plasma in specific conditions for a given steady distance from the plasma. This critical step in controlled conditions assures us that the extractor is not obstructed by tholins, by setting a reference intensity value at m/z 32 (i.e. \ceO2+ at c/s and c/s when the aperture is obstructed). If the intensity of the latter mass has not decreased from one mixing ratio to another, this means tholins have not accumulated on the extractor. Thus, measurements from one experiment to the next are reliable. This is an important step to take into account, given how efficient the setup is to produce tholins (Sciamma-O’Brien et al., 2010). Furthermore, energy distributions are measured through energy filter plates and optimized before each experimental run, in order to tune the filter system for mass analysis.
Appendix B Results
B.1 Energy Filter Distributions of selected species
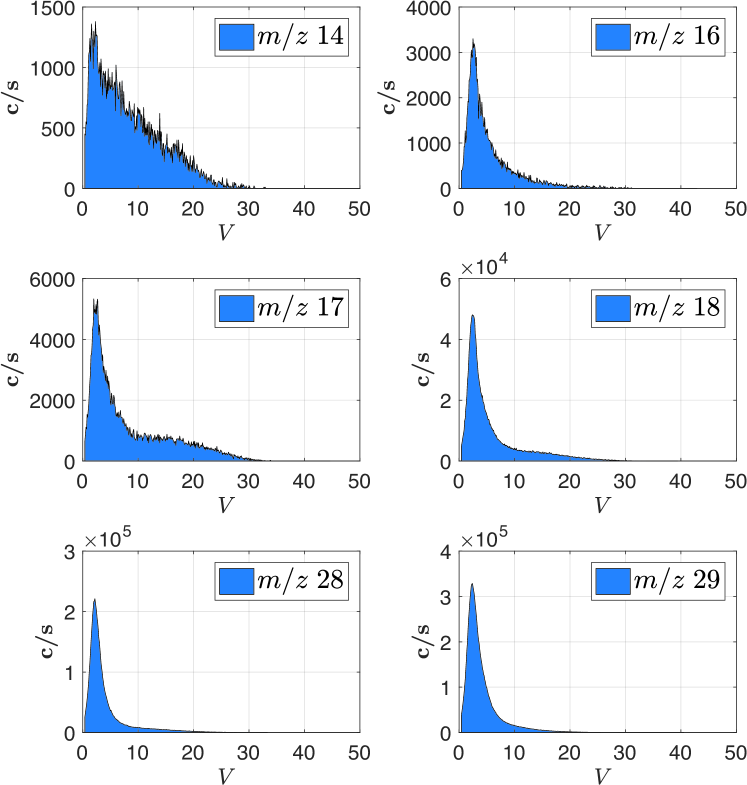
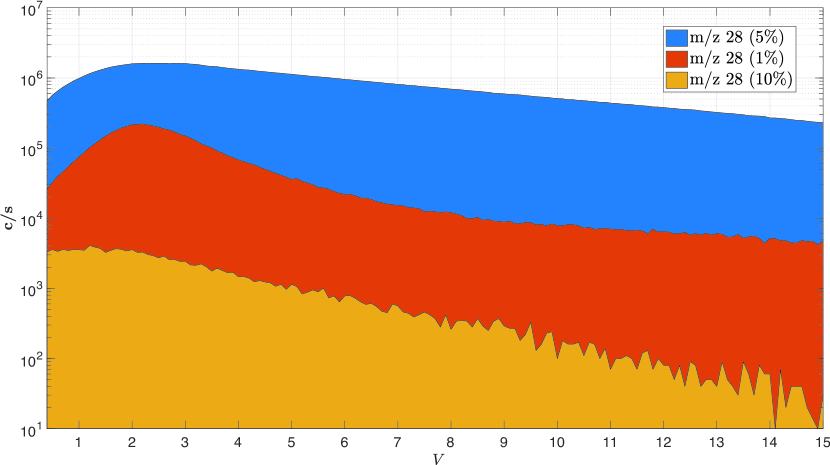
The energy filter (Figure 3) scans the entirety of available potentials ( 100 V) for selected masses. This parameter represents the potential applied to the energy filter plate, between the focus2 lens and the QMS. Consequently, one can obtain fairly reproducible energy distributions for different ions which are part of the same gas mixture and at the same pressure. Hence it is possible to get such a distribution for any given plasma discharge condition. To get a good estimate of these energy distributions (EDs) and to make sure the energy distributions for specific ions are representative of the entire plasma, we chose six different ions: m/z 14, 16, 17, 18, 28 and 29, which are expected to be present and detected in our plasma. Figure 15 shows the EDs measured at the energy filter electrode. The m/z 28 and m/z 29 distributions are likely the most representative of two major compounds given their high count intensities. Nonetheless, these EDs are consistent in their distribution for one given condition, as well as for ions of different masses. The distribution for m/z 14 is affected by low intensity counts, but all other five have Maxwellian distributions, centered at 2.2 V for 1% \ceCH4, 2.2 V for 5% \ceCH4 and 1.2 V for 10% \ceCH4 (Table 4). These differences imply a difference in chemistry and ion composition in the plasma. Figure 16 shows the ED taken at m/z 28 for [\ceCH4]0=1%, 5% and 10% mixtures.
EDs can sometimes be bi-modal, as can be slightly seen for m/z 17. This bi-modal distribution could be an instrumental artifact (lens coating, re-acceleration of ions in the skimmer) or attributed to plasma sheath effects (Kawamura, 1999). Figure 16 shows the superimposed EDs for m/z 28 in all conditions. The tail of the Maxwellian starts decreasing by at least an order of magnitude after 3 V, with peaks between 1 and 3 V.
| [CH4]0 (%) | energy (V) |
|---|---|
| 1 | 2.2 |
| 5 | 2.2 |
| 10 | 1.2 |
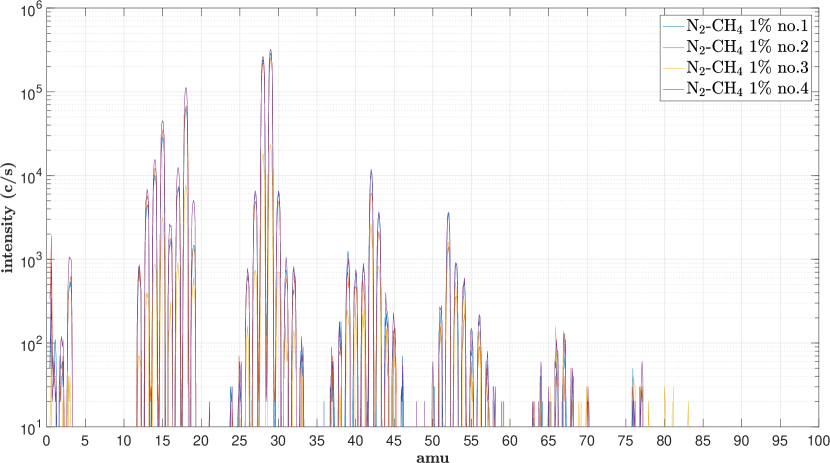
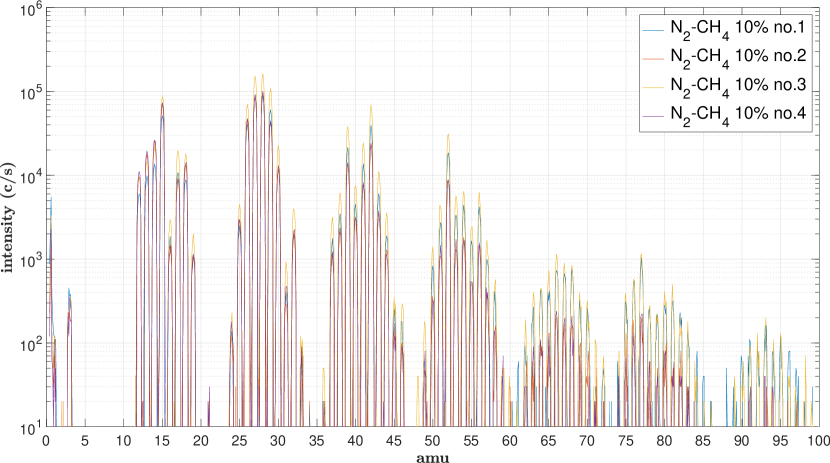
We acquired four spectra in each condition (Figures 17 and 18). We see a temporal signal variability, attributed to the potential instabilities between the extractor and the plasma. For example, the m/z 28 intensity at 10% (Figure 18) varies from to c/s, and from to c/s for m/z 52 (33,958 and 10,636 standard deviation, respectively). At 1% CH4, the m/z 28 and m/z 52 intensities vary from to c/s, and to c/s, respectively (standard deviations of 186,000 and 1229). Other factors such as tholin coating on the extractor or intrinsic plasma variations may also play a role in these fluctuations. This is why we will henceforth normalize all spectra at m/z 28, and units will be expressed as arbitrary units (A.U.).
References
- Ågren et al. (2009) Ågren, K., Wahlund, J., Garnier, P., Modolo, R., Cui, J., Galand, M., Mu, I., 2009. On the ionospheric structure of Titan. Planetary and Space Science 57, 1821–1827. doi:10.1016/j.pss.2009.04.012.
- Alves et al. (2012) Alves, L.L., Marques, L., Pintassilgo, C.D., Wattieaux, G., Es-sebbar, E., Berndt, J., Kovacević, E., Carrasco, N., Boufendi, L., Cernogora, G., 2012. Capacitively coupled radio-frequency discharges in nitrogen at low pressures. Plasma Sources Science and Technology 21, 045008. doi:10.1088/0963-0252/21/4/045008.
- Canagaratna et al. (2007) Canagaratna, M.R., Jayne, J.T., Jimenez, J.L., Allan, J.D., Alfarra, M.R., Zhang, Q., Onasch, T.B., Drewnick, F., Coe, H., Middlebrook, A., Delia, A., Williams, L.R., Trimborn, A., Northway, M., DeCarlo, P., Kolb, C., Davidovits, P., Worsnop, D., 2007. CHEMICAL AND MICROPHYSICAL CHARACTERIZATION OF AMBIENT AEROSOLS WITH THE AERODYNE AEROSOL MASS SPECTROMETER. Mass Spectrometry Reviews 26, 185–222. URL: https://apps.who.int/iris/bitstream/handle/10665/254610/WHO-MSD-MER-2017.2-eng.pdf?sequence=1{%}0Ahttp://apps.who.int/iris/bitstream/handle/10665/254610/WHO-MSD-MER-2017.2-eng.pdf;jsessionid=F9A3B620D10ECFAF8498AC0E08EFCBC8?sequence=1{%}0Ahttp://apps.who.int/, doi:10.1002/mas, arXiv:NIHMS150003.
- Carrasco et al. (2008a) Carrasco, N., Alcaraz, C., Dutuit, O., Plessis, S., Thissen, R., Vuitton, V., Yelle, R., Pernot, P., 2008a. Sensitivity of a Titan ionospheric model to the ion-molecule reaction parameters. Planetary and Space Science 56, 1644–1657. URL: http://www.sciencedirect.com/science/article/pii/S0032063308001025, doi:10.1016/j.pss.2008.04.007.
- Carrasco et al. (2012) Carrasco, N., Gautier, T., touhami Es-sebbar, E., Pernot, P., Cernogora, G., 2012. Volatile products controlling Titan’s tholins production. Icarus 219, 230–240. URL: http://dx.doi.org/10.1016/j.icarus.2012.02.034, doi:10.1016/j.icarus.2012.02.034.
- Carrasco et al. (2008b) Carrasco, N., Plessis, S., Pernot, P., 2008b. Towards a reduction of the bimolecular reaction model for Titan ionosphere. International Journal of Chemical Kinetics 40, 699–709. URL: http://dx.doi.org/10.1002/kin.20374, doi:10.1002/kin.
- Coates et al. (2007) Coates, A.J., Crary, F.J., Young, D.T., Szego, K., Arridge, C.S., Bebesi, Z., Jr, E.C.S., Hartle, R.E., Hill, T.W., 2007. Ionospheric electrons in Titan’s tail : Plasma structure during the Cassini T9 encounter. Geophysical Research Letters 34, 1–6. doi:10.1029/2007GL030919.
- Cravens et al. (2006) Cravens, T.E., Robertson, I.P., Waite, J.H., Yelle, R.V., Kasprzak, W.T., Keller, C.N., Ledvina, S.A., Niemann, H.B., Luhmann, J.G., McNutt, R.L., Ip, W.H., De La Haye, V., Mueller-Wodarg, I., Wahlund, J.E., Anicich, V.G., Vuitton, V., 2006. Composition of Titan’s ionosphere. Geophysical Research Letters 33, 8–11. doi:10.1029/2005GL025575.
- Desai et al. (2017) Desai, R.T., Coates, A.J., Wellbrock, A., Vuitton, V., Crary, F.J., González-Caniulef, D., Shebanits, O., Jones, G.H., Lewis, G.R., Waite, J.H., Taylor, S.A., Kataria, D.O., Wahlund, J.E., Edberg, N.J.T., Sittler, E.C., 2017. Carbon chain anions and the growth of complex organic molecules in Titan’s ionosphere. The Astrophysical Journal Letters 844, 1–8. URL: http://arxiv.org/abs/1706.01610, doi:10.3847/2041-8213/aa7851, arXiv:1706.01610.
- Dubois et al. (2019a) Dubois, D., Carrasco, N., Bourgalais, J., Vettier, L., Desai, R.T., Wellbrock, A., Coates, A.J., 2019a. Nitrogen-containing Anions and Tholin Growth in Titan’s Ionosphere : Implications for Cassini CAPS-ELS Observations. The Astrophysical Journal Letters 872, L31. URL: http://dx.doi.org/10.3847/2041-8213/ab05e5, doi:10.3847/2041-8213/ab05e5.
- Dubois et al. (2019b) Dubois, D., Carrasco, N., Petrucciani, M., Vettier, L., Tigrine, S., Pernot, P., 2019b. In situ investigation of neutrals involved in the formation of Titan tholins. Icarus 317. doi:10.1016/j.icarus.2018.07.006.
- Field et al. (1991) Field, D., Klemperer, D.F., May, P.W., Song, Y.P., 1991. Ion energy distributions in radio-frequency discharges. Journal of Applied Physics 70, 82–92. doi:10.1063/1.350247.
- Fox and Yelle (1997) Fox, J.L., Yelle, R.V., 1997. Hydrocarbon ions in the ionosphere of Titan. Geophysical Research Letters 24, 2179–2182. doi:10.1029/97GL02051.
- Gautier et al. (2011) Gautier, T., Carrasco, N., Buch, A., Szopa, C., Sciamma-O’Brien, E., Cernogora, G., 2011. Nitrile gas chemistry in Titan’s atmosphere. Icarus 213, 625–635. doi:10.1016/j.icarus.2011.04.005.
- Gautier et al. (2012) Gautier, T., Carrasco, N., Mahjoub, A., Vinatier, S., Giuliani, A., Szopa, C., Anderson, C.M., Correia, J.J., Dumas, P., Cernogora, G., 2012. Mid- and far-infrared absorption spectroscopy of Titan’s aerosols analogues. Icarus 221, 320–327. URL: http://dx.doi.org/10.1016/j.icarus.2012.07.025, doi:10.1016/j.icarus.2012.07.025.
- Gautier et al. (2014) Gautier, T., Carrasco, N., Schmitz-Afonso, I., Touboul, D., Szopa, C., Buch, A., Pernot, P., 2014. Nitrogen incorporation in titan’s tholins inferred by high resolution orbitrap mass spectrometry and gas chromatography-mass spectrometry. Earth and Planetary Science Letters 404, 33–42. URL: http://dx.doi.org/10.1016/j.epsl.2014.07.011, doi:10.1016/j.epsl.2014.07.011.
- Gudmundsson et al. (1999) Gudmundsson, J.T., Kimura, T., Lieberman, M., 1999. Experimental studies of O 2 /Ar plasma in a planar inductive discharge. Plasma Sources Science and Technology 8, 22–30. URL: http://stacks.iop.org/0963-0252/8/i=1/a=003?key=crossref.47514f9adf2b7c80d343b6ddf2104a36, doi:10.1088/0963-0252/8/1/003.
- Hanel et al. (1981) Hanel, R., Conrath, B., Flasar, F.M., Kunde, V.G., Maguire, W.C., Pearl, J., Pirraglia, J., Samuelson, R.E., Herath, L., Allison, M., Cruikshank, D., Gautier, D., Gierasch, P., Horn, L., Koppany, R., Ponnamperuma, C., 1981. Infrared Observations of the Saturnian System from Voyager 1. Science 212, 192–200. URL: http://www.sciencemag.org/cgi/doi/10.1126/science.212.4491.192, doi:10.1126/science.212.4491.192.
- Hörst (2017) Hörst, S.M., 2017. Titan’s Atmosphere and Climate. Journal of Geophysical Research: Planets , 432–482URL: http://arxiv.org/abs/1702.08611, doi:10.1002/2016JE005240, arXiv:1702.08611.
- Ip (1990) Ip, W.H., 1990. Titan’s upper ionosphere. The Astrophysical journal , 354–363.
- Kawamura (1999) Kawamura, E., 1999. Ion energy distributions in rf sheaths; review, analysis and simulation. Plasma Sources Science and Technology 8, R45–R64.
- Keller et al. (1998) Keller, C.N., Anicich, V.G., Cravens, T.E., 1998. Model of Titan’s ionosphere with detailed hydrocarbon ion chemistry. Planet. Space Sci. 46, 1157–1174. doi:Doi:10.1016/s0032-0633(98)00053-1.
- Keller et al. (1992) Keller, C.N., Cravens, T.E., Gan, L., 1992. A model of the ionosphere of Titan. Journal of Geophysical Research, [Space Physics] 97, 12117–12135.
- Khare and Sagan (1973) Khare, B., Sagan, C., 1973. Red clouds in reducing atmospheres. Icarus 20, 311–321. URL: http://www.sciencedirect.com/science/article/pii/0019103573900080, doi:10.1016/0019-1035(73)90008-0.
- Krasnopolsky (2009) Krasnopolsky, V.A., 2009. A photochemical model of Titan’s atmosphere and ionosphere. Icarus 201, 226–256. URL: http://www.sciencedirect.com/science/article/pii/S0019103509000062, doi:10.1016/j.icarus.2008.12.038.
- Krasnopolsky (2014) Krasnopolsky, V.a., 2014. Chemical composition of Titan’s atmosphere and ionosphere: Observations and the photochemical model. Icarus 236, 83–91. URL: http://dx.doi.org/10.1016/j.icarus.2014.03.041, doi:10.1016/j.pss.2006.04.019.
- Lavvas et al. (2011) Lavvas, P., Galand, M., Yelle, R.V., Heays, A.N., Lewis, B.R., Lewis, G.R., Coates, A.J., 2011. Energy deposition and primary chemical products in Titan’s upper atmosphere. Icarus 213, 233–251. URL: http://dx.doi.org/10.1016/j.icarus.2011.03.001, doi:10.1016/j.icarus.2011.03.001.
- Lavvas et al. (2013) Lavvas, P., Yelle, R.V., Koskinen, T., Bazin, A., Vuitton, V., Vigren, E., Galand, M., Wellbrock, A., Coates, A.J., Wahlund, J.E., Crary, F.J., Snowden, D., 2013. Aerosol growth in Titan’s ionosphere. Proceedings of the National Academy of Sciences 110, 2729–2734. URL: http://www.pnas.org/cgi/doi/10.1073/pnas.1217059110.
- Lebonnois et al. (2003) Lebonnois, S., Bakes, E.L., McKay, C.P., 2003. Atomic and molecular hydrogen budget in Titan’s atmosphere. Icarus 161, 474–485. doi:10.1016/S0019-1035(02)00039-8.
- Magee et al. (2009) Magee, B.A., Waite, J.H., Mandt, K.E., Westlake, J., Bell, J., Gell, D.A., 2009. INMS-derived composition of Titan’s upper atmosphere: Analysis methods and model comparison. Planetary and Space Science 57, 1895–1916. URL: http://dx.doi.org/10.1016/j.pss.2009.06.016, doi:10.1016/j.pss.2009.06.016.
- Maillard et al. (2018) Maillard, J., Carrasco, N., Schmitz-afonso, I., Gautier, T., Afonso, C., 2018. Comparison of soluble and insoluble organic matter in analogues of Titan ’ s aerosols. Earth and Planetary Science Letters 495, 185–191. URL: https://doi.org/10.1016/j.epsl.2018.05.014, doi:10.1016/j.epsl.2018.05.014.
- McLafferty and Turecek (1993) McLafferty, F.W., Turecek, F., 1993. Interpretation of Mass Spectra, 4th Edition. University Science Books.
- Mutsukura (2001) Mutsukura, N., 2001. Deposition of Diamondlike Carbon Film and Mass Spectrometry Measurement in CH 4 / N 2 RF Plasma 21, 265–277.
- Pernot et al. (2010) Pernot, P., Carrasco, N., Thissen, R., Schmitz-Afonso, I., 2010. Tholinomics—Chemical Analysis of Nitrogen-Rich Polymers. Analytical Chemistry 82, 1371–1380. URL: http://pubs.acs.org/doi/abs/10.1021/ac902458q, doi:10.1021/ac902458q.
- Richard et al. (2015) Richard, M.S., Cravens, T.E., Wylie, C., Webb, D., Chediak, Q., Perryman, R., Mandt, K., Westlake, J., Waite, J.H., Robertson, I., Magee, B.A., Edberg, N.J.T., 2015. An empirical approach to modeling ion production rates in Titan’s ionosphere I: Ion production rates on the dayside and globally , 1–17doi:10.1002/2014JA020343.An.
- Rymer et al. (2009) Rymer, A.M., Smith, H.T., Wellbrock, A., Coates, A.J., Young, D.T., 2009. Discrete classification and electron energy spectra of Titan’s varied magnetospheric environment. Geophysical Research Letters 36, 1–6. doi:10.1029/2009GL039427.
- Sagan (1973) Sagan, C., 1973. The greenhouse of Titan. Icarus 18, 649–656. doi:10.1016/0019-1035(73)90068-7.
- Sciamma-O’Brien et al. (2010) Sciamma-O’Brien, E., Carrasco, N., Szopa, C., Buch, A., Cernogora, G., 2010. Titan’s atmosphere: An optimal gas mixture for aerosol production? Icarus 209, 704–714. URL: http://www.sciencedirect.com/science/article/pii/S0019103510001570, doi:10.1016/j.icarus.2010.04.009.
- Sciamma-O’Brien et al. (2014) Sciamma-O’Brien, E., Ricketts, C.L., Salama, F., 2014. The Titan haze simulation experiment on cOsmic: Probing titan’s atmospheric chemistry at low temperature. Icarus 243, 325–336. URL: http://dx.doi.org/10.1016/j.icarus.2014.08.004, doi:10.1016/j.icarus.2014.08.004.
- Seki et al. (1996) Seki, K., Yagi, M., He, M., Halpem, J., Okabe, H., 1996. Reaction rates of the CN radical with diacetylene and dicyanoacetylene. Chemical Physics Letters 4, 0–5.
- Shebanits et al. (2017) Shebanits, O., Vigren, E., Wahlund, J.E., Holmberg, M.K., Morooka, M., Edberg, N.J., Mandt, K.E., Waite, J.H., 2017. Titan’s ionosphere: A survey of solar EUV influences. Journal of Geophysical Research: Space Physics 122, 7491–7503. doi:10.1002/2017JA023987.
- Shebanits et al. (2013) Shebanits, O., Wahlund, J.E., Mandt, K., Ågren, K., Edberg, N.J., Waite, J.H., 2013. Negative ion densities in the ionosphere of Titan-Cassini RPWS/LP results. Planetary and Space Science 84, 153–162. URL: http://dx.doi.org/10.1016/j.pss.2013.05.021, doi:10.1016/j.pss.2013.05.021.
- Sittler et al. (2009) Sittler, E., Ali, A., Cooper, J., Hartle, R., Johnson, R., Coates, A., Young, D., 2009. Heavy ion formation in Titan’s ionosphere: Magnetospheric introduction of free oxygen and a source of Titan’s aerosols? Planetary and Space Science 57, 1547–1557. URL: http://www.sciencedirect.com/science/article/pii/S0032063309002268, doi:10.1016/j.pss.2009.07.017.
- Szopa et al. (2006) Szopa, C., Cernogora, G., Boufendi, L., Correia, J.J., Coll, P., 2006. PAMPRE: A dusty plasma experiment for Titan’s tholins production and study. Planetary and Space Science 54, 394–404. URL: http://www.sciencedirect.com/science/article/pii/S003206330600002X, doi:10.1016/j.pss.2005.12.012.
- Thissen et al. (2009) Thissen, R., Vuitton, V., Lavvas, P., Lemaire, J., Dehon, C., Dutuit, O., Smith, M.A., Turchini, S., Catone, D., Yelle, R.V., Pernot, P., Somogyi, A., Coreno, M., 2009. Laboratory studies of molecular growth in the titan ionosphere. Journal of Physical Chemistry A 113, 11211–11220. doi:10.1021/jp9050353.
- Toublanc et al. (1995) Toublanc, D., Parisot P., Brillet, J., Gautier, D., Raulin, F., McKay, C.P., 1995. Photochemical modelling of Titan’s atmosphere.
- Touvelle et al. (1987) Touvelle, M., Licea, J.L.M., Venugopalan, M., Mufioz Licea, J.L., Venugopalan, M., 1987. Plasma Chemical Synthesis. II. Effect of Wall Surface on the Synthesis of Ammonia. Plasma Chemistry and Plasma Processing 7, 101.
- Vigren et al. (2014) Vigren, E., Galand, M., Shebanits, O., Wahlund, J.E., Geppert, W.D., Lavvas, P., Vuitton, V., Yelle, R.V., 2014. Increasing positive ion number densities below the peak of ion-electron pair production in titan’s ionosphere. Astrophysical Journal 786. doi:10.1088/0004-637X/786/1/69.
- Vigren et al. (2015) Vigren, E., Galand, M., Yelle, R.V., Wellbrock, A., Coates, A.J., Snowden, D., Cui, J., Lavvas, P., Edberg, N.J., Shebanits, O., Wahlund, J.E., Vuitton, V., Mandt, K., 2015. Ionization balance in Titan’s nightside ionosphere. Icarus 248, 539–546. doi:10.1016/j.icarus.2014.11.012.
- Vuitton et al. (2006) Vuitton, V., Yelle, R.V., Anicich, V.G., 2006. The Nitrogen Chemistry of Titan’s Upper Atmosphere Revealed. The Astrophysical Journal 647, L175–L178. URL: http://iopscience.iop.org/article/10.1086/507467, doi:10.1086/507467.
- Vuitton et al. (2008) Vuitton, V., Yelle, R.V., Cui, J., 2008. Formation and distribution of benzene on Titan. Journal of Geophysical Research E: Planets 113, 1–18. doi:10.1029/2007JE002997.
- Vuitton et al. (2019) Vuitton, V., Yelle, R.V., Klippenstein, S.J., Hörst, S.M., Lavvas, P., 2019. Simulating the density of organic species in the atmosphere of Titan with a coupled ion-neutral photochemical model. Icarus 324, 120–197. URL: https://doi.org/10.1016/j.icarus.2018.06.013, doi:10.1016/j.icarus.2018.06.013.
- Vuitton et al. (2007) Vuitton, V., Yelle, R.V., McEwan, M.J., 2007. Ion chemistry and N-containing molecules in Titan’s upper atmosphere. Icarus 191, 722–742. doi:10.1016/j.icarus.2007.06.023.
- Waite et al. (2004a) Waite, J.H., Lewis, W.S., Kasprzak, W.T., Anicich, V.G., Block, B.P., Cravens, T.E., Fletcher, G.G., Ip, W.H., Luhmann, J.G., Mcnutt, R.L., Niemann, H.B., Parejko, J.K., Richards, J.E., Thorpe, R.L., Walter, E.M., Yelle, R.V., 2004a. The Cassini Ion and Neutral Mass Spectrometer (INMS) investigation 114, 113–231. doi:10.1007/s11214-004-1408-2.
- Waite et al. (2004b) Waite, J.H., Lewis, W.S., Kasprzak, W.T., Anicich, V.G., Block, B.P., Cravens, T.E., Fletcher, G.G., Luhmann, J.G., Mcnutt, R.L., Niemann, H.B., Parejko, J.K., Richards, J.E., Thorpe, R.L., Walter, E.M., Yelle, R.V., 2004b. The Cassini Ion and Neutral Mass Spectrometer (INMS) Investigation. Space Science Reviews , 113–231.
- Waite et al. (2007) Waite, J.H., Young, D., Cravens, T.E., Coates, A.J., Crary, F.J., Magee, B., Westlake, J., 2007. The Process of Tholin Formation in Titan’s Upper Atmosphere. Science 870. doi:10.1126/science.1139727.
- Wang and Olthoff (1999) Wang, Y., Olthoff, J.K., 1999. Ion energy distributions in inductively coupled radio-frequency discharges in argon, nitrogen, oxygen, chlorine, and their mixtures. Journal of Applied Physics 85, 6358. URL: http://link.aip.org/link/JAPIAU/v85/i9/p6358/s1{&}Agg=doi, doi:10.1063/1.370138.
- Wattieaux et al. (2015) Wattieaux, G., Carrasco, N., Henault, M., Boufendi, L., Cernogora, G., 2015. Transient phenomena during dust formation in a N <sub>2</sub> –CH <sub>4</sub> capacitively coupled plasma. Plasma Sources Science and Technology 24, 015028. URL: http://stacks.iop.org/0963-0252/24/i=1/a=015028?key=crossref.c0350fef26eea5c69b4714e0fbc95b20, doi:10.1088/0963-0252/24/1/015028.
- Westlake et al. (2011) Westlake, J.H., Bell, J.M., Jr, J.H.W., Johnson, R.E., Luhmann, J.G., Mandt, K.E., Magee, B.A., Rymer, A.M., 2011. Titan’s thermospheric response to various plasma environments 116, 1–12. doi:10.1029/2010JA016251.
- Westlake et al. (2014) Westlake, J.H., Waite, J.H., Carrasco, N., Richard, M., Cravens, T., 2014. The role of ion-molecule reactions in the growth of heavy ions in Titan’s ionosphere. Journal of Geophysical Research: Space Physics 119, 5951–5963. doi:10.1002/2014JA020208.
- Westlake et al. (2012) Westlake, J.H., Waite, J.H., Mandt, K.E., Carrasco, N., Bell, J.M., Magee, B.A., Wahlund, J.E., 2012. Titan’s ionospheric composition and structure: Photochemical modeling of Cassini INMS data. Journal of Geophysical Research E: Planets 117, 1–21. doi:10.1029/2011JE003883.
- Yelle et al. (2010) Yelle, R.V., Vuitton, V., Lavvas, P., Klippenstein, S.J., Smith, M.a., Hörst, S.M., Cui, J., 2010. Formation of NH3 and CH2NH in Titan’s upper atmosphere. Faraday Discussions 147, 31. URL: http://xlink.rsc.org/?DOI=c004787m, doi:10.1039/c004787m.
- Yung (1987) Yung, Y.L., 1987. An update of nitrile photochemistry on Titan. Icarus 72, 468–472. doi:10.1016/0019-1035(87)90186-2.
- Yung et al. (1984) Yung, Y.L., Allen, M., Pinto, J., 1984. Photochemistry of the atmosphere of Titan: Comparison between model and observations. The Astrophysical Journal 212, 465–506.