Low-frequency spin qubit detuning noise in highly purified 28Si/SiGe
Abstract
The manipulation fidelity of a single electron qubit gate-confined in a 28Si/SiGe quantum dot has recently been drastically improved by nuclear isotope purification. Here, we identify the dominant source for low-frequency qubit detuning noise in a device with an embedded nanomagnet, a remaining 29Si concentration of only 60 ppm in the strained 28Si quantum well layer and a spin echo decay time s. The power spectral density (PSD) of the charge noise explains both the observed transition of a - to a -dependence of the detuning noise PSD as well as the observation of a decreasing time-ensemble spin dephasing time from s with increasing measurement time over several hours. Despite their strong hyperfine contact interaction, the few 73Ge nuclei overlapping with the quantum dot in the barrier do not limit , as their dynamics is frozen on a few hours measurement scale. We conclude that charge noise and the design of the gradient magnetic field is the key to further improve the qubit fidelity.
Gate-defined quantum dots (QDs) are a promising platform to confine and control single spins, which can be exploited as quantum bits (qubits) Zwanenburg et al. (2013). Unlike charge, a single spin does not couple directly to electric noise. Dephasing is dominated by magnetic noise, typically from the nuclear spin bath overlapping with the QD Assali et al. (2011). The use of silicon as a qubit host material boosted the control of individual spins by minimizing this magnetic noise: in addition to the intrinsically low hyperfine interaction in natural silicon, the existence of nuclear spin-free silicon isotopes, e.g. 28Si, allows isotopical enrichment in crystals Abrosimov et al. (2017); Itoh and Watanabe (2014). Controlling individual electrons and spins in highly enriched 28Si quantum structures Wild et al. (2012); Muhonen et al. (2014); Veldhorst et al. (2014); Lawrie et al. (shed) then opens the door to an attractive spin qubit platform realized in a crystalline nuclear spin vacuum. Indeed, two-qubit gates Veldhorst et al. (2015); Zajac et al. (2018); Watson et al. (2018) have recently been demonstrated in natural and enriched quantum films, while isotopical purification of 28Si down to 800 ppm of residual nuclear spin-carrying 29Si allowed to push manipulation fidelities beyond 99.9% for a single qubit Yoneda et al. (2018); Yang et al. (2019) and towards 98% for two qubits Huang et al. (2019). Qubit manipulation of individual spins is currently either realized with local AC magnetic fields generated by a stripline to drive Rabi transitions Koppens et al. (2006); Muhonen et al. (2014); Veldhorst et al. (2014) or via artificial spin-orbit coupling engineered by a micromagnet integrated into the device. This latter approach is advantageous by allowing the control of spin qubits solely by local AC electric fields Pioro-Ladrière et al. (2008); Yoneda et al. (2018); Watson et al. (2018); Zajac et al. (2018), permitting excellent local control and faster Rabi frequencies. At the same time it opens a new dephasing channel for electric noise, due to the static longitudinal gradient magnetic field of the micromagnet, competing with the magnetic noise. To fully exploit the potential of magnetic noise minimization through isotope enrichment in 28Si/SiGe, two experimental questions thus become relevant for devices with integrated static magnetic field gradients: Firstly, to what extent electronic noise impacts the spin qubit dephasing compared to magnetic noise Zhao et al. (shed) and, secondly, which role the natural SiGe potential wall barriers play for dephasing, since the hyperfine interaction of bulk Ge exceeds the one of bulk Si by a factor of approximatively 100 Wilson (1964); Witzel, Rahman, and Carroll (2012).
Here, we present an electron spin qubit implemented in a highly isotopically purified 28Si/SiGe device, with only 60 ppm of residual 29Si, which includes a magnetic field gradient generated by a nanomagnet integrated into the electron-confining device plane. We use Ramsey fringe experiments to investigate the detuning noise spectrum of the single electron spin down to 10-5 Hz. We find the frequency dependence of the qubit detuning spectrum to be identical to the spectrum of the device’s electric charge noise over more than 8 decades. At low frequencies, below Hz, both noise spectra decrease with . Above, they transit to a dependence and finally present a behavior comparable to a deviceYoneda et al. (2018) featuring a micromagnet and 800 ppm 29Si at higher frequencies, as deduced from a Hahn-echo sequence for the detuning, yielding . Electric noise thus dominates our qubit dephasing in a broad frequency range. It is also responsible for the observed decrease of with increasing measurement timeDial et al. (2013). Interestingly, although we show the 73Ge in the quantum well-defining natural SiGe to represent a potential limitation for our device, our experiments suggest the nuclear spin bath to be frozen on a time scale of hours and to much less contribute to than expected at the ergodic limit.
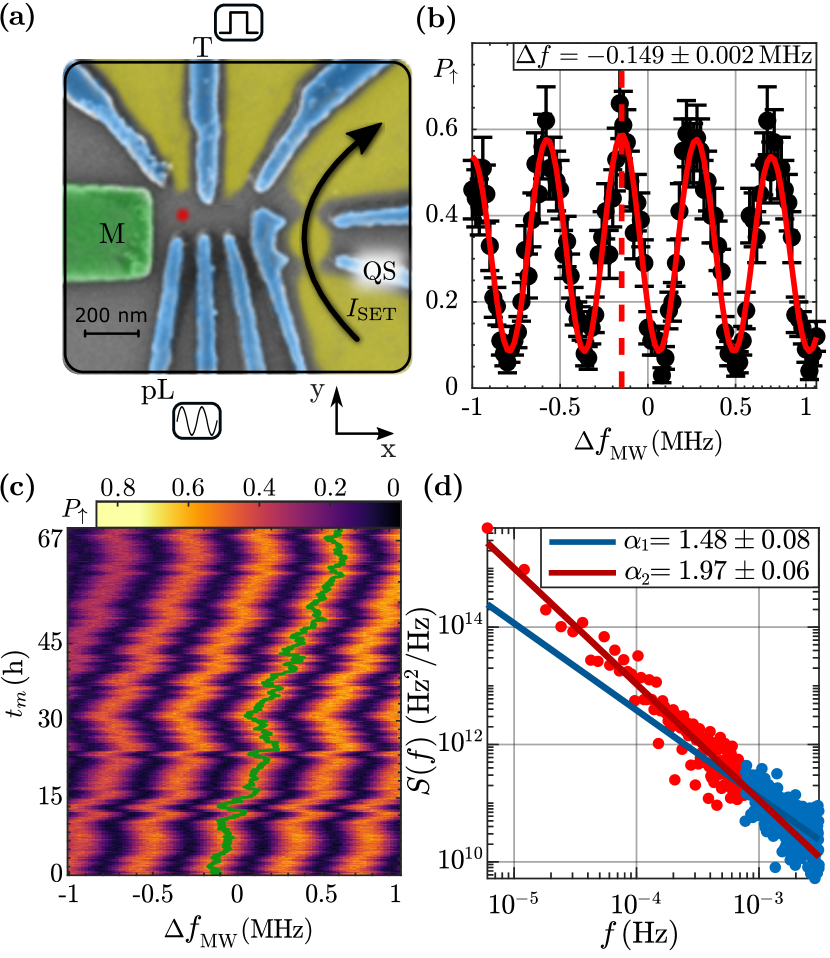
The device used for all measurements consists of an undoped 28Si/SiGe heterostructure confining a two dimensional electron gas in 28Si with 60 ppm of residual 29Si. Metal gates are used to form a quantum dot (QD) containing a single electron (Fig. 1(a)) . The charge state of the QD is detected via a single electron transistor (SET) located at the right-hand side of the device. The large gate labeled M on the left-hand side is a single domain Co nanomagnet. Its stray-magnetic field provides a magnetic field gradient Petersen et al. (2013) for spin driving by electric dipole spin resonance (EDSR). For details of the device see the supplements and Ref. Hollmann et al. (shed). We apply an external magnetic field of 668 mT along the -direction.
First, we focus on the PSD of the frequency detuning of the qubit with respect to a reference frequency of GHz. is determined by a Ramsey fringe measurement, during which the microwave pulses are detuned from the reference by (Fig. 1(b)). We vary from to MHz in 100 steps. Each point of the spin-up probability is an average over 100 single-shot measurements. One Ramsey fringe, which is one measurement of , takes 120 s. We fit by applying the formula for the fringe pattern Lu et al. (2011):
rCl
&P_↑(f_R,t_e,Δf,t_π2) = 4 fR2Φ2 ⋅sin(πt_π2 Φ)^2 ⋅
[ cos(πΔf t_e) ⋅cos( πt_π2 Φ)
- ΔfΦ ⋅sin(πΔf t_e)
⋅sin( πt_π2 Φ) ]^2
where , is the evolution time between the two gates and is the execution time of the gate.
Fig. 1(c) displays Ramsey fringes recorded during a measurement time period of 67 hours. The green line tracks during the full time period. We calculated the PSD of the qubit detuning with Welch’s method (Fig. 1(d)). For frequencies below Hz, we find a dependence. It transitions into a region with smaller exponent, here fitted with (blue line in Fig. 1(d)). Note that spin qubits in GaAs which dephase dominantly due to hyperfine interactionHanson et al. (2007); Cywiński, Witzel, and Das Sarma (2009); Cywiński (2011) are also characterized by a dependence in their low-frequency detuning noise PSD, which has been assigned to nuclear spin diffusion there.Reilly et al. (2008); Malinowski et al. (2017)
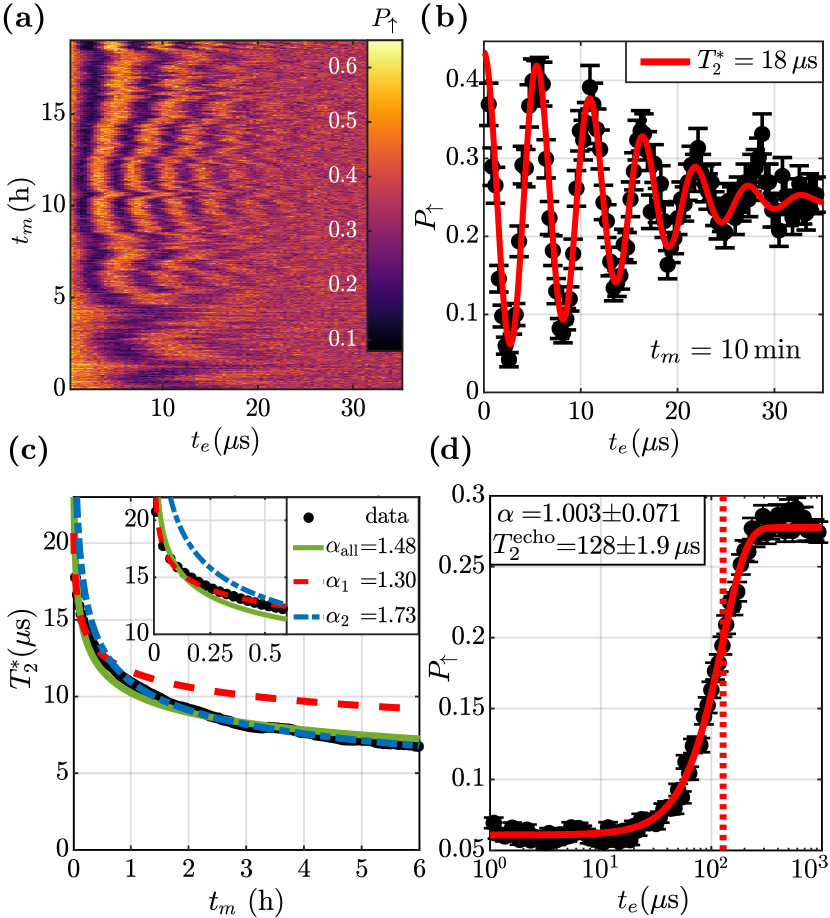
Having analyzed the qubit detuning noise in the low-frequency regime, we now investigate its impact on the time-ensemble spin dephasing time . We recorded during a series of Ramsey sequences with varying (Fig. 2(a)) in every line. For each , we average as many consecutive lines of this dataset as required to reach a total measurement time . The averaged was then fitted with
| (1) |
where and are constants related to the qubit initialization and readout fidelity. An example of measured over min is shown in Fig. 2(b). We extract mins. To achieve better statistics, this procedure was executed consecutively for different bundles of lines. We chose to offset the bundles by 25 lines giving overlap between them. This results in each value being averaged from values using different line bundles from the dataset displayed in Fig. 2(a) and a second dataset not shown here. Fig. 2(c) shows these averaged for ranging between 38 seconds and 6.3 hours. Remarkably, drops monotonously with increasing measurement time without saturating for long , qualitatively matching the qubit detuning noise PSD , which keeps increasing towards low frequencies (Fig. 1(d)). In a rough approximation, considering detuning noise of the type with , induced by detuning noise is (see Supplement Notes 1):
| (2) |
Fitting with only one (green solid line) shows clear deviation from the data points (Fig. 2(c)). Motivated by the variation of in , we fit two separate ranges of above and below (that is Hz, which is very close to the transition point Hz found in Fig. 1(d)), which are characterized by (red dashed curve) and (blue dashed curve), and are in good qualitative agreement with and found for the detuning noise in Fig. 1(d). The quantitative deviation of both () determined by the compared to the ones directly fit to the PSD results from the fact that the measurement integrates over the PSD from to .
Our spin-detection bandwidth in the Ramsey fringe experiment sets a limit on the maximum frequency of in Fig. 1(d). To gain information on at a higher frequency, we performed a Hahn-echo experiment, that is extended the Ramsey control sequence by a gate between the two gates, in order to filter out low frequency noise. The measured data (Fig. 2(d)) has been fitted with
| (3) |
We find and s. We can deduce that at a frequency of approximately kHz, in line with the observations in a device with an on-chip micromagnet and 800 ppm residual 29Si for Hz Yoneda et al. (2018). With the low-frequency PSD (Fig. 1(d)) and these spin echo results we conclude that the initial dependence observed at low frequencies transits to a dependence around Hz to Hz. With the detection bandwidth limit set by the Ramsey fringe experiment at approximately Hz, we observe this gradual transition, explaining found in Fig. 1(d). Remarkably, we find a 28 % higher compared to the device with an on-chip micromagnet and 800 ppm residual 29Si Yoneda et al. (2018), indicating that overall the detuning noise is lower in our sample in this regime.
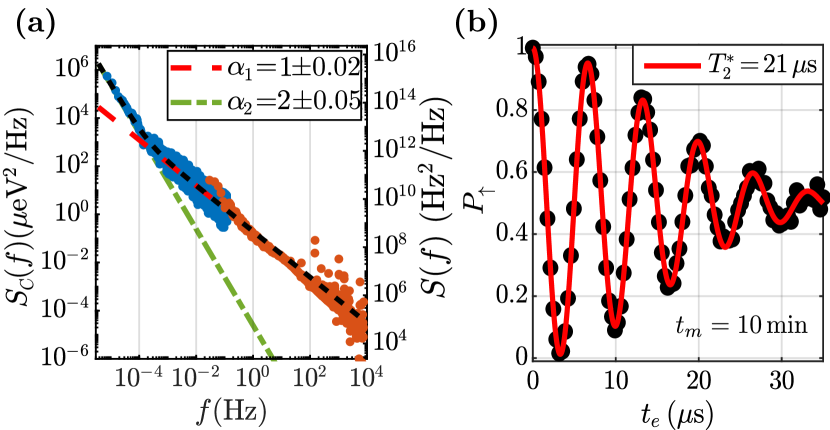
In order to investigate the impact of charge noise, we measured the charge noise in the qubit vicinity via the current noise of the SET sensor. This current noise is translated into gate equivalent voltage-noise by the variation of the SET current by the voltage applied to the SET gate QS (see Fig. 1(a)). We measured the current noise at a highly sensitive operation point of the SET and subtracted from its PSD the noise spectrum measured when the SET was set to be insensitive to charge noise from the device, in order to remove noise originating from the measurement circuitTakeda et al. (2013). Fig. 3(a) shows the measured PSD of the SET noise. As the data reveals two slopes, we fitted with . The fitted exponents of the spectrum are and , respectively, the transition being at about Hz. This frequency dependence is in very good agreement with the one observed for the qubit detuning PSD in Fig. 1(d) and with the qualitative trend extended to high frequencies with the Hahn-echo experiment. Making the comparison more quantitative, we assume the charge noise at the SET to be similar to the one of the QD and the longitudinal gradient magnetic field to be isotropic for lateral QD displacements. Using the current noise trace , the resulting frequency detuning is
| (4) |
where mV/pA is the inverse of the current change through the SET induced by a change of the voltage on the gate. nm/mV is the estimated displacement of the QD induced by voltage changes on the adjacent gates according to an electrostatic device simulation. mT/nm is the simulated isotropic longitudinal gradient magnetic field at the QD position. The factor , containing the electron g-factor (), the Bohr magneton and the reduced Planck constant , converts magnetic field to frequency. We convert the charge noise PSD into qubit detuning noise by Eq. 4 (right y-axis in Fig. 3(a)). The low-frequency part of the PSD (blue dots in Fig. 3(a)), shows excellent agreement with the qubit detuning noise PSD in its frequency dependence and its magnitude. In order to also include the high frequency range (red dots in Fig. 3(a)) into the comparison, we simulated the spin-up probability after a Ramsey gate sequence at time with evolution time using
| (5) |
and include quasi-static noise during the free evolution time from the full PSD in Fig. 3(a). The simulated data points (black dots in Fig. 3(b)) yield s, which is very close to the experimentally determined value s found in Fig. 2(b). In summary, comparing data covering more than 8 frequency decades, the excellent agreement demonstrates that charge noise dominates the qubit detuning noise in our device and transits from a dependence to a dependence around Hz.
To complete our analysis of the detuning noise and the time-ensemble spin dephasing time , we estimate the magnetic noise impact due to the residual non-zero spin nuclei in our device. We can compute the resulting with (see Supplementary Note 2)
| (6) |
where is the number of nuclei, is the fraction of nulcei with finite nuclear spin, is the volume fraction of the wavefunction for which we want to calculate the infuence on , i.e. localized in the barrier or the quantum well. is the hyperfine coupling constant per nucleus and is the non-zero nuclear spin. In Ref. Hollmann et al. (shed), we measured the orbital splitting of this QD to be 2.5 meV. Assuming a harmonic potential, we calculate the size of the QD, taken to be the full-width-at-half-maximum of the ground state wavefunction. This yields a radius of nm. By approximating the QD as a cylinder with height 6 nm we estimate the number of atoms in the QD volume to be . From Schrödinger-Poisson simulations, we estimate the overlap with the SiGe barriers to be . We calculate the number of non-zero nuclear spins, which are relevant for the hyperfine coupling with the qubit (i.e. are within the the cylindrical volume assigned to the QD), for the residual 60 ppm 29Si in the 28Si strained QW layer, residual 29Si and 73Ge in the SiGe barriers with natural abundance of isotopes as, respectively:
| (7) | ||||
| (8) | ||||
| (9) |
The coupling constants are eV and Wilson (1964); Witzel, Rahman, and Carroll (2012), respectively, with , . Assuming the spin baths to be in the ergodic limit, each subset of nuclear spin results in the following dephasing times: , and .
Notably, due to the strong hyperfine coupling of the 73Ge in the barrier layers, the 73Ge alone would dephase the qubit faster than observed in the experiment shown in Fig. 2(c). This apparent contradiction is resolved, if the correlation time of the 73Ge nuclear spin bath is larger than a few hours and thus the ergodic limit is not reached in our measurement.
In conclusion, we have shown that in a highly purified 28Si/SiGe qubit device with 60 ppm residual 29Si, the 73Ge nuclear spins in the potential barrier do not dominantly contribute to the qubit dephasing time, despite their strong hyperfine coupling. We find the dynamics of the nuclear spin bath to be slower than 6 hours, similarly to observations for electrons bound to single phosphorus donors in 800 ppm residual 29Si in the presence of the electron’s Knight shift Mądzik et al. (shed). Thus, the improvement potential of qubit dephasing times that can be expected from isotopical purification of the natural SiGe barrier is negligibly weak. In our device featuring a nanomagnet integrated into the gate layout for EDSR manipulation, charge noise is the dominant qubit noise source in a frequency range of more than 8 decades. In the low frequency regime, the charge and the qubit detuning noise present a dependence below Hz. Above, towards higher frequencies, both PSD transit to a dependence. This trend was recently also observed in a device featuring a micromagnet and 800 ppm 29Si Yoneda et al. (2018). From the Hahn-echo experiment for our qubit detuning, we additionally deduce a remarkably high s. We finally show to clearly and monotonously decrease for measurement times increasing from seconds to several hours, in accordance with the absence of a roll-off in the charge noise PSD down to at least Hz. Our experimental s for s quantitatively results from the charge noise eV/, which falls within the range of 0.3 to 2 eV/ seen in literature Freeman, Schoenfield, and Jiang (2016); Connors et al. (shed); Petit et al. (2018); Mi, Kohler, and Petta (2018). While the on-chip integration of a micro- or nanomagnet does not induce additional magnetic noise Neumann and Schreiber (2015); Yoneda et al. (2018), minimizing the newly opened electric dephasing channel seems to be key for further significant improvement of spin qubit gate fidelities in highly purified 28Si compared to devices avoiding integrated static magnetic field gradientsThorgrimsson et al. (2017); Huang et al. (2019); Yang et al. (2019); Andrews et al. (2019).
See supplementary material for details of the measurement cycle, simulations of the nanomagnet and derivations for the time in the ergodic limit and its dependence on measurement time.
This work has been funded by the German Research Foundation (DFG) within the projects BO 3140/4-1, 289786932 and the cluster of excellence "Matter and light for quantum computing" (ML4Q) as well as by the Federal Ministry of Education and Research under Contract No. FKZ: 13N14778. Project Si-QuBus received funding from the QuantERA ERA-NET Cofund in Quantum Technologies implemented within the European Union’s Horizon 2020 Programme.
References
- Zwanenburg et al. (2013) F. A. Zwanenburg, A. S. Dzurak, A. Morello, M. Y. Simmons, L. C. L. Hollenberg, G. Klimeck, S. Rogge, S. N. Coppersmith, and M. A. Eriksson, Rev. Mod. Phys. 85, 961 (2013).
- Assali et al. (2011) L. V. C. Assali, H. M. Petrilli, R. B. Capaz, B. Koiller, X. Hu, and S. Das Sarma, Phys. Rev. B 83, 165301 (2011).
- Abrosimov et al. (2017) N. V. Abrosimov, D. G. Aref’ev, P. Becker, H. Bettin, A. D. Bulanov, M. F. Churbanov, S. V. Filimonov, V. A. Gavva, O. N. Godisov, A. V. Gusev, T. V. Kotereva, D. Nietzold, M. Peters, A. M. Potapov, H.-J. Pohl, A. Pramann, H. Riemann, P.-T. Scheel, R. Stosch, S. Wundrack, and S. Zakel, Metrologia 54, 599 (2017).
- Itoh and Watanabe (2014) K. M. Itoh and H. Watanabe, MRS Commun. 4, 143 (2014).
- Wild et al. (2012) A. Wild, J. Kierig, J. Sailer, J. W. Ager, E. E. Haller, G. Abstreiter, S. Ludwig, and D. Bougeard, Appl. Phys. Lett. 100, 143110 (2012).
- Muhonen et al. (2014) J. T. Muhonen, J. P. Dehollain, A. Laucht, F. E. Hudson, R. Kalra, T. Sekiguchi, K. M. Itoh, D. N. Jamieson, J. C. McCallum, A. S. Dzurak, and A. Morello, Nat. Nanotechnol. 9, 986 (2014).
- Veldhorst et al. (2014) M. Veldhorst, J. C. C. Hwang, C. H. Yang, A. W. Leenstra, B. de Ronde, J. P. Dehollain, J. T. Muhonen, F. E. Hudson, K. M. Itoh, A. Morello, and A. S. Dzurak, Nat. Nanotechnol. 9, 981 (2014).
- Lawrie et al. (shed) W. I. L. Lawrie, H. G. J. Eenink, N. W. Hendrickx, J. M. Boter, L. Petit, S. V. Amitonov, M. Lodari, B. Paquelet Wuetz, C. Volk, S. Philips, G. Droulers, N. Kalhor, F. van Riggelen, D. Brousse, A. Sammak, L. M. K. Vandersypen, G. Scappucci, and M. Veldhorst, arXiv , 1909.06575 (unpublished).
- Veldhorst et al. (2015) M. Veldhorst, C. H. Yang, J. C. C. Hwang, W. Huang, J. P. Dehollain, J. T. Muhonen, S. Simmons, A. Laucht, F. E. Hudson, K. M. Itoh, A. Morello, and A. S. Dzurak, Nature 526, 410 (2015).
- Zajac et al. (2018) D. M. Zajac, A. J. Sigillito, M. Russ, F. Borjans, J. M. Taylor, G. Burkard, and J. R. Petta, Science 359, 439 (2018).
- Watson et al. (2018) T. F. Watson, S. G. J. Philips, E. Kawakami, D. R. Ward, P. Scarlino, M. Veldhorst, D. E. Savage, M. G. Lagally, M. Friesen, S. N. Coppersmith, M. A. Eriksson, and L. M. K. Vandersypen, Nature 555, 633 (2018).
- Yoneda et al. (2018) J. Yoneda, K. Takeda, T. Otsuka, T. Nakajima, M. R. Delbecq, G. Allison, T. Honda, T. Kodera, S. Oda, Y. Hoshi, N. Usami, K. M. Itoh, and S. Tarucha, Nat. Nanotechnol. 13, 102 (2018).
- Yang et al. (2019) C. H. Yang, K. W. Chan, R. Harper, W. Huang, T. Evans, J. C. C. Hwang, B. Bensen, A. Laucht, T. Tanttu, H. F. E., S. T. Flammia, K. M. Itoh, A. Morello, S. D. Bertlett, and A. S. Dzurak, Nat. Electronics 2, 151 (2019).
- Huang et al. (2019) W. Huang, C. H. Yang, K. W. Chan, T. Tanttu, B. Hensen, R. C. C. Leon, M. A. Fogarty, J. C. C. Hwang, F. E. Hudson, K. M. Itoh, A. Morello, A. Laucht, and A. S. Dzurak, Nature 569, 532 (2019).
- Koppens et al. (2006) F. H. L. Koppens, C. Buizert, K. J. Tielrooij, I. T. Vink, K. C. Nowack, T. Meunier, L. P. Kouwenhoven, and L. M. K. Vandersypen, Nature 442, 766 (2006).
- Pioro-Ladrière et al. (2008) M. Pioro-Ladrière, T. Obata, Y. Tokura, Y.-S. Shin, T. Kubo, K. Yoshida, T. Taniyama, and S. Tarucha, Nat. Phys. 4, 776 (2008).
- Zhao et al. (shed) R. Zhao, T. Tanttu, K. Y. Tan, B. Hensen, K. W. Chan, J. C. C. Hwang, R. C. C. Leon, C. H. Yang, W. Gilbert, F. E. Hudson, K. M. Itoh, A. A. Kiselev, T. D. Ladd, A. Morello, A. Laucht, and A. S. Dzurak, arXiv , 1812.08347 (unpublished).
- Wilson (1964) D. K. Wilson, Phys. Rev. 134, A265 (1964).
- Witzel, Rahman, and Carroll (2012) W. M. Witzel, R. Rahman, and M. S. Carroll, Phys. Rev. B 85, 205312 (2012).
- Dial et al. (2013) O. E. Dial, M. D. Shulman, S. P. Harvey, H. Bluhm, V. Umansky, and A. Yacoby, Phys. Rev. Lett. 110, 146804 (2013).
- Petersen et al. (2013) G. Petersen, E. A. Hoffmann, D. Schuh, W. Wegscheider, G. Giedke, and S. Ludwig, Phys. Rev. Lett. 110, 177602 (2013).
- Hollmann et al. (shed) A. Hollmann, T. Struck, V. Langrock, A. Schmidbauer, F. Schauer, K. Sawano, H. Riemann, N. V. Abrosimov, D. Bougeard, and L. R. Schreiber, arXiv , 1907.04146 (unpublished).
- Lu et al. (2011) J. Lu, F. Hoehne, A. R. Stegner, L. Dreher, M. Stutzmann, M. S. Brandt, and H. Huebl, Phys. Rev. B 83, 235201 (2011).
- Hanson et al. (2007) R. Hanson, L. P. Kouwenhoven, J. R. Petta, S. Tarucha, and L. M. K. Vandersypen, Rev. Mod. Phys. 79, 1217 (2007).
- Cywiński, Witzel, and Das Sarma (2009) Ł. Cywiński, W. M. Witzel, and S. Das Sarma, Phys. Rev. Lett. 102, 057601 (2009).
- Cywiński (2011) Ł. Cywiński, Acta Phys. Pol. A 119, 576 (2011).
- Reilly et al. (2008) D. J. Reilly, J. M. Taylor, E. A. Laird, J. R. Petta, C. M. Marcus, M. P. Hanson, and A. C. Gossard, Phys. Rev. Lett. 101, 236803 (2008).
- Malinowski et al. (2017) F. K. Malinowski, F. Martins, Ł. Cywiński, M. S. Rudner, P. D. Nissen, S. Fallahi, G. C. Gardner, M. J. Manfra, C. M. Marcus, and F. Kuemmeth, Phys. Rev. Lett. 118, 177702 (2017).
- Takeda et al. (2013) K. Takeda, T. Obata, Y. Fukuoka, W. M. Akhtar, J. Kamioka, T. Kodera, S. Oda, and S. Tarucha, Appl. Phys. Lett. 102, 123113 (2013).
- Mądzik et al. (shed) M. T. Mądzik, T. D. Ladd, F. E. Hudson, K. M. Itoh, A. M. Jakob, B. C. Johnson, D. N. Jamieson, J. C. McCallum, A. S. Dzurak, A. Laucht, and A. Morello, arXiv , 1907.11032 (unpublished).
- Freeman, Schoenfield, and Jiang (2016) B. M. Freeman, J. S. Schoenfield, and H. Jiang, Applied Physics Letters 108, 253108 (2016).
- Connors et al. (shed) E. J. Connors, J. Nelson, H. Qiao, L. F. Edge, and J. M. Nichol, arXiv , 1907.07549 (unpublished).
- Petit et al. (2018) L. Petit, J. M. Boter, H. G. J. Eenink, G. Droulers, M. L. V. Tagliaferri, R. Li, D. P. Franke, K. J. Singh, J. S. Clarke, R. N. Schouten, V. V. Dobrovitski, L. M. K. Vandersypen, and M. Veldhorst, Phys. Rev. Lett. 121, 076801 (2018).
- Mi, Kohler, and Petta (2018) X. Mi, S. Kohler, and J. R. Petta, Phys. Rev. B 98, 161404 (2018).
- Neumann and Schreiber (2015) R. Neumann and L. R. Schreiber, J. Appl. Phys. 117, 193903 (2015).
- Thorgrimsson et al. (2017) B. Thorgrimsson, D. Kim, Y.-C. Yang, L. W. Smith, C. B. Simmons, D. R. Ward, R. H. Foote, J. Corrigan, D. E. Savage, M. G. Lagally, M. Friesen, S. N. Coppersmith, and M. A. Eriksson, npj Quantum Information 3, 32 (2017).
- Andrews et al. (2019) R. W. Andrews, C. Jones, D. M. Reed, A. M. Jones, S. D. Ha, M. P. Jura, J. Kerckhoff, M. Levendorf, S. Meenehand, S. T. Merkel, A. Smith, B. Sun, A. J. Weinstein, M. T. Rakher, T. D. Ladd, and M. G. Borselli, Nat. Nanotechnol. 14, 747 (2019).