X-ray Observations of a Quasar/Galaxy Merger
Abstract
Quasars at early redshifts () with companion galaxies offer unique insights into the growth and evolution of the first supermassive black holes. Here, we report on a 150 ks Chandra observation of PSO J308.041621.2339, a quasar with a merging companion galaxy identified in [C II] and rest-frame UV emission. With net counts, we find that PSO J308.041621.2339 is powerful ( in rest-frame keV) yet soft (spectral power-law index and optical-to-X-ray slope ). In addition, we detect three hard-energy photons to the west of the main quasar, cospatial with the brightest UV emission of the merging companion. As no soft-energy photons are detected in the same area, this is potentially indicative of a highly-obscured source. With conservative assumptions, and accounting for both background fluctuations and the extended wings of the quasar’s emission, these photons only have a probability of happening by chance. If confirmed by deeper observations, this system is the first high redshift quasar and companion individually detected in X-rays and is likely a dual AGN.
2019 December 18
1 Introduction
In recent years, the number of known quasars seen in the first billion years of the universe () has exploded (e.g., Venemans et al., 2015; Bañados et al., 2016; Yang et al., 2019), allowing new insights (e.g., Eilers et al., 2017; Davies et al., 2019) into the populations of the earliest supermassive black holes (SMBHs). However, explaining the formation and initial evolution of these objects remains challenging (Smith & Bromm, 2019). To this end, X-ray observations of these quasars are critical, as they provide the best view of the inner regions of the Active Galactic Nucleus (AGN) powering the quasar emission (Fabian, 2016).
To date, most of the X-ray analyses of these quasars have focused on individual objects, and the current population of observed high-redshift quasars is both small and mostly only barely detected (Nanni et al., 2017; Vito et al., 2019b). Nevertheless, studies of individual quasars are still highly fruitful at characterizing mechanisms for early SMBH growth. For example, Bañados et al. (2018) showed that AGN are already X-ray luminous at , Vito et al. (2019a) identified a heavily obscured quasar candidate in a quasar/galaxy pair, and Nanni et al. (2018) found potential evidence of AGN variability and of jets from a quasar.
Of particular interest is PSO J308.041621.2339 (hereafter PJ 30821), a quasar at discovered by Bañados et al. (2016) and whose systemic redshift is accurately measured from the [C II] emission of its host galaxy (Decarli et al., 2018). With shallow (10 minutes on-source) Atacama Large Millimeter Array (ALMA) observations, Decarli et al. (2017) found that the quasar has a [C II]-bright companion. Follow-up deeper and higher-resolution observations with ALMA and the Hubble Space Telescope (HST) by Decarli et al. (2019) showed that the companion is visible on both sides of the quasar, spanning over (20 kpc), and its kinematics can be explained by a toy model of a satellite galaxy being tidally stripped as it passes close to the quasar host galaxy. This makes PJ 30821 one of the earliest galaxy mergers ever imaged (Decarli et al., 2019).
In this paper, we describe X-ray observations of PJ 30821 with Chandra, which are among the deepest X-ray observations of a quasar yet taken. One of the main objectives of our study was to see if the [C II]-bright companion could host a faint AGN; given that the first SMBHs likely grew through galaxy mergers, the chances of finding lower-luminosity AGN are enhanced around the most distant quasars (Reines & Comastri, 2016). We describe our observations in Section 2 and report the X-ray properties of the optically selected quasar in Section 3. In Section 4 we present a potential X-ray (heavily obscured) counterpart to the companion galaxy seen by ALMA and HST. Finally, in Section 5 we discuss our results and implications. We use a flat cosmology with , , and . We assume a Galactic absorption column density toward PJ 30821 of (Kalberla et al., 2005). We adopt a quasar redshift of ; at this redshift, the scale is . Errors are reported at the 1 (68%) confidence level unless otherwise stated. Upper limits correspond to limits.
2 Observations and Data Reduction
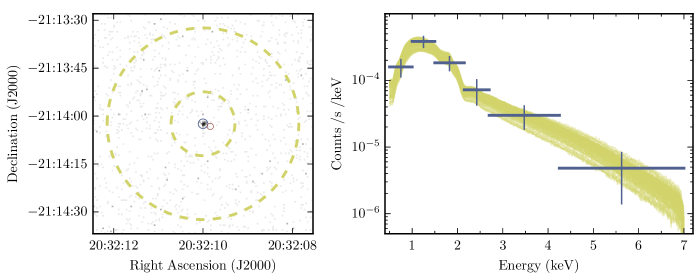
We observed PJ 30821 with the the Advanced CCD Imaging Spectrometer (ACIS; Garmire et al., 2003) on Chandra for a total of 150.92 ks as part of Sequence Number 703573. Observations were distributed across three visits: on 2018 August 27 (44.48 ks, Obs ID: 20470), 2018 August 29 (73.37 ks, Obs ID: 21725), and 2018 August 30 (33.07 ks, Obs ID: 21726). The detection image is shown in Figure 1. This is the second-deepest Chandra observation of a quasar (Nanni et al., 2018) and third-deepest observation of this high-redshift population with either Chandra or XMM-Newton (Page et al. 2014 and Moretti et al. 2014; see Vito et al. 2019b and Pons et al. 2019 for a full list). Observations were conducted with the Very Faint telemetry format and the Timed Exposure mode, and Chandra was pointed so that PJ 30821 fell on the ACIS-S3 chip. We analyzed these data using CIAO version 4.11 (Fruscione et al., 2006) and CALDB version 4.8.2. We used the ACIS standard filters for event grades (0, 2, 3, 4, and 6) and good time intervals. Observations were reduced with chandra_repro with the parameter check_vf_pha=yes to reduce the quiescent background.
Observations were combined using the merge_obs routine to create images in the broad (0.5–7.0 keV) energy band for spatial analysis. The quasar is shown in the left panel of Figure 1. For spectral analysis, we used specextract to extract a source spectrum from keV ( keV in the quasar rest-frame) within a circular region of radius and a background from an annular region of inner radius and width , both centered on PJ 30821. We detect background-subtracted net counts from the source in the 0.5-7.0 keV spectral range. Spectral analysis was conducted using XSPEC v12.9.1p (Arnaud, 1996) via the pyXspec utility. Due to the relatively low number of counts for Gaussian analysis (see, e.g., Arzner et al. 2007 and Humphrey et al. 2009 for further discussion), we did not bin our spectra, and used the modified C-statistic (Cash, 1979; Wachter et al., 1979) to determine the best-fitting parameters. The quasar spectrum was modeled as a power law with Galactic dust absorption, using the xspec models phabspowerlaw, and with rest-frame dust absorption included, using the models zphabsphabspowerlaw. The binned spectrum is shown in Figure 1.
3 Properties of PJ 30821
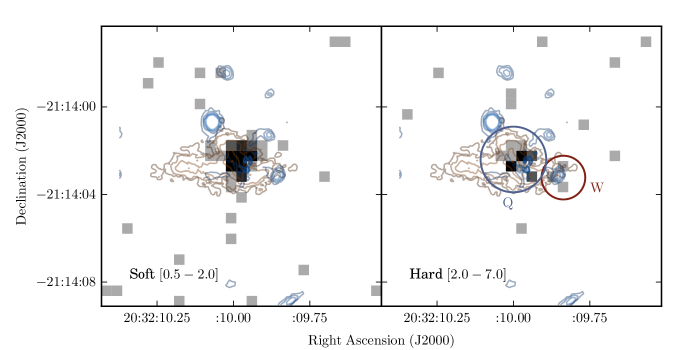
We first quantified the X-ray hardness ratio111, where and are the net counts in the hard (2.0–7.0 keV) and soft (0.5–2.0 keV) bands, respectively. using the Bayesian techniques described by Park et al. (2006). We assumed uniform (Jeffreys) priors and integrated the posterior distribution with Gaussian quadrature. The hardness ratio of PJ 30821 is across the observed 0.5–2.0 keV and 2.0–7.0 keV bands. The quasar spectrum is fairly soft, in agreement with broader population trends reported by Nanni et al. (2017). Soft- and hard-band images of PJ 30821 are shown in Figure 2.
From the best-fit of the quasar spectrum, we find that the power-law index and the luminosity from 2.0 to 10.0 keV (rest-frame) is . Errors were computed by evaluating the Cash statistic, , across the distribution of model parameters for powerlaw; uncertainties on include all values where offsets from the best-fitting Cash statistic (two free parameters, e.g., Lampton et al., 1976). For , model luminosities were computed for every set of parameters, and the reported uncertainties include all models with . As a cross-check, we also produced 100 fake spectra using the XSPEC fakeit command drawn from a Monte Carlo sampling of the spectral fit; these are shown in Figure 1.
We also consider the case where there is absorption at the redshift of the quasar. To do this, we modeled the emission with the xspec models phabszphabspowerlaw. Here, phabs is left to the Galactic value, but zphabs is set to redshift with absorbing column density allowed to vary. With three free parameters, the errors include all values with . For this model, we find , and . Unsurprisingly, is not well constrained, as in the high rest-frame energies we probe, variations in the spectral shape are minimal for column densities of . As including the extra term provides no meaningful constraints, and since the presence of broad lines in the optical spectrum implies a column density of – which our spectrum is not sensitive to – we hereafter only consider the results when zphabs is not included.
Finally, we consider the X-ray-to-optical power-law slope, defined as
| (1) |
where and are the monochromatic luminosities at rest-frame 2 keV and 2500Å, respectively. We compute from the previously reported value of (Bañados et al., 2016); to make this conversion, we assume that flux in this spectral region scales as and adopt , the value used to compute by Bañados et al. (2016). We find .
To provide further context for the properties of PJ 30821, we also report here measurements of the quasar’s black hole mass and Eddington ratio, taken from an upcoming analysis of high-redshift quasars (Farina et al. and Schindler et al. in preparation); these results come from single-epoch virial estimators derived using the Mg II line detected in the near-infrared spectrum. They find a black hole mass of and an Eddington ratio of , where the statistical uncertainties are dwarfed by the roughly systematic uncertainties on both quantities inherent in this technique (Onken et al., 2004; Vestergaard & Peterson, 2006).
4 Potential Companions
One reason PJ 30821 was observed was to look for X-ray counterparts to the companion first observed by Decarli et al. (2017) and later by Decarli et al. (2019). In Figure 2 we show the area around PJ 30821 in the soft- and hard-energy bands, with the [C II] emission contours and HST rest-frame UV contours from Decarli et al. (2019) overplotted. While there does not appear to be any structure to the east of the quasar, three closely spaced hard X-ray photons were detected just to the west of PJ 30821, coincident with a bright knot of stellar light observed by HST. These photons align with the outer extent of the [C II] emission and have no corresponding soft-band photons, highly suggestive of a heavily obscured quasar. Below, we discuss these results.
First, however, we quantify the astrometric alignment between these Chandra observations and the previous HST and ALMA observations. Using WAVDETECT (Freeman et al., 2002), we identify the positions of sources in our broadband image. Comparing these positions with the Guide Star Catalog v2.3 (Lasker et al., 2008) using wcs_match, the average residual is , which is the size of ACIS pixels. Likewise, we compare the measured centroid of PJ 30821 to the ALMA coordinates reported by Decarli et al. (2017). Again, we find an offset of . As can be seen in Figure 2, even if our astrometry is off by , a shift of this level will not produce a significant effect on the results discussed below.
We therefore begin our analysis with the three photons to the west. To estimate the probability that these photons arise solely from the background, we use binomial statistics to calculate probabilities, as described by Weisskopf et al. (2007) and Lansbury et al. (2014). We counted three photons within a standard aperture in the traditional ACIS hard-energy range ( keV, e.g., Evans et al., 2010); we also extracted a background centered on our target in the same annulus used for spectroscopic analysis, finding 380 counts in the aperture. We find the probability of these sources arising from the background alone to be . Similarly, we randomly placed 10,000 radius apertures in the vicinity of PJ 30821, excluding the closest to the quasar, and counted the number of apertures that have at least three hard X-ray counts; from this, we estimate the probability of three counts in this small of an aperture to be .
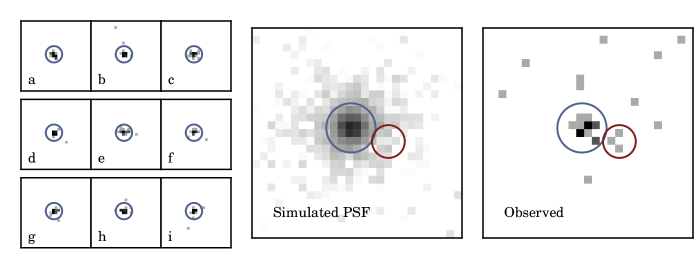
Of course, the emission can also be influenced by the presence of the nearby X-ray bright source, PJ 30821. In all three observations, PJ 30821 was observed almost on-axis, such that the expected point-spread function (PSF) should be small. To better understand the expected behavior of the Chandra PSF, we simulated 1000 observations of a monochromatic 4 keV point source located at the position of PJ 30821 using the Chandra Ray Tracer (ChaRT). These simulations provide tens of thousands of simulated photons to quantify the odds of a given photon appearing in the western region. The ChaRT output was in turn processed by marx v 5.4.0 (Davis et al., 2012) to generate synthetic PSF images. Nine of these images, which have been capped to only show the same number of counts as seen for PJ 30821 and the candidate western companion, are shown in Figure 3, as is the full combination of all 1000 simulations. As shown in that figure, the three counts do not normally arise from the PSF; the expectation is for the PSF to only contribute 0.108 counts to the site of the potential companion, based on the flux in the inner . Combining the effects of the PSF and the background, the probability of these three counts appearing by chance is still only .
It should be noted that we have adopted several conservative restrictions, and that by relaxing these the statistical significance could be increased – notably a more restricted energy range. Additionally, a fourth hard-energy photon in the companion aperture was excised through the choice to set check_vf_pha=yes in the original reprocessing. Use of this mode is cautioned, as it may reject real events near bright sources222See http://cxc.harvard.edu/ciao/why/aciscleanvf.html#real_events. However, even with these conservative choices, these photons can only be explained by a random fluctuation with probability , and this detection is coincident not only with the blue-shifted [C II] emission reported by Decarli et al. (2019) but also with the brightest knot of starlight identified in that work in HST imaging.
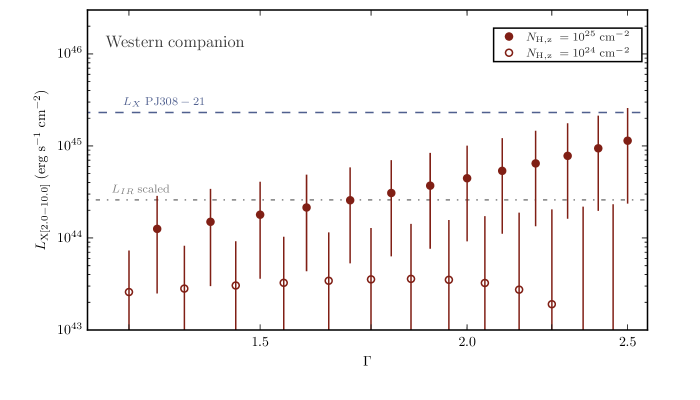
To place limits on the potential companion, we fit the observed keV spectrum with XSPEC, using a phabszphabspowerlaw model. We fixed the redshift and Galactic , and evaluated the model for a series of fixed values of and redshifted column density, . The corresponding unobscured rest-frame keV luminosities that best fit the potential companion are shown in Figure 4. In addition, we also mark the observed luminosity for PJ 30821 and a predicted luminosity for the companion in the simplistic case that X-ray and IR luminosities are proportional. The fits show that if these photons are produced by a quasar, it must be some combination of highly shrouded, low-luminosity, or soft. We also note that, as we did not detect any photons from 0.5 to 7.0 keV for the eastern companion, any potential X-ray source associated with that region must be even fainter.
5 Discussion
While the average value of the X-ray spectral power-law index, , for quasars is (Nanni et al., 2017), we found the spectrum of PJ 30821 was best fit with a softer value, , which is one of the softest values for quasars yet found (only considering those with reasonable constraints; Vito et al., 2019b). A number of recent works have found a correlation between and the Eddington ratio (e.g., Shemmer et al. 2008, Brightman et al. 2013, Brightman et al. 2016; this is not without some controversy though, e.g., Trakhtenbrot et al. 2017, Wang et al. 2019). Similarly, simulations (e.g., Hopkins et al., 2006) predict that major mergers drive high accretion rates in AGN. Therefore, since this system is actively merging (Decarli et al., 2019) and accreting above the Eddington limit, the high value of might be expected.
We also report on a potential detection of the gas-rich companion as a heavily obscured X-ray source. While only three counts are observed in hard X-rays, they are coincident with the extended [C II] emission and the brightest rest-frame UV knot reported by Decarli et al. (2019). Recently, Circosta et al. (2019) showed that the host galaxies of AGN can provide significant levels of obscuration; from the toy model for this system presented by Decarli et al. (2019), we expect to be looking through the edge-on leading edge of the companion galaxy. Adopting the simple model that the entire gas mass reported by Decarli et al. (2019) for the western companion is composed of hydrogen, and adopting the Circosta et al. (2019) toy model that all the gas is in a uniform-density sphere of half-mass radius , then the total column density to a source at the center of this sphere is . We note both that the gas mass was measured over a larger radius than 1 kpc and that it is clearly non-uniform in density, so that this column density is at best an order-of-magnitude estimate, or even an upper limit. Nevertheless, the observed gas mass could, depending on its structure and orientation, potentially contribute to the column density needed to to explain the lack of observed soft X-ray photons.
It is also worth considering PJ 30821 in the context of PSOJ16713 (). Both quasars have [C II] bright companions (Decarli et al., 2017; Willott et al., 2017) reminiscent of ongoing mergers, and these are the only systems at redshifts with companions detected in [C II] and in rest-frame UV (Decarli et al., 2019; Mazzucchelli et al., 2019; Neeleman et al., 2019). While here we report that PJ 30821 is X-ray luminous and its companion may host a heavily obscured X-ray source, in an analysis of PSOJ16713 () Vito et al. (2019a) reported a detection of only one source, which also appears to be heavily obscured. That these two quasars beyond have both rest-frame UV-bright companions and heavily obscured quasar candidates may be consistent with the prediction of Circosta et al. (2019), that the host’s interstellar medium is capable of producing significant column densities of around high-redshift quasars.
The results presented here required 150 ks of observations with Chandra; despite this, the potentially detected companion can only be ruled out as a fluctuation to probability . This work, as well as that of Vito et al. (2019a), Bañados et al. (2018), and Nanni et al. (2018), pushes the current generation of X-ray telescopes to their limits. Future missions with high resolution and/or improved collecting areas, such as Lynx (Gaskin et al., 2019), AXIS (Mushotzky et al., 2019), and Athena (Nandra et al., 2013), will be necessary to advance our understanding of the earliest quasars.
References
- Arnaud (1996) Arnaud, K. A. 1996, in Astronomical Society of the Pacific Conference Series, Vol. 101, Astronomical Data Analysis Software and Systems V, ed. G. H. Jacoby & J. Barnes, 17
- Arzner et al. (2007) Arzner, K., Güdel, M., Briggs, K., et al. 2007, A&A, 468, 501
- Bañados et al. (2016) Bañados, E., Venemans, B. P., Decarli, R., et al. 2016, ApJS, 227, 11
- Bañados et al. (2018) Bañados, E., Connor, T., Stern, D., et al. 2018, ApJ, 856, L25
- Brightman et al. (2013) Brightman, M., Silverman, J. D., Mainieri, V., et al. 2013, MNRAS, 433, 2485
- Brightman et al. (2016) Brightman, M., Masini, A., Ballantyne, D. R., et al. 2016, ApJ, 826, 93
- Cash (1979) Cash, W. 1979, ApJ, 228, 939
- Circosta et al. (2019) Circosta, C., Vignali, C., Gilli, R., et al. 2019, A&A, 623, A172
- Davies et al. (2019) Davies, F. B., Hennawi, J. F., & Eilers, A.-C. 2019, ApJ, 884, L19
- Davis et al. (2012) Davis, J. E., Bautz, M. W., Dewey, D., et al. 2012, Proc. SPIE, 8443, 84431A
- Decarli et al. (2017) Decarli, R., Walter, F., Venemans, B. P., et al. 2017, Nature, 545, 457
- Decarli et al. (2018) Decarli, R., Walter, F., Venemans, B. P., et al. 2018, ApJ, 854, 97
- Decarli et al. (2019) Decarli, R., Dotti, M., Bañados, E., et al. 2019, ApJ, 880, 157
- Eilers et al. (2017) Eilers, A.-C., Davies, F. B., Hennawi, J. F., et al. 2017, ApJ, 840, 24
- Evans et al. (2010) Evans, I. N., Primini, F. A., Glotfelty, K. J., et al. 2010, ApJS, 189, 37
- Fabian (2016) Fabian, A. C. 2016, AN, 337, 375
- Freeman et al. (2002) Freeman, P. E., Kashyap, V., Rosner, R., & Lamb, D. Q. 2002, ApJS, 138, 185
- Fruscione et al. (2006) Fruscione, A., McDowell, J. C., Allen, G. E., et al. 2006, Proc. SPIE, 6270, 62701V
- Garmire et al. (2003) Garmire, G. P., Bautz, M. W., Ford, P. G., Nousek, J. A., & Ricker, Jr., G. R. 2003, Proc. SPIE, 4851, 28
- Gaskin et al. (2019) Gaskin, J. A., Swartz, D. A., Vikhlinin, A., et al. 2019, JATIS, 5, 021001
- Hopkins et al. (2006) Hopkins, P. F., Hernquist, L., Cox, T. J., et al. 2006, ApJS, 163, 1
- Humphrey et al. (2009) Humphrey, P. J., Liu, W., & Buote, D. A. 2009, ApJ, 693, 822
- Kalberla et al. (2005) Kalberla, P. M. W., Burton, W. B., Hartmann, D., et al. 2005, A&A, 440, 775
- Lampton et al. (1976) Lampton, M., Margon, B., & Bowyer, S. 1976, ApJ, 208, 177
- Lansbury et al. (2014) Lansbury, G. B., Alexander, D. M., Del Moro, A., et al. 2014, ApJ, 785, 17
- Lasker et al. (2008) Lasker, B. M., Lattanzi, M. G., McLean, B. J., et al. 2008, AJ, 136, 735
- Mazzucchelli et al. (2019) Mazzucchelli, C., Decarli, R., Farina, E. P., et al. 2019, ApJ, 881, 163
- Moretti et al. (2014) Moretti, A., Ballo, L., Braito, V., et al. 2014, A&A, 563, A46
- Mushotzky et al. (2019) Mushotzky, R. F., Aird, J., Barger, A. J., et al. 2019, arXiv e-prints, arXiv:1903.04083
- Nandra et al. (2013) Nandra, K., Barret, D., Barcons, X., et al. 2013, arXiv e-prints, arXiv:1306.2307
- Nanni et al. (2017) Nanni, R., Vignali, C., Gilli, R., Moretti, A., & Brandt, W. N. 2017, A&A, 603, A128
- Nanni et al. (2018) Nanni, R., Gilli, R., Vignali, C., et al. 2018, A&A, 614, A121
- Neeleman et al. (2019) Neeleman, M., Bañados, E., Walter, F., et al. 2019, ApJ, 882, 10
- Onken et al. (2004) Onken, C. A., Ferrarese, L., Merritt, D., et al. 2004, ApJ, 615, 645
- Page et al. (2014) Page, M. J., Simpson, C., Mortlock, D. J., et al. 2014, MNRAS, 440, L91
- Park et al. (2006) Park, T., Kashyap, V. L., Siemiginowska, A., et al. 2006, ApJ, 652, 610
- Pons et al. (2019) Pons, E., McMahon, R. G., Banerji, M., & Reed, S. L. 2019, arXiv e-prints, arXiv:1910.04122
- Reines & Comastri (2016) Reines, A. E., & Comastri, A. 2016, PASA, 33, e054
- Shemmer et al. (2008) Shemmer, O., Brandt, W. N., Netzer, H., Maiolino, R., & Kaspi, S. 2008, ApJ, 682, 81
- Smith & Bromm (2019) Smith, A., & Bromm, V. 2019, ConPh, 60, 111
- Trakhtenbrot et al. (2017) Trakhtenbrot, B., Ricci, C., Koss, M. J., et al. 2017, MNRAS, 470, 800
- Venemans et al. (2015) Venemans, B. P., Bañados, E., Decarli, R., et al. 2015, ApJ, 801, L11
- Vestergaard & Peterson (2006) Vestergaard, M., & Peterson, B. M. 2006, ApJ, 641, 689
- Vito et al. (2019a) Vito, F., Brandt, W. N., Bauer, F. E., et al. 2019a, A&A, 628, L6
- Vito et al. (2019b) Vito, F., Brandt, W. N., Bauer, F. E., et al. 2019b, A&A, 630, A118
- Wachter et al. (1979) Wachter, K., Leach, R., & Kellogg, E. 1979, ApJ, 230, 274
- Wang et al. (2019) Wang, C., Yu, L.-M., Bian, W.-H., & Zhao, B.-X. 2019, MNRAS, 487, 2463
- Weisskopf et al. (2007) Weisskopf, M. C., Wu, K., Trimble, V., et al. 2007, ApJ, 657, 1026
- Willott et al. (2017) Willott, C. J., Bergeron, J., & Omont, A. 2017, ApJ, 850, 108
- Yang et al. (2019) Yang, J., Wang, F., Fan, X., et al. 2019, AJ, 157, 236