2 mm GISMO Observations of the Galactic Center.
II. A Nonthermal Filament in the Radio Arc and Compact Sources111Based on observations carried out with the IRAM 30 m Telescope.
IRAM is supported by INSU/CNRS (France), MPG (Germany) and IGN (Spain).
Abstract
We have used the Goddard IRAM 2-Millimeter Observer (GISMO) with the 30 m IRAM telescope to carry out a 2 mm survey of the Galaxy’s central molecular zone (CMZ). These observations detect thermal emission from cold ISM dust, thermal free-free emission from ionized gas, and nonthermal synchrotron emission from relatively flat-spectrum sources. Archival data sets spanning m to 90 cm are used to distinguish different emission mechanisms. After the thermal emission of dust is modeled and subtracted, the remaining 2 mm emission is dominated by free-free emission, with the exception of the brightest nonthermal filament (NTF) that runs though the middle of the bundle of filaments known as the Radio Arc. This is the shortest wavelength at which any NTF has been detected. The GISMO observations clearly trace this NTF over a length of , with a mean 2 mm spectral index which is steeper than at longer wavelengths. The 2 mm to 6 cm (or 20 cm) spectral index steepens from to as a function distance from the Sickle H II region, suggesting that this region is directly related to the NTF. A number of unresolved (at ) 2 mm sources are found nearby. One appears to be thermal dust emission from a molecular cloud that is associated with an enigmatic radio point source whose connection to the Radio Arc is still debated. The morphology and colors at shorter IR wavelengths indicate other 2 mm unresolved sources are likely to be compact H II regions.
1 Introduction
Radio continuum observations have identified several systems of nonthermal (radio) filaments (NTFs, sometimes known as NRFs) as well as isolated individual filaments within the inner two degrees of the Galactic center, with the magnetic field aligned along the linear filaments (Yusef-Zadeh et al., 1984, 1997). A number of models have considered the origin of NTFs associated with molecular clouds or with mass-losing stars (e.g. Rosner & Bodo, 1996; Shore & LaRosa, 1999; Bicknell & Li, 2001). However, there is no consensus on the origin of the Galactic center filaments. Among the large number of known NTFs, a bundle of filaments near the Radio Arc at is unique in its physical interaction with the molecular cloud G0.13-0.13 (Tsuboi et al., 1997). In addition, these filaments are surrounded by ionized gas, and have an unusually flat spectrum for a nonthermal polarized source. Here we investigate the energy spectrum of the emission from the radio arc filaments by measuring its spectral index at a wavelength of 2 mm, thus providing additional constraint on possible mixture of thermal and nonthermal emission.
The 2 mm GISMO survey of the Galactic Center provides a unique view of thermal emission from cold dust in molecular clouds, and free-free emission from ionized gas in H II regions (Arendt et al., 2019, Paper I). It also shows emission from the single brightest NTF, which runs through the middle of a bundle of parallel NTFs known as the Radio Arc. While the large-scale Radio Arc at low angular resolution has been observed to have an inverted radio spectrum ( with ) at frequencies as high as 43 GHz (7 mm) (Reich et al., 1988), the smaller-scale structure has been reported to have a steep () spectrum between 32 and 43 GHz (or 7 to 9 mm) (Sofue et al., 1999). The bright NTF had been detected in interferometric observations at wavelengths as short as 3 mm Pound & Yusef-Zadeh (2018) and polarized emission has been detected from the entire Radio Arc at low resolution at 2 and 3 mm (Culverhouse et al., 2011). Most NTFs across the GC have relatively steep radio spectra (e.g. Law et al., 2008), and any emission at 2 mm or shorter wavelengths would be expected to be very faint and confused. The NTFs had not been detected at shorter wavelengths (e.g. 850 m and 1.1 mm), which made emission from these features somewhat unexpected at 2 mm as previously reported by Reich et al. (2000).
The 2 mm wavelength is a transition region in the spectrum of the general Galactic ISM and specific Galactic sources. The Rayleigh-Jeans tail of thermal emission from cold dust continues to fade from far-IR wavelengths into the 2 mm band, whereas optically thin free-free (thermal) radio sources are fading as wavelengths fall from the radio regime to the mm and sub-mm regime. Optically thin non-thermal sources typically fall much more quickly as a function of decreasing wavelength.
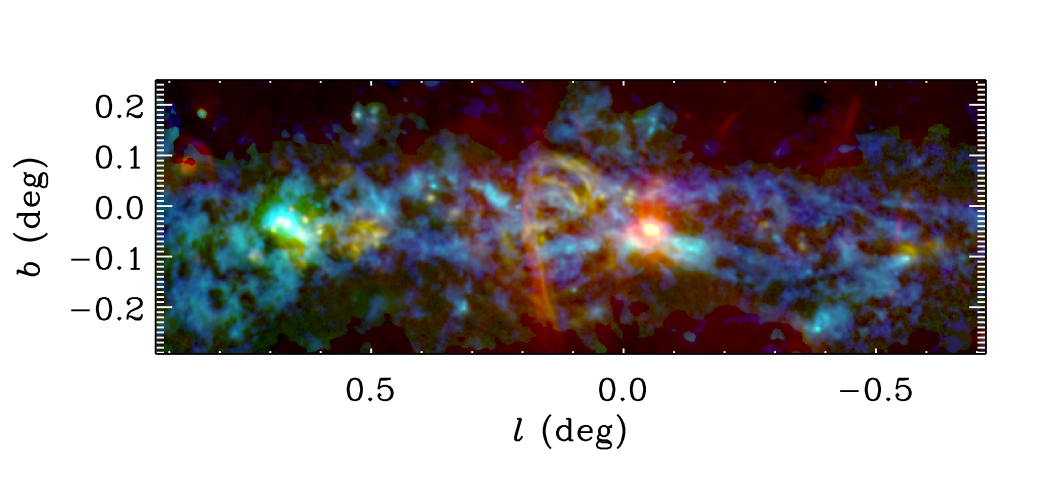
Figure 1 provides an overview of the 2 mm emission (green) in comparison with the 850 m thermal emission from dust (blue; Parsons et al., 2018) and 19.5 cm radio emission (red). Most molecular clouds are identified by cyan colors with dust emission extending from 850 m to 2 mm. Regions of radio emission with relatively flat spectral indices (free-free emission and flat non-thermal sources) exhibit yellow colors in this image.
In this paper, we employ a wide wavelength range of archival data sets to focus on the analysis of the emission from the brightest of the NTFs. We investigate if the 2 mm observation can provide further insight into the origin and nature of the NTFs, and their relation to other possibly nearby features. In particular, there is a radio point source of an uncertain nature that lies atop the NTF, at least in projection. We find 2 mm emission at the location of this source and compare the SED of this 2 mm point source with other nearby point-like 2 mm sources in order to understand the nature of this source.
2 Data
The GISMO instrument (Staguhn et al., 2006, 2008), paired with the 30 m IRAM telescope (Baars et al., 1987), was used to map a region at the Galactic Center at a wavelength of 2 mm. The beam size of GISMO observations at the 30 m telescope is FWHM. The observations were generally carried out under stable atmospheric conditions and with a zenith opacity of . Focus in z-direction was regularly monitored (several times a day) and pointing was frequently checked (about once per observing hour) using the nearby bright quasars J2037+511 and J1637+574. Fluxes were calibrated to accuracy by monitoring Mars and employing the atmospheric transmission model of the Caltech Submillimeter Observatory222http://www.submm.caltech.edu/cso/weather/atplot.shtml and the 30 m telescope 225 GHz radiometer readings. The data reduction and mosaicking, done with CRUSH (Kovács, 2008), yields an image with (FWHM) resolution.
Arendt et al. (2019) describe the characterization of the thermal dust emission in the image via the extrapolation of a modified blackbody spectrum based on 160 - 500 m Herschel PACS and SPIRE observations (Molinari et al., 2016). The Herschel data, convolved to resolution, were initially fit on a pixel-to-pixel basis to determine a mean dust temperature, a spectral index, , of the dust emissivity, , and a normalization (proportional to the mass). These fits occasionally produced spurious results, so a constrained model was applied in which the dust emissivity was characterized as , where the exponent was determined from the mean of the values found in the unconstrained fit. [See (Arendt et al., 2019) for details.] This modeling is used to subtract the thermal dust component from the 2 mm emission, leaving the free-free emission from regions of ionized gas, and non-thermal (synchrotron) emission from sources that combine relativistic electrons with strong magnetic fields.
Additional Galactic center maps used here are: 850 m SCUBA-2 observations from Parsons et al. (2018); 1.1 mm observations from the BOLOCAM Galactic Plane Survey (Ginsburg et al., 2013); Herschel PACS and SPIRE observations from the Hi-GAL survey (Molinari et al., 2016); and Spitzer IRAC and MIPS observations at 3.6 - 24 m (Stolovy et al., 2006; Yusef-Zadeh et al., 2009). VLA observations at 6 and 20 cm are from Yusef-Zadeh et al. (1984), Yusef-Zadeh & Morris (1987a, b), and Yusef-Zadeh et al. (2009). VLA observations at 90 cm are from LaRosa et al. (2000).
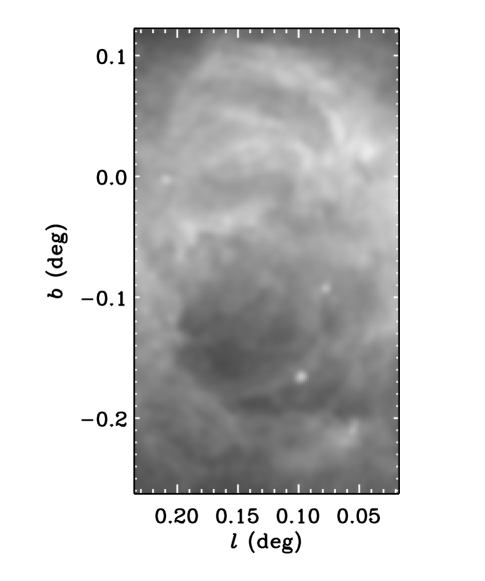
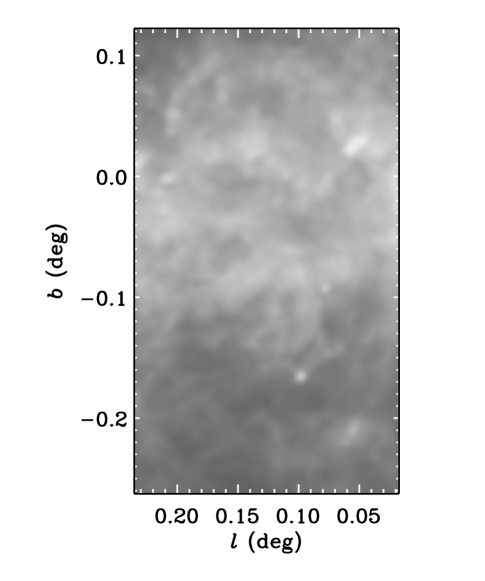
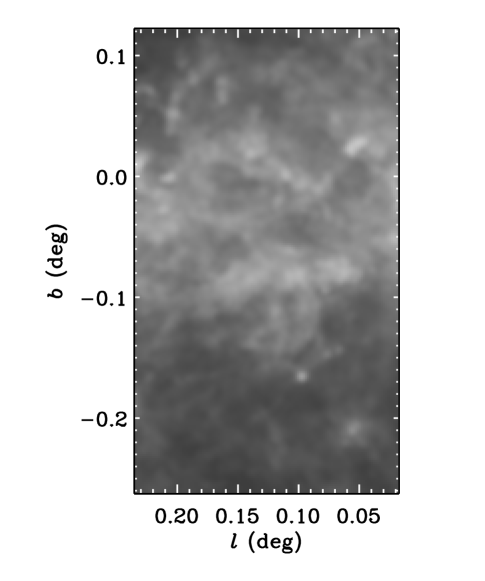
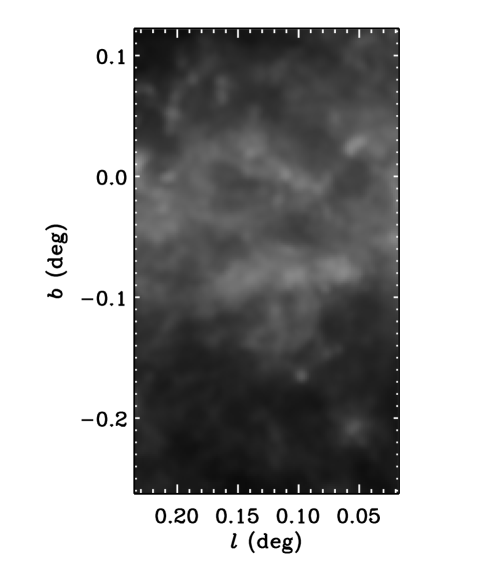
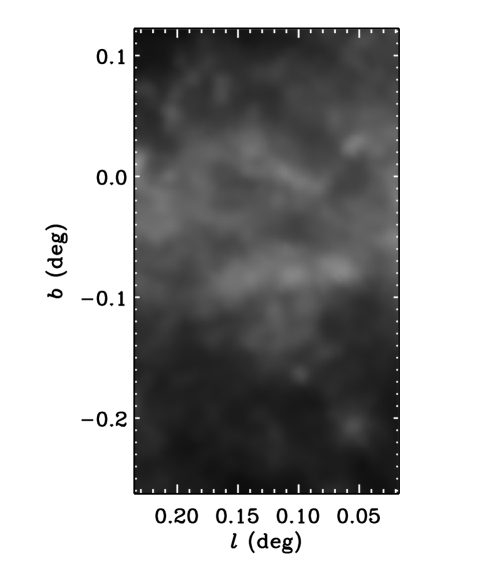
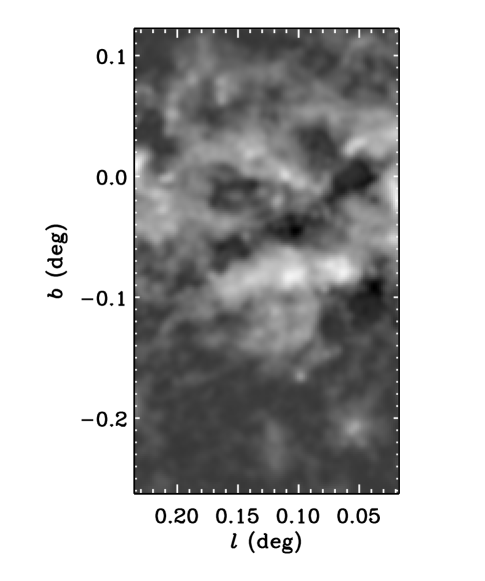
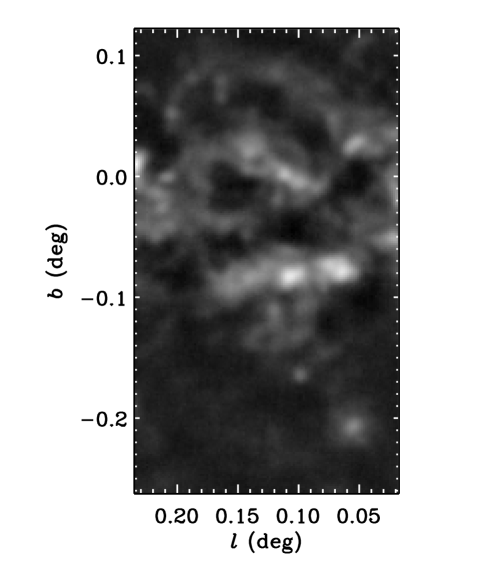
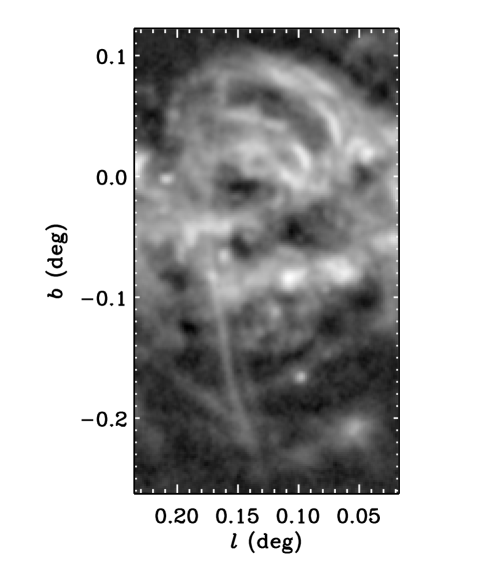
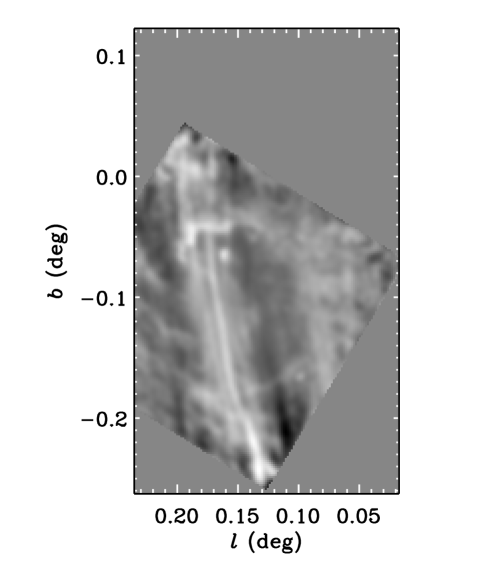
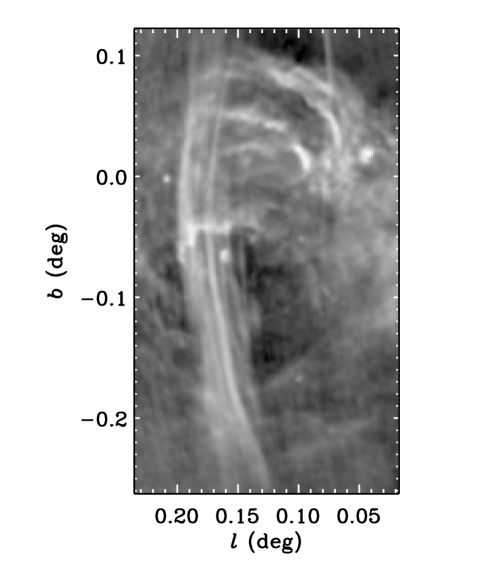
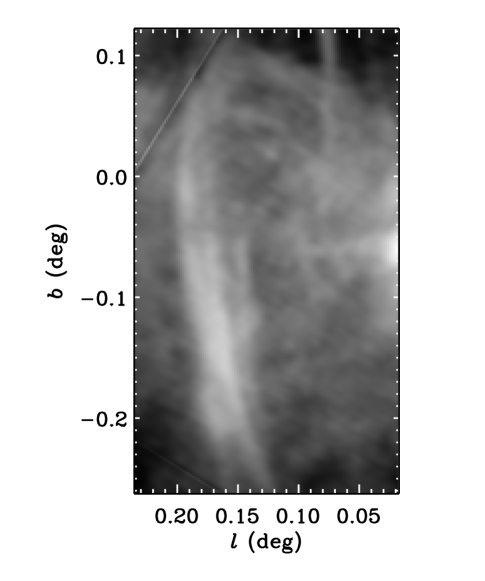
Figures 2 and 3 illustrate the emission from the region of the Radio Arc at wavelengths from 70 m to 2 mm. As wavelength increases, emission from warm dust becomes surpassed by emission from colder dust, which in turn begins to be exceeded by free-free emission at 2 mm. Figure 4 further illustrates emission at radio wavelengths from 6 to 90 cm. The primary beam correction (Napier & Rots, 1982) applied to the 6 cm image appears valid over the range , but may overcorrect in the corners of the image. The 6 cm image is largely dominated by free-free emission. This gradually becomes dominated by non-thermal emission as wavelengths increase to 90 cm. At 90 cm some of the free-free emission becomes optically thick, such as at the Sickle, , which is seen in absorption against the Radio Arc filaments (Anantharamaiah et al., 1991). However since our focus is on much shorter wavelengths, we assume that free-free emission is optically thin throughout the rest of this paper.
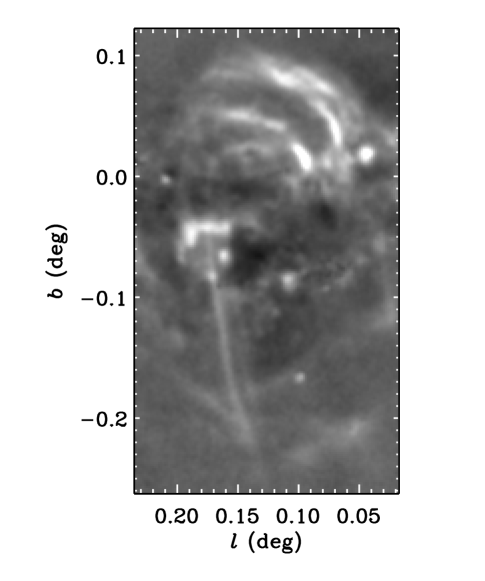
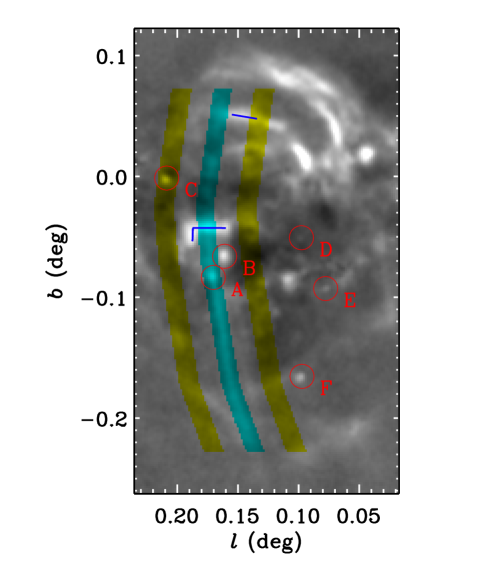
Figure 5 compares the 2 mm emission before and after the modeling and subtraction of the extrapolated dust emission. In the dust-subtracted image, the remaining features are much more clearly associated with radio emission features at cm. The third panel in the figure highlights the extended and point-like sources that are discussed in the following sections.


3 Analysis
3.1 The non-thermal filament
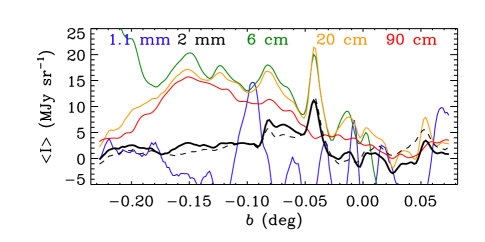
The first step in the analysis of the emission from the NTF is to extract the brightness profile along the filament. A 9-pixel () wide region is averaged at each latitude. A local background is subtracted by averaging 10-pixel () wide strips located 15 pixels () east and west of the center of the NTF. The backgrounds are taken at the same fixed latitudes as each point along the NTF. The separation places the background regions outside the main bundle of filaments in the Radio Arc. The mean intensity profiles at 2 mm (after dust emission removal), radio wavelengths, and 1.1 mm are shown in Figure 6. The main uncertainty in the measurement of the filament brightness is the subtraction of the background. The dashed line shows the 2 mm brightness profile using a background that is flat, averaged over all latitudes, and provides an indication of the amount of variation that may occur due to confusion. This comparison demonstrates that some of the apparent brightness changes in the filament may be caused by a mismatch in the brightness of the chosen background regions and the actual brightness underlying the corresponding location of the filament. The filament is not detected at 1.1 mm. The brightness profile at that wavelength shows variations that may be times larger than the brightness of the filament, if it is comparable to that at 2 mm.
The main region where the 2 mm emission of the NTF is bright and unconfused spans from , which is roughly from the southern edge of the Radio Arc Bubble (seen as a diameter ring centered at Levine et al., 1999; Rodríguez-Fernández et al., 2001; Simpson et al., 2007) to the N3 radio point source at (Yusef-Zadeh & Morris, 1987a; Ludovici et al., 2016) which is also coincident with the 2 mm source “A” indicated in Figure 5. To the north of this, between N3 and the Sickle (), the background becomes brighter and more complex, making it difficult to determine the truly appropriate background for the NTF. To the north of the Sickle, the NTF seems to fade and become confused with the bright thermal emission of the Arches. The apparent brightness of the filament in this region also seems to be diminished by the extrapolation and subtraction of the thermal emission from dust, even though the NTF is not identifiable in the far-IR emission.
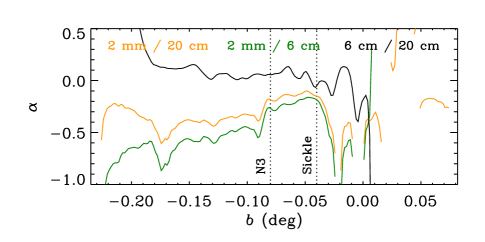
The resulting profiles of the spectral indices (, defined by ) are shown in Figure 6. In the relatively clean region, , the 2 mm spectral indices seem to show a slight steepening (become more negative) as a function of distance south from the Sickle (at ). The dip in the 2 mm spectral indices at may be an artifact of imperfect subtraction of dust emission from the bright molecular cloud that overlaps the NTF here (see Figure 5). The 6-20 cm spectral index lies in the range , which is consistent with the results found by Wang et al. (2002) in slices across the Radio Arc near N3. It also is similar to the spectral index measured in the northernmost () portion of the Radio Arc by Law et al. (2008), who note a steepening of the 6-20 cm spectral index with increasing distance from the Galactic plane.
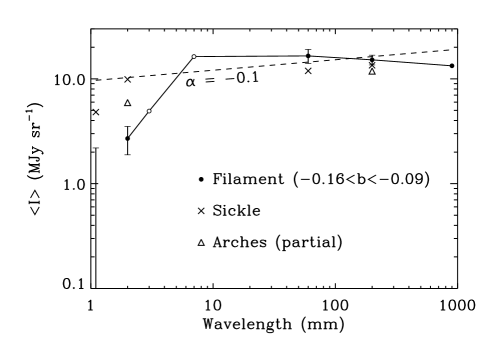
Figure 7 shows the SED averaged over the range. The 3 mm point is the interferometric measurement of Pound & Yusef-Zadeh (2018), which may be considered a lower limit. Sofue et al. (1992) do not reliably detect the NTF in 7 mm interferometric observations, but they quantify the clear detection in lower-resolution single-dish 7 mm observations (Sofue et al., 1986; Reich et al., 1988) at the level shown in the figure. There is a clear steepening of the spectrum at 2 and 3 mm relative to that at cm, such that the spectral index is at 2 - 3 mm. For comparison, we similarly extracted SEDs for known thermal sources: the Sickle and a portion of the Arches. In these cases, a surface brightness limit was used to define an aperture for each source, and a background was subtracted using the same aperture displaced to relatively faint regions north of the Sickle and north of the Arches segment, respectively. The 1.1 mm result for the NTF should be interpreted as an upper limit on the emission rather than a detection. The 6 cm image used here does not cover the Arches. At 90 cm, the Sickle is in absorption, and the Arches are too confused for a reliable brightness measurement in the chosen portion.
3.2 Compact sources
After subtraction of the extrapolated dust emission, a number of compact 2 mm sources remain in the region of the Radio Arc. Most notably, there is a source (“A” in Figure 5) which appears to lie on the NTF at the location of the radio source N3. The radio source N3 is very enigmatic, and its physical association with the Radio Arc is unclear. Ludovici et al. (2016) provide a detailed look at the source, ruling out several possible explanations, leaving a micro-blazar as the remaining best guess.
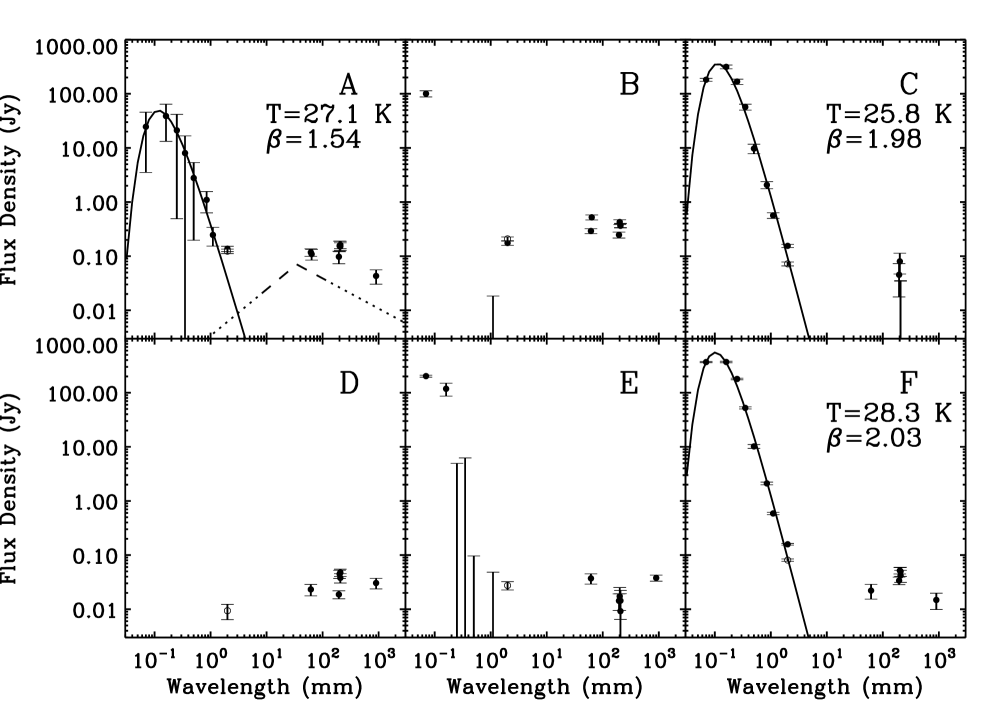
Here, we take a further look at the spectral properties of source A, in comparison to the other nearby compact 2 mm sources. The other nearby sources are simply the nearest 2 mm point-like sources, chosen as a comparison sample of sources that are likely to be typical compact sources. Strong similarity of source A to nearby sources would add weight to the argument that it is only coincidentally along the line of sight to the NTF. The sources indicated in Figure 5 and listed in Table 1 all appear compact ( FWHM) in the residual 2 mm image, and all appear as longer-wavelength radio sources as well. Figure 8 shows cut-out images of each of the sources as observed in the various 3.6 m – 90 cm data sets described in Section 2. Figure 9 displays the SEDs at far-IR to radio wavelengths using aperture photometry. A circular diameter aperture is used for the source, and a diameter annulus is used for the background at each wavelength. Uncertainties are calculated from standard propagation of errors assuming that the uncertainty for each pixel is given by the measured standard deviation of pixel intensities in the background annulus.
| Name | [deg] | [deg] | Other designation |
|---|---|---|---|
| A | 0.170 | -0.084 | N3 molecular cloud |
| B | 0.161 | -0.066 | Pistol Nebula |
| C | 0.209 | -0.001 | N2 |
| D | 0.098 | -0.051 | N1 |
| E | 0.078 | -0.093 | GPSR5 0.077-0.092 |
| F | 0.097 | -0.165 | GPSR5 0.099-0.165 & GPSR5 0.099-0.167 |

3.2.1 Source A
Source A is detected at 160 – 350 m in the far-IR Herschel data, and in the 450 and 850 m SCUBA-2 results presented by Parsons et al. (2018), and the 870 m LABOCA data of Schuller et al. (2009), though flux measurements are highly uncertain because of the relatively low angular resolution of the data and the complexity of the background and surrounding sources. The 2 mm flux density of source A, Jy, is a plausible extrapolation of the far-IR emission (Fig. 9). Radio emission from N3 is seen at 8 mm – 20 cm in Figure 8 and the work of Ludovici et al. (2016). At 90 cm, the resolution is too low and N3 is too faint to be distinguished. Ludovici et al. (2016) show that the radio spectrum of N3 breaks to a steep spectral index in the GHz ( mm) range. Thus the 2 mm flux density of Source A is more than an order of magnitude brighter than the extrapolated radio flux density of N3. The radio source N3 appears to be associated with a small molecular cloud (Tsuboi et al., 2011; Ludovici et al., 2016) that lies north (Galactic) of N3. Though the GISMO beam is larger than this separation, Source A is slightly better aligned with this cloud than N3. Cold dust in the molecular cloud would explain the far-IR emission, but for reasons unclear, the extrapolation of the far-IR emission is less effective at removing the 2 mm emission of this cloud than it is for the general ISM. Such a residual is unusual, but far from unique in the GC region. Experimentation with various alternate selections of the background suggest that residual emission of the superimposed NTF cannot contribute more than 50% of the flux density of source A.
There is no clear indication of source A at 1.25 – 70 m although there is a point source, 2MASS J17462113-2850023, which is offset by from the location of N3, and has very red colors at m, but is blue at m, which is consistent with typical foreground stars. Because the N3 radio source remains point-like at resolution (Ludovici et al., 2016), we believe it unlikely to be associated with this apparent foreground star.
3.2.2 Source B
The 2 mm source B is clearly associated with the brightest (eastern) parts of the Pistol Nebula. There is no shorter wavelength emission from this source until 70 m, where emission is centered closer to the Pistol Star itself. The entire Pistol Nebula is saturated at 24 m, but is clearly resolved at 8 m. The overall SED is consistent with ionized gas (free-free radio emission) and very warm dust (mid-IR emission) of material in the strong radiation fields of the Pistol Star and the Quintuplet Cluster (Moneti et al., 1999; Figer et al., 1999; Rodríguez-Fernández et al., 2001). The radiation and winds of these stars would be effective at clearing the region of any parental molecular cloud and associated far-IR emission (Rodríguez-Fernández et al., 2001; Simpson et al., 2007; Simpson, 2018).
3.2.3 Source C
At the location of source C, 3.6 - 24 m emission shows a red point source surrounded by diffuse emission and an adjacent IR dark cloud (IRDC). The blended point and diffuse source emission is saturated at 24 m, but the IRDC is still seen in absorption. In progressing from 70 m to 1 mm the centroid of the emission shifts from the point source to the IRDC. This far-IR emission can be fit by a modified blackbody with K and (Fig. 9), in agreement with results from Guzmán et al. (2015). At 2 mm - 20 cm the centroid is back at the location of the point source. The point source was investigated and rejected as a possible YSO, as the mid-IR spectrum did not show a 15 m CO2 ice feature with a 15.4 m shoulder (An et al., 2011). Yusef-Zadeh (1986) referred to the source as N2, and concluded it is a relatively compact H II region surrounding a massive star. A class II methanol maser is located in this region (e.g. Caswell, 1996; Yusef-Zadeh et al., 2009).
3.2.4 Source D
The 2 mm source D is associated with the radio source N1, referred to as an H II region by Lazio & Cordes (2008). Butterfield et al. (2018) note that the source is thermal, based on a P counterpart in the survey by Wang et al. (2010). There is a relatively faint red point source here at 3.6 - 8 m. It is saturated at 24 m, but not seen again until 2 mm - 20 cm. The full resolution 6 cm radio image indicates an offset of several arcseconds between the radio source and the mid-IR source. This is similar to the case of source C, but here there is no indication of associated diffuse emission.
3.2.5 Source E
The 2 mm source E appears as a fainter version of source C, having both point-like and diffuse components, and a generally similar SED.
3.2.6 Source F
Source F, though unresolved by GISMO, is actually 2 sources: a point source (GPSR5 0.099-0.165), and a small region of more diffuse emission (GPSR5 0.099-0.167). These are also identified as sources 19 and 21 in Downes et al. (1979). A weak H2O maser at at the location of source 19 suggests that this source may be closer than the Galactic center region (Guesten & Downes, 1983). Becker et al. (1994) associate these sources with IRAS 17432–2855, which has IR colors characteristic of an ultracompact H II region (UCHII). The diffuse emission source appears as a small bubble to the southeast of the point source at 5.8 and 8 m, cataloged as CN 3 by Churchwell et al. (2007). At 24 m and 6 cm (full resolution) the diffuse emission is more concentrated at the center of the bubble. The far-IR – mm emission is clear and seems associated with the point source, despite being blended at the angular resolution of the Herschel data. The emission can be fit by a modified blackbody with K and (Fig. 9). This source is notably bright at 1 mm. With increasing wavelength from 2 mm to 20 cm the centroid of the emission shifts from the location of the point source to the location of CN 3. An ISO SWS spectrum of the Radio Arc Bubble was taken near this location (Levine et al., 1999; Rodríguez-Fernández et al., 2001), but the ISO aperture does not include either of the sources, despite the stated association of this observation with GPSR5 0.099-0.167 by Giveon et al. (2002).
3.2.7 General
Pound & Yusef-Zadeh (2018) report 3 mm detections of sources C, E, and F (resolved into 2 sources) as compact or unresolved objects (resolution = ) with 3 mm flux densities that are similar to or lower than our 2 mm measurements. In contrast they report sources A (N3) and B (the Pistol Nebula) as extended sources and find flux densities that are times higher than our 2 mm measurements. Integration of the 2 mm GISMO map over the larger aperture used by Pound & Yusef-Zadeh (2018) does yield a substantially high flux density for source A (N3), though this includes some emission that is not clearly related to source A (e.g. part of the NTF) and more importantly requires a more distant and fainter region for background estimation which may not properly represent the background at N3.
The diffuse emission and far-IR properties suggest that sources C, E, and F are associated with star formation, and are likely a blend of hot dust and free-free emission surrounding a compact H II region and cold dust emission from surrounding molecular clouds. Source D would also be consistent with a compact H II region (ionized gas and hot dust) but shows no indication of emission from cold dust, suggesting a smaller (or no) remaining molecular cloud.
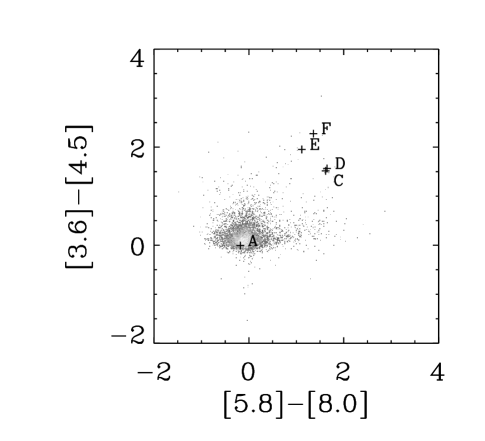
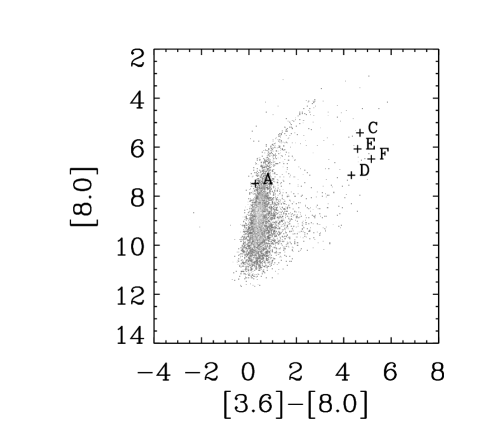
The color-color and color-magnitude diagrams for all sources within of source A in the GLIMPSE II Archive are shown in Figure 10. The locations of sources C and D in the IRAC color-color diagram are consistent with those of the UCHII regions studied by de La Fuente et al. (2009). Sources E and F have somewhat redder colors than the UCHII regions, but that could be an effect of stronger foreground reddening for lines of sight toward the Galactic Center. The more extended compact H II regions studied by Phillips & Ramos-Larios (2008) have bluer colors on average than the UCHII regions. The colors of sources C, D, E, and F are also consistent with those of candidate YSOs (e.g. Ramírez et al., 2008). The colors of 2MASS J17462113-2850023 (marked as A) which lies within of source A, are consistent with those of a typical red giant. This star’s location in the color-magnitude diagram is clearly to the blue side of most of the cataloged stars in the field, suggesting that it may be a relatively nearby foreground star with low extinction.
4 Discussion
4.1 Other Observations of the NTF
A portion of the Radio Arc had previously been observed at 150 GHz (2 mm) by Reich et al. (2000). In the region southward from the Sickle, they detected rather clumpy emission along the Radio Arc, but displaced slightly to the west. The brightest clump, at , was reported to have a peak brightness near 300 mJy beam-1 (), compared to a peak brightness in the Sickle region of mJy beam-1. The GISMO results present a very different picture. We find that the bright NTF has a relatively smooth profile, which has a brightness of only mJy beam-1 () at , which is several times fainter than the Sickle brightness of mJy beam-1. Thus the GISMO results are roughly consistent with the spectral break to at GHz as reported by Sofue et al. (1999). We cannot explain why the earlier observations seem to show structure that is absent in the GISMO observations. The GISMO observations do show some bright clumpy emission near the Radio Arc that is well matched as an extension of the far-IR spectrum of dust in molecular clouds, but these do not correspond to features in the Reich et al. (2000) observations. The clear similarities between the GISMO observations and other wider surveys at longer and shorter wavelengths provides confidence that the GISMO results are more reliable.
The structure seen in the GISMO observations is also very well matched to the 3 mm observations by Pound & Yusef-Zadeh (2018). The 3 mm interferometric observations have higher angular resolution, but are at lower signal to noise and are insensitive to diffuse large scale emission. The 3 mm data are much less contaminated by thermal emission from dust in molecular clouds, and therefore the resemblance to the 2 mm data is clearer after the contributions of dust emission have been modeled and subtracted (see Arendt et al., 2019).
Sofue et al. (1992) report a nondetection of the NTF at 43 GHz (7 mm) using the Nobeyama Millimeter-wave Array at MJy sr-1 with a synthesized beam. However they note that single-dish observations at the same wavelength (and resolution) yield a mean brightness of 16.3 MJy sr-1. This latter brightness is consistent with the other measurements shown in Figure 7.
The GISMO observations of the NTF provide further support for its spectral turnover at GHz that was reported by Sofue (1999). The relative brightness of the central NTF and the rest of the Radio Arc, which is only barely visible on the western side of the NTF, indicates that the bulk of the Radio Arc has a steeper spectrum or lower-frequency turnover. Reich et al. (1988) explained the 843 MHz to 43.25 GHz morphology and spectral index of the Radio Arc as a broad component with and a narrower component with . As these are determined over such a wide frequency range, they are not inconsistent with both components rolling over to a much steeper spectrum at frequencies GHz.
4.2 Emission from the Radio Arc NTF
Given that the 2 mm data confirm a distinct break in the radio spectrum, it seems unlikely that free-free emission in the vicinity (or foreground) of the filaments would contribute much to the 2 mm emission. Thus the 2 mm emission effectively sets an upper limit on the free-free at longer wavelengths which is sufficiently low to alleviate the concern that free-free emission may contribute to the flatness of the NTF radio spectrum (Yusef-Zadeh, 2003). Dominance by nonthermal synchrotron emission at 2 mm is also supported by the finding that the Radio Arc filaments are one of the few polarized regions in low resolution 2 and 3 mm observations of the Galactic Center (Culverhouse et al., 2011). Furthermore, since our measurements are made using local background subtraction along the filament, any diffuse free-free emission should not contribute to measured brightness unless the emitting gas is also highly confined to the same flux tube.
The key features of the 2 mm emission from the NTF are its relatively steep spectral index compared to the 6 and 20 cm emission, and the observation that this spectral index steepens from north to south along the filament. To gain some insight to the meaning of these results, we compare the observations to theoretically-motivated synchrotron spectra.
Consider a source that injects high-energy electrons into a magnetically-confined filament with a cross sectional radius . We assume that the energy spectrum of the injected electrons remains constant in time, so that the injection rate of electrons per unit volume can be represented by the product of two independent functions
| (1) |
where is the number density of electrons with energies between and , and is the injection rate at time .
We assume that the energy spectrum of the electrons is given by a power law with an index at energies between and , such that
| (2) |
where and are, respectively, the average energy of the injected electrons, and the total electron energy density over the energy range, and the coefficient is a normalization constant: .
Following their injection, the electrons lose energy by synchrotron radiation at a rate given by Rybicki & Lightman (1986)
| (3) | |||||
where cm2 is the Thomson cross section, is the magnetic energy density, is the magnetic field strength, is the speed of light, and , where , is the electron velocity, and where the energy loss is averaged over pitch angles (). The parameter defined in Equation (3) is the average synchrotron lifetime of the electron.
The specific emissivity of the synchrotron emission per unit volume at frequency and time is then given by:
where the synchrotron power per unit frequency interval for a single electron is
| (5) |
is a critical frequency, is the electron charge, is the pitch angle between the electron velocity and the magnetic field, and is a function of that can be approximated by (D. Kazanas, private communications)
| (6) |
This approximation is accurate within for . The spectrum is calculated at the energy , the energy of the electron at time after its injection, which is given by
| (7) |
The observed specific flux is given by an integral over the emitting volume
| (8) | |||||
where is the beam size, and is the effective path length through the filament.
To fit the observed spectrum we adopted the following model parameters: and equal to and eV, respectively, and assume the magnetic field is uniform with a strength of G (e.g. Yusef-Zadeh & Morris, 1987a) along the filament. The flatness of the synchrotron spectrum at cm suggests a flat injection spectrum of the electrons with a power-law index of . With this choice of parameters, the average electron energy is eV, with a corresponding synchrotron lifetime of 3200 y. We took the radius of the filament to be pc (Morris & Yusef-Zadeh, 1985). Our examination is limited to the range where the filament is best seen, corresponding to a length of cm, assuming a distance of 8.18 kpc (Abuter et al., 2019).
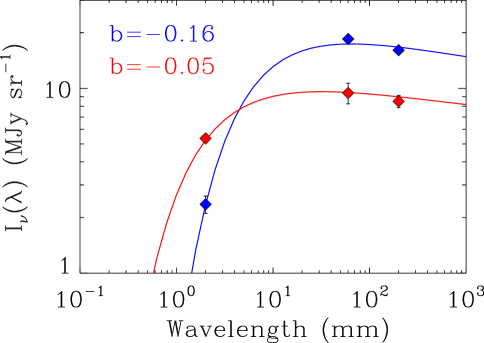
We assume that the electrons are injected into the filament at some time , and that their energies evolve due to synchrotron losses as described in Equation (7). Fitting the data allows us to estimate the time elapsed since their injection. Figure 11 depicts the fits of this model at the opposite endpoints of this segment of the filament, where the spectral indices are distinctly different. The fits suggest ages of 2500 and 5000 y and electron energy densities of 1.3 and erg cm-3 at the north and south ends respectively.
If the electrons are injected into the filament near the northern position, and the age difference corresponds to the electron diffusion time to the southern position, then the implied velocity is km s-1. As in an ionized medium this velocity is limited to the Alfvén velocity, cm s-1 (Wentzel, 1974; Longair, 1981), we derive an average density of nuclei in the filaments of cm-3.
The total energy contained in this segment of the filament is erg. If the filament is not a transient phenomenon, then the luminosity required to sustain the emission from the filament is approximately given by L☉. This luminosity is very similar to the independently obtained value obtained by Serabyn & Morris (1994). However, it depends on our choice of the magnetic field strength and the value of . For example, for a fixed magnetic field strength, we find that the filament’s luminosity scales as . A detailed examination of the model scenario and parameter space will be a subject of future studies.
A number of models for electron acceleration giving rise to the synchrotron emission in the Galactic center filament were summarized by Morris (1996). One hypothesis by Serabyn & Morris (1994) invoked acceleration by magnetic field line reconnection at the surface of the molecular cloud that is ionized by UV radiation from the Quintuplet cluster. They had found reconnection plausible because the magnetic fields inside and outside of the molecular cloud are orthogonal to each other, and they can be mixed and reconnecting in the turbulent, ionized cloud surface. They also noted that there are particular molecular clumps associated with each of the primary bundles of filaments in the Radio Arc (see Figure 2 of that paper). That, and the fact that several of the filaments undergo a discontinuity in either brightness or direction (slightly in the case of direction) at the location of the ionization front, suggested an association of the production sites for relativistic particles with the ionized surfaces of the molecular clumps. However, we do note that at 90 cm, the Sickle appears in absorption against the Radio Arc filaments, suggesting that it lies in front, at least in part (Figure 4). This was noted by Anantharamaiah et al. (1991), who also point out likely absorption by the Pistol Nebula as well (Source B in Figure 4). There are other clear cases where an ionized surface on a molecular cloud is associated with a filament, as studied by (Uchida et al., 1996) and Staguhn et al. (1998).
Alternately, production of the relativistic electrons may arise in shocked stellar winds as proposed by Rosner & Bodo (1996) and Yusef-Zadeh (2003). In the case of single adiabatic diffusive shock acceleration, the spectral index is . Having multiple shocks flattens the distribution of the energy spectrum of the particles. Winds from different stellar sources may be responsible if they collide and get shocked multiple times (Pope & Melrose, 1994). The shocks would be due to the collective winds from all the stars in the Quintuplet Cluster, which is more compact than the scale of the ionization front/shock (i.e., the Sickle). While the Radio Arc NTFs have a flat spectrum at longer wavelengths, most other nonthermal filaments have steep spectra (Law et al., 2008). However, this model does not give an obvious reason why the prominent filament bundles in the Radio Arc are associated with molecular clumps. From this, one might expect that electrons would be accelerated across the shock all the way along the Sickle, rather than in just a few choice places.
The interaction of a Galactic wind with dense clouds has also been proposed by Shore & LaRosa (1999) as a means of creating NTFs, with more detailed development by (Dahlburg et al., 2002). Given the large number of filaments in the Galactic center, a global wind is needed and at the sites where the wind gets shocked, producing relativistic particles. In the case of the Radio Arc, the wind could come from the Quintuplet cluster.
5 Summary
The brightest NTF in the Radio Arc is detected at 2 mm with a brightness that is consistent with a steep spectral index () at 2 mm. The steepening 2 mm spectral index as a function of location along the NTF points to the Sickle (rather than point source N3) being directly related to the origin on the NTF electrons. Interpretation of the changing spectral index as the aging of populations of relativistic electrons implies timescales of y and velocities of km s-1 for diffusion of relativistic electrons along the NTF. The rest of the Radio Arc is only marginally detected.
We detect a 2 mm point source (at resolution) very near the location of the N3 radio point source, but examination of the data across a wide range of wavelengths indicates the 2 mm emission is likely dust emission from an adjacent molecular cloud. We determine that a near-IR ( m) point source coincident with this 2 mm point source is actually a foreground star along the same line of sight, and is unrelated to the radio source N3 as well. Other nearby compact 2 mm sources, unlike the source near N3, show extended emission in higher resolution mid-IR (3.6 - 24 m) data and are mostly associated with compact H II regions and other markers of star formation.
This report covers only a portion of the Galactic Center region mapped by GISMO. Other regions of interest are the dust properties of the ISM and dense molecular clouds in the GC region (Arendt et al., 2019), thermal and non-thermal emission in the vicinity of Sgr A and Sgr A* itself, thermal emission regions near Sgr C and Sgr B1, and the dense molecular clouds and embedded UCHII regions in Sgr B2.
Note added in proof: Heywood et al. (2019) have used the MeerKAT radio telescope to produce an extremely wide and sensitive 1.284 GHz map of the Galactic Center region. The map reveals greater detail and extent of the radio lobe (e.g. Law, 2010), both N and S of the Galactic plane. Many of the NTFs appear to be coherent with the walls of this radio bubble. Heywood et al. (2019) suggest NTFs outside the radio bubble may result from cosmic ray advancing ahead of a shock front. Thus there may even be a common origin for all the NTFs, rather than a locally-driven process that is repeated independently throughout the CMZ.
References
- Abuter et al. (2019) Abuter, R., Amorim, A., Bauboeck, M., et al. 2019, arXiv e-prints, arXiv:1904.05721
- An et al. (2011) An, D., Ramírez, S. V., Sellgren, K., et al. 2011, ApJ, 736, 133
- Anantharamaiah et al. (1991) Anantharamaiah, K. R., Pedlar, A., Ekers, R. D., & Goss, W. M. 1991, MNRAS, 249, 262
- Arendt et al. (2019) Arendt, R. G., Staguhn, J., Dwek, E., et al. 2019, AJ, in prep.
- Baars et al. (1987) Baars, J. W. M., Hooghoudt, B. G., Mezger, P. G., & de Jonge, M. J. 1987, A&A, 175, 319
- Becker et al. (1994) Becker, R. H., White, R. L., Helfand, D. J., & Zoonematkermani, S. 1994, The Astrophysical Journal Supplement Series, 91, 347
- Bicknell & Li (2001) Bicknell, G. V., & Li, J. 2001, ApJ, 548, L69
- Butterfield et al. (2018) Butterfield, N., Lang, C. C., Morris, M., Mills, E. A. C., & Ott, J. 2018, ApJ, 852, 11
- Caswell (1996) Caswell, J. L. 1996, MNRAS, 283, 606
- Churchwell et al. (2007) Churchwell, E., Watson, D. F., Povich, M. S., et al. 2007, The Astrophysical Journal, 670, 428
- Culverhouse et al. (2011) Culverhouse, T., Ade, P., Bock, J., et al. 2011, ApJS, 195, 8
- Dahlburg et al. (2002) Dahlburg, R. B., Einaudi, G., LaRosa, T. N., & Shore, S. N. 2002, The Astrophysical Journal, 568, 220
- de La Fuente et al. (2009) de La Fuente, E., Porras, A., Grave, J. M. C., et al. 2009, in Revista Mexicana de Astronomia y Astrofisica Conference Series, Vol. 37, Revista Mexicana de Astronomia y Astrofisica Conference Series, 13–20
- Downes et al. (1979) Downes, D., Goss, W. M., Schwarz, U. J., & Wouterloot, J. G. A. 1979, Astronomy and Astrophysics Supplement Series, 35, 1
- Figer et al. (1999) Figer, D. F., Morris, M., Geballe, T. R., et al. 1999, ApJ, 525, 759
- Ginsburg et al. (2013) Ginsburg, A., Glenn, J., Rosolowsky, E., et al. 2013, ApJS, 208, 14
- Giveon et al. (2002) Giveon, U., Sternberg, A., Lutz, D., Feuchtgruber, H., & Pauldrach, A. W. A. 2002, ApJ, 566, 880
- Guesten & Downes (1983) Guesten, R., & Downes, D. 1983, A&A, 117, 343
- Guzmán et al. (2015) Guzmán, A. E., Sanhueza, P., Contreras, Y., et al. 2015, ApJ, 815, 130
- Heywood et al. (2019) Heywood, I., Camilo, F., Cotton, W. D., et al. 2019, Nature, 573, 235
- Joye & Mandel (2003) Joye, W. A., & Mandel, E. 2003, in Astronomical Society of the Pacific Conference Series, Vol. 295, Astronomical Data Analysis Software and Systems XII, ed. H. E. Payne, R. I. Jedrzejewski, & R. N. Hook, 489
- Kovács (2008) Kovács, A. 2008, in Proc. SPIE, Vol. 7020, Millimeter and Submillimeter Detectors and Instrumentation for Astronomy IV, 70201S
- Landsman (1995) Landsman, W. B. 1995, in Astronomical Society of the Pacific Conference Series, Vol. 77, Astronomical Data Analysis Software and Systems IV, ed. R. A. Shaw, H. E. Payne, & J. J. E. Hayes, 437
- LaRosa et al. (2000) LaRosa, T. N., Kassim, N. E., Lazio, T. J. W., & Hyman, S. D. 2000, AJ, 119, 207
- Law (2010) Law, C. J. 2010, ApJ, 708, 474
- Law et al. (2008) Law, C. J., Yusef-Zadeh, F., & Cotton, W. D. 2008, ApJS, 177, 515
- Lazio & Cordes (2008) Lazio, T. J. W., & Cordes, J. M. 2008, ApJS, 174, 481
- Levine et al. (1999) Levine, D., Morris, M., & Figer, D. 1999, in ESA Special Publication, Vol. 427, The Universe as Seen by ISO, ed. P. Cox & M. Kessler, 699
- Longair (1981) Longair, M. S. 1981, High energy astrophysics. an informal introduction for students of physics and astronomy (Cambridge University Press)
- Ludovici et al. (2016) Ludovici, D. A., Lang, C. C., Morris, M. R., et al. 2016, ApJ, 826, 218
- Molinari et al. (2016) Molinari, S., Schisano, E., Elia, D., et al. 2016, A&A, 591, A149
- Moneti et al. (1999) Moneti, A., Blommaert, J. A. D. L., Najarro, F., Figer, D., & Stolovy, S. 1999, in ESA Special Publication, Vol. 427, The Universe as Seen by ISO, ed. P. Cox & M. Kessler, 723
- Morris (1996) Morris, M. 1996, in IAU Symposium, Vol. 169, Unsolved Problems of the Milky Way, ed. L. Blitz & P. J. Teuben, 247
- Morris & Yusef-Zadeh (1985) Morris, M., & Yusef-Zadeh, F. 1985, AJ, 90, 2511
- Napier & Rots (1982) Napier, P. J., & Rots, A. H. 1982, VLA Primary Beam Parameters, VLA Test Memorandum 134, NRAO, VLA
- Parsons et al. (2018) Parsons, H., Dempsey, J. T., Thomas, H. S., et al. 2018, ApJS, 234, 22
- Phillips & Ramos-Larios (2008) Phillips, J. P., & Ramos-Larios, G. 2008, MNRAS, 391, 1527
- Pope & Melrose (1994) Pope, M. H., & Melrose, D. B. 1994, Proceedings of the Astronomical Society of Australia, 11, 175
- Pound & Yusef-Zadeh (2018) Pound, M. W., & Yusef-Zadeh, F. 2018, MNRAS, 473, 2899
- Ramírez et al. (2008) Ramírez, S. V., Arendt, R. G., Sellgren, K., et al. 2008, The Astrophysical Journal Supplement Series, 175, 147
- Reich et al. (2000) Reich, W., Sofue, Y., & Matsuo, H. 2000, PASJ, 52, 355
- Reich et al. (1988) Reich, W., Sofue, Y., Wielebinski, R., & Seiradakis, J. H. 1988, A&A, 191, 303
- Rodríguez-Fernández et al. (2001) Rodríguez-Fernández, N. J., Martín-Pintado, J., & de Vicente, P. 2001, A&A, 377, 631
- Rosner & Bodo (1996) Rosner, R., & Bodo, G. 1996, ApJ, 470, L49
- Rybicki & Lightman (1986) Rybicki, G. B., & Lightman, A. P. 1986, Radiative Processes in Astrophysics (Wiley)
- Schuller et al. (2009) Schuller, F., Menten, K. M., Contreras, Y., et al. 2009, A&A, 504, 415
- Serabyn & Morris (1994) Serabyn, E., & Morris, M. 1994, ApJ, 424, L91
- Shore & LaRosa (1999) Shore, S. N., & LaRosa, T. N. 1999, ApJ, 521, 587
- Simpson (2018) Simpson, J. P. 2018, The Astrophysical Journal, 857, 59
- Simpson et al. (2007) Simpson, J. P., Colgan, S. W. J., Cotera, A. S., et al. 2007, ApJ, 670, 1115
- Sofue (1999) Sofue, Y. 1999, in Star Formation 1999, ed. T. Nakamoto, 322–326
- Sofue et al. (1986) Sofue, Y., Inoue, M., Handa, T., et al. 1986, PASJ, 38, 475
- Sofue et al. (1992) Sofue, Y., Murata, Y., & Reich, W. 1992, PASJ, 44, 367
- Sofue et al. (1999) Sofue, Y., Reich, W., Reich, P., & Wielebinski, R. 1999, in Astronomical Society of the Pacific Conference Series, Vol. 186, The Central Parsecs of the Galaxy, ed. H. Falcke, A. Cotera, W. J. Duschl, F. Melia, & M. J. Rieke, 514
- Staguhn et al. (1998) Staguhn, J., Stutzki, J., Uchida, K. I., & Yusef-Zadeh, F. 1998, A&A, 336, 290
- Staguhn et al. (2008) Staguhn, J., Allen, C., Benford, D., et al. 2008, Journal of Low Temperature Physics, 151, 709
- Staguhn et al. (2006) Staguhn, J. G., Benford, D. J., Allen, C. A., et al. 2006, in Proc. SPIE, Vol. 6275, Society of Photo-Optical Instrumentation Engineers (SPIE) Conference Series, 62751D
- Stolovy et al. (2006) Stolovy, S., Ramirez, S., Arendt, R. G., et al. 2006, in Journal of Physics Conference Series, Vol. 54, 176–182
- Tsuboi et al. (2011) Tsuboi, M., Tadaki, K.-I., Miyazaki, A., & Handa, T. 2011, PASJ, 63, 763
- Tsuboi et al. (1997) Tsuboi, M., Ukita, N., & Handa, T. 1997, ApJ, 481, 263
- Uchida et al. (1996) Uchida, K. I., Morris, M., Serabyn, E., & Guesten, R. 1996, ApJ, 462, 768
- Wang et al. (2002) Wang, Q. D., Lu, F., & Lang, C. C. 2002, ApJ, 581, 1148
- Wang et al. (2010) Wang, Q. D., Dong, H., Cotera, A., et al. 2010, MNRAS, 402, 895
- Wentzel (1974) Wentzel, D. G. 1974, ARA&A, 12, 71
- Yusef-Zadeh (1986) Yusef-Zadeh, F. 1986, PhD thesis, Columbia University
- Yusef-Zadeh (2003) —. 2003, ApJ, 598, 325
- Yusef-Zadeh & Morris (1987a) Yusef-Zadeh, F., & Morris, M. 1987a, AJ, 94, 1178
- Yusef-Zadeh & Morris (1987b) —. 1987b, ApJ, 322, 721
- Yusef-Zadeh et al. (1984) Yusef-Zadeh, F., Morris, M., & Chance, D. 1984, Nature, 310, 557
- Yusef-Zadeh et al. (1997) Yusef-Zadeh, F., Wardle, M., & Parastaran, P. 1997, ApJ, 475, L119
- Yusef-Zadeh et al. (2009) Yusef-Zadeh, F., Hewitt, J. W., Arendt, R. G., et al. 2009, ApJ, 702, 178