Detection of a -long Trailing Tidal Tail for the Globular Cluster M5
Abstract
Using photometry and proper motions from Gaia Data Release 2, we detect a -long stream of about 70 stars extending westward from the halo globular cluster M5. Based on the similarities in distance, proper motions, inferred color-magnitude distribution, and trajectory, we identify this stream as the trailing tidal tail of M5. While the surface density of stars is very low ( stars per square degree, or magnitudes per square arcsecond), selecting only stars having proper motions consistent with the orbit of the cluster yield a detection significance . While we find a possible continuation of the stream to , increasing foreground contamination combined with a greater predicted stream distance make it difficult to detect with current data even if the stream continues unabated. The non-uniform distribution of stars in the stream appears to be consistent with episodic tidal stripping, with the most recently shed stars now trailing the cluster by tens of degrees. We provide a table of the highest-ranked candidate stream stars for ongoing and future spectroscopic surveys.
1 Introduction
The inner Galactic halo is now known to be populated with dozens of stellar debris streams (Grillmair & Carlin, 2016; Shipp et al., 2018; Malhan et al., 2018; Ibata et al., 2019; Palau & Miralda-Escude, 2019). Most of these streams are relatively narrow, with physical widths on the order of 100 pc, and they are consequently assumed to have been produced by globular clusters. Yet we know of only three extant globular clusters with long () tidal tails, namely Pal 5 (Odenkirchen et al., 2003), NGC 5466 (Grillmair & Johnson, 2006; Belokurov et al., 2006), and M68 (Palau & Miralda-Escude, 2019). This is somewhat surprising, given that most globular clusters studied to date show evidence for departures from King profiles (King, 1966) in their outskirts that are consistent with the development of tidal tails (Grillmair et al., 1995; Leon et al., 2000).
With episodic stripping and consequent regular variations in stream density, tidal tails extending from extant globular clusters may be somewhat problematic for detecting signatures of dark matter subhalos (Küpper et al., 2012). On the other hand, by providing well-characterized progenitors, such tidal tails will be useful for understanding the detailed physics of tidal stripping, the accretion sequence of the halo, and the shape of the Galactic potential (Bovy et al., 2016).
With the second data release of the Gaia catalog we now have considerably more information for sorting stars into substructures. Malhan & Ibata (2018), Malhan et al. (2018) and Ibata et al. (2019) have applied brute force orbital integration techniques to discover many halo streams that would have been impossible to detect with the purely photometric techniques of a few years ago. Here we use an alternative, more directed method to detect a long trailing tail behind the globular cluster M5. Section 2 describes our method. We discuss possible issues with the association of the stream with M5 in Section 3 and make concluding remarks in Section 4.
2 Analysis
Our search technique makes use of the Gaia second data release (Gaia Collaboration et al., 2016, 2018a). While the relatively bright limiting magnitude of the catalog () rather limits the numbers of main sequence stars that can be sampled (compared with deeper photometric catalogs like the Sloan Digital Sky Survey or Pan-STARRS) the addition of high-quality proper motion measurements enables selection criteria that can more than compensate in certain circumstances.
Gaia Collaboration et al. (2018b) used the Gaia catalog to measure proper motions for most of the known Galactic globular clusters. Using these proper motions along with previously published radial velocities, we used a simple model of the Galaxy (Allen & Santillan (1991), updated using the parameters of Irrgang et al. (2013)) to compute orbits for clusters. From these orbits we derived expectation profiles for proper motions as a function of position on the sky. The predicted run of position, distance, radial velocity, and proper motions for M5’s orbit are shown in Figure 1.
We then applied a modified form of the matched filter described by Rockosi et al. (2002) and Grillmair (2009) to the Gaia data. Briefly, we used the Gaia-observed distribution of stars in M5 to produce a color-magnitude locus extending from the apparent tip of the red giant branch to the main sequence at . This locus was then shifted up and down in to account for possible changes in distance of stream stars. At each magnitude shift/assumed distance, individual stars in the field were accorded weights based on their minimum distances from the CM locus. These weights were computed using the Gaia-provided photometric uncertainties and assuming a Gaussian error distribution. We used only stars with photometric uncertainties of less than 0.5 mag and valid proper motion measurements. In this newly modified form of the filter, these weights were then scaled again using each stars’s departure from the expected proper motion profiles shown in Figure 1. The Gaia-provided proper motion errors were assumed to be Gaussian and the corresponding weights computed as:
| (1) |
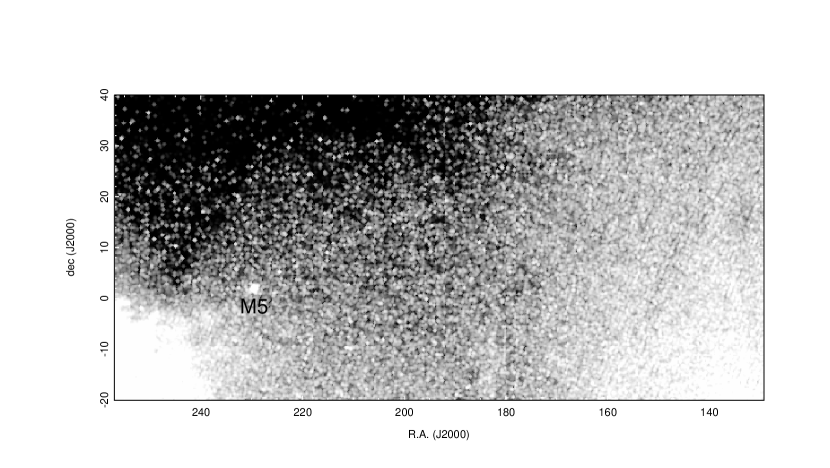
where are the components of proper motion predicted at each star’s Right Ascension in Figure 1. We then summed these weights by sky position to produce the weighted surface density map shown in Figure 2.
Figure 2 shows a tenuous but significant stream of stars extending to the northwest of M5. The stream is not aligned with any features in Gaia’s scan pattern, nor does it coincide with any extended regions of particularly low reddening (Schlegel, Finkbeiner, & Davis, 1998). The stream is visible only over a limited range of assumed distance moduli, strengthening and subsiding with increasing distance in a manner that is characteristic of purely photometric uncertainties. While there is no obvious M5-like color-magnitude sequence visible for purely proper motion-selected stars within the area of the stream, using color-magnitude filters that are either somewhat more metal-rich or more metal-poor than M5 yield a reduced maximum signal-to-noise ratio (SNR). Based on the strength of the matched-filtered signal, the stream appears to be located about 0.1 magnitudes closer over of much of its length than the 7.5 kpc distance of M5 itself (Harris, 1996). This qualitatively agrees with Figure 1, which predicts a heliocentric distance that drops slightly to 7.3 kpc at R.A. and then increases to nearly 15 kpc at R.A. .
Over the region R.A. the path of the stream can be modeled to within using:
| (2) |
Though M5 itself was not used in the fit, Equation 1 passes within of the cluster.
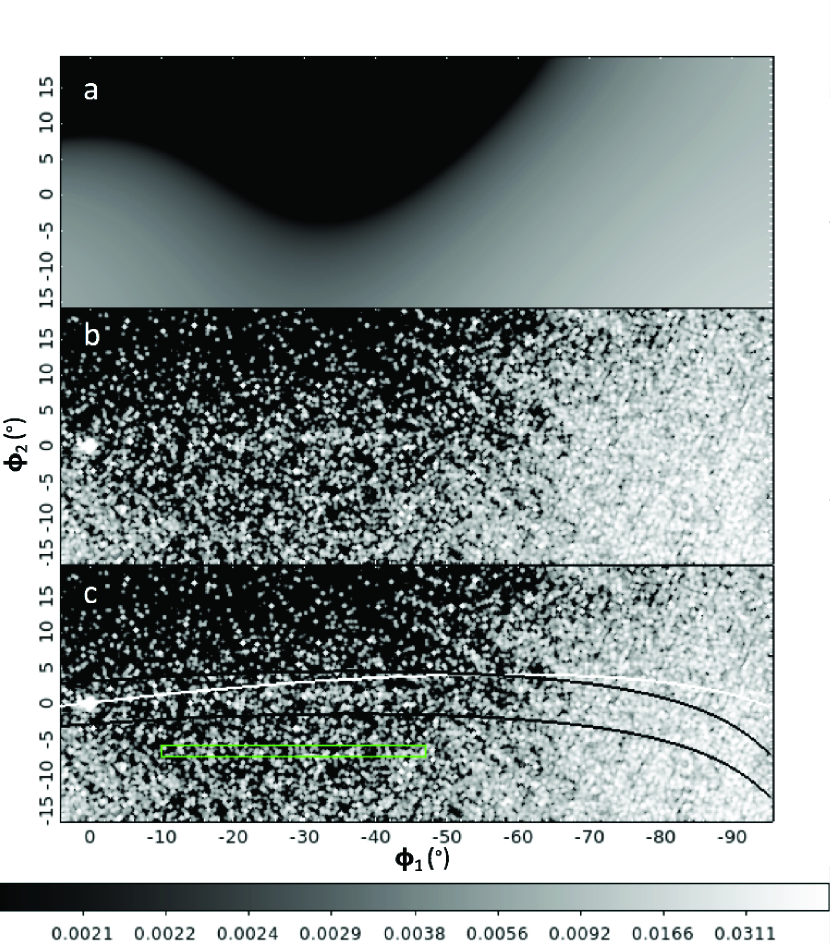
In Figure 3 we have conducted an identical analysis, but using a coordinate system aligned with the stream in Figure 2. This coordinate system has a pole at (R.A., dec) = (), and a zeropoint that places M5 at . We have also attempted to remove the foreground contribution by fitting a 3rd order polynomial to the distribution after masking out M5 itself. Also shown is the predicted orbit of M5 from Figure 1. While we do not generally expect a tidal tail to precisely follow the orbit of its progenitor (Eyre & Binney, 2011), we note that the predicted orbit diverges somewhat from the path of the stream, lying about north of the stream at . We discuss this further below.
The strongest portion of the stream extends to , whereupon the signal drops significantly to . There may be an additional stream segment extending from to . The significance of this segment is clearly marginal, though its downward arc to the southwest is suggestively similar to that of the predicted orbit. If we believe that this segment is real then there appears to be a possible gap in the stream extending from and . Such a gap might be a consequence of epicyclic motions of stars due M5’s fairly eccentric orbit, or it may have been caused by an encounter with with a massive perturber, including perhaps a dark matter subhalo (Carlberg, 2009; Yoon et al., 2011).
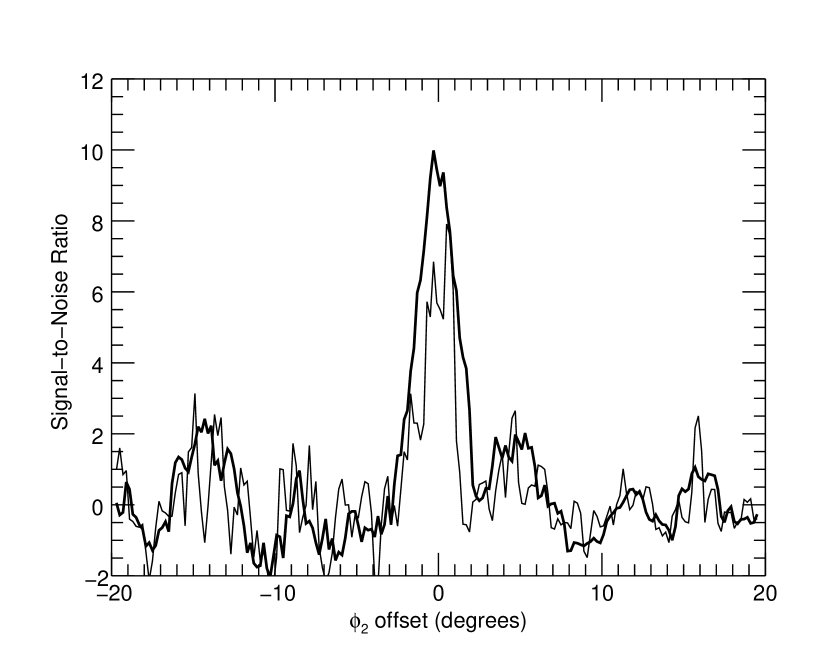
The lateral profile of the stream is shown in Figure 4. This profile was measured using both -wide and -wide rectangular masks extending from to . These masks were passed laterally across the foreground-subtracted stream in Figure 3 and the total signal recorded as a function of . The profile was then divided by the standard deviation in the signal profile for all regions with to yield a measure of SNR (the T-index of Grillmair (2009)). The strongest part of the stream is evidently detected at . Using the -wide mask, we find the full-width-at-half-maxium (FWHM) to be .
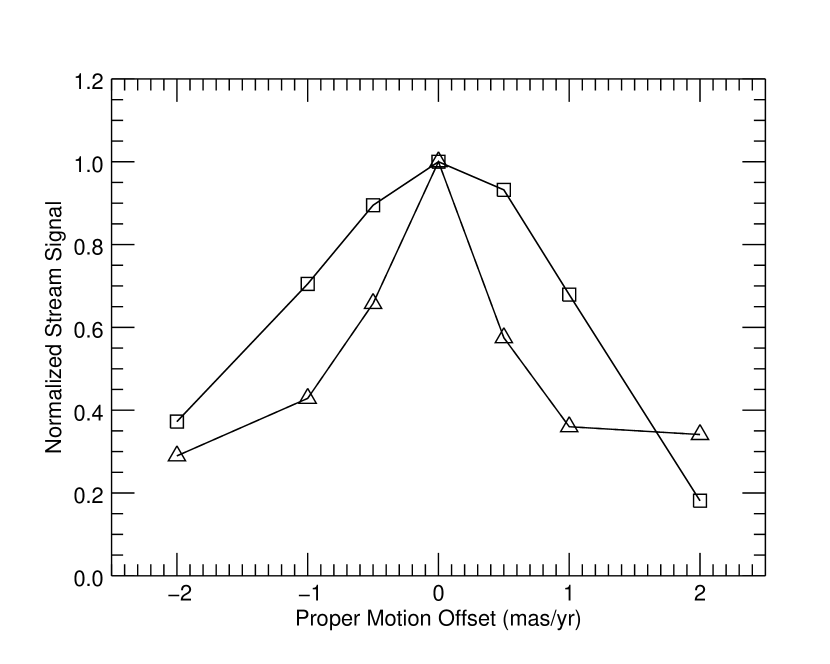
How sensitive is our detection to the predicted proper motion profiles in Figure 1? To test this, we offset the and profiles by specified amounts and measured the strength of the stream as we did in Figure 4. Figure 5 shows the signal strength as a function of proper motion offset. The signal clearly drops quite quickly as we offset from the nominal profiles expected for the orbit of M5. The widths of the peaks are consistent with the proper motion uncertainties, which can exceed 1 mas/yr at our limiting magnitude. Proper motion offsets in declination result in a more precipitous decline in the signal strength than proper motion offsets in . This appears to be in accord with Gaia’s relative proper motion uncertainties in the two directions in this part of the sky. For stars with and satisfying our color-magnitude constraints, the average uncertainty is 0.74 mas/yr, whereas for the average is 0.45 mas/yr.
We note in passing that the uncertainties in our M5 proper motion profiles are dominated by the uncertainty in the distance to M5 (see below). We are of course also subject to inaccuracies in our adopted Galactic model. The uncertainties in the measured proper motions and radial velocity for M5 (Gaia Collaboration et al., 2018b) are so small as to have essentially no visible effect on the profiles in Figure 1.
Based on the close alignment of the stream with M5, the similarity in distance and trajectory of the stream compared with that of the model orbit, that the stream is most strongly detected using the proper motions predicted for M5’s orbit, and the fact that the highest SNR is obtained using a filter based on the color-magnitude distribution of stars in M5, we conclude that the stream is most likely to be the trailing tidal tail of M5.
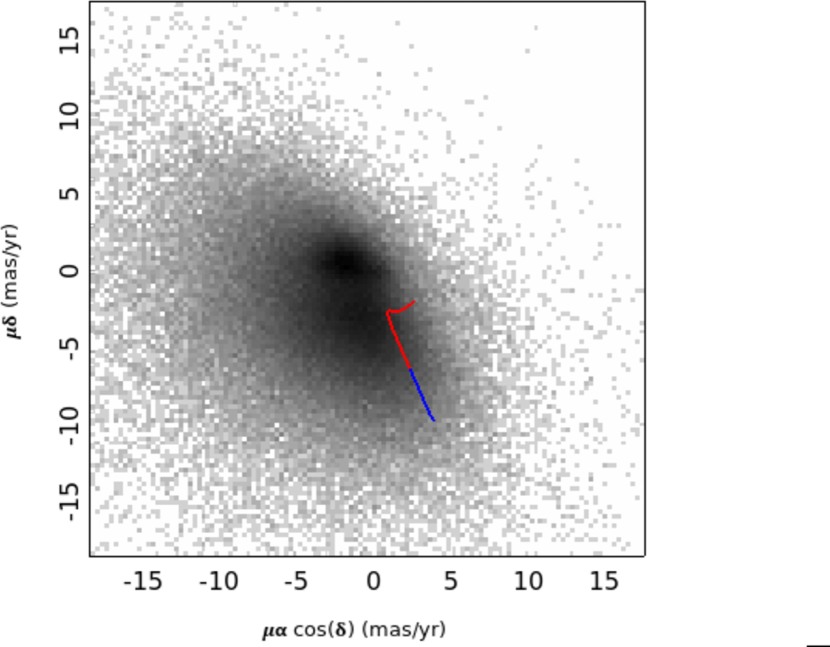
Our computed orbit for M5 predicts heliocentric distances that remain relatively constant for much of the visible stream, rising gradually to the west and peaking at at about 14.5 kpc at RA . Thus, even if the stream extended around the Galaxy with uniform surface density, we would expect the observed stream to fade towards the west as fewer and fewer stars lie within Gaia’s magnitude limit. Moreover, the surface density of foreground stars with proper motions similar to those of M5’s orbit increases substantially as we approach the Galactic plane to the west. This is shown in Figure 6, where we compare the predicted proper motions for M5’s orbit with the distribution of proper motions in the region of the north Galactic pole. Using a globular cluster luminosity function and reducing the limiting magnitude by 1.5 magnitudes predicts that we should see only one third as many stars. In addition, sampling Figure 5 or making a cut along just below the stream shows that foreground contamination increases by more than a factor of ten. Combining the reduction in stream stars with the increase in background therefore predicts an SNR of at R.A. . This is roughly consistent with the appearance of the westenrmost segment. Figures 2 and 3 therefore do not rule out a stream that continues westward with a constant surface density. Future deep, multi-epoch surveys (e.g. WFIRST, Sanderson et al. (2017)) may be able to trace M5’s tidal tail considerably further around the Galaxy.
There is no clear signature of M5’s leading tail. While there appears to be a pair of somewhat amorphous enhancements to the southeast of M5, these also coincide with similarly shaped patches of significant reddening ((E - V) , Schlegel, Finkbeiner, & Davis (1998)). For the present, we attribute these enhancements to inaccurate reddening corrections. M5’s orbit predicts that the leading tail should reappear south of the Galactic plane at kpc, with distance increasing eastwards to over 20 kpc at RA . A cursory search for the leading tail south of the Galactic plane did not yield any obvious candidate. Moreover, Gaia’s scan pattern in this region of the sky is almost parallel to M5’s predicted orbit, making an unambiguous identification somewhat problematic. Based on the arguments above, we conclude that the SNR is too low for detectability with existing Gaia measurements.
2.1 Radial Velocity Measurements
Matching by position the five hundred highest weighted stars in the stream against the Sloan Digital Sky Survey Data Release 15 (Aguado et al., 2018), we found a total of three matches. Of these, only one star is classified as metal poor. This star (SDSS J124931.41+195438.0) has (R.A., dec) = (), , [Fe/H] -1.5, and a heliocentric radial velocity of km s-1. Figure 1 shows that the predicted velocity at this point along M5’s orbit is -73.5 km s-1, in agreement at the level. We therefore consider this a high probability member of M5’s trailing tail.
As an aid for ongoing and future spectroscopic surveys, we provide coordinates, Gaia magnitudes and colors, and proper motions for the fifty highest-weighted candidate stream stars in Table 1. These candidates span the strongest part of the stream (R.A.) and are ranked by relative weight, with the most probable candidate listed first.
3 Discussion
M5’s trailing tail is somewhat broader than other globular cluster streams. At a distance of 7.5 kpc, the measured FWHM of would correspond to pc. The stream also appears to be less collimated and more “wiggly” than more populous streams like GD-1 or Pal 5, though this may be partly a consequence of small number statistics.
Another interesting feature of M5’s tidal tail is that it does not connect as directly or as strongly with the cluster as do, for example, the tidal tails of Pal 5 Odenkirchen et al. (2003) or NGC 5466 Belokurov et al. (2006); Grillmair & Johnson (2006). The strongest part of the stream is situated between and away from the cluster, and there appears to be a gap or diminution between to from the cluster itself. Does this argue against an association between the stream and M5? As a simple experiment we set the cluster to be 62 pc (the estimated tidal radius of a M5 Harris (1996)) and 200 pc (the width of the stream) further away than its nominal distance and integrate new orbits around the Galaxy. These integrations show that the stars in the trailing tail should take between 3% and 8% longer to orbit the Galaxy than the cluster itself. M5 is on a moderately eccentric orbit ( (Gaia Collaboration et al., 2018b)) and tidally stripped stars will primarily be lost near perigalacticon. If the strongest part of the stream in Figure 2 represents a pulse of stars lost during the last perigalactic passage some years ago, then we would now expect the center of this pulse to be trailing the cluster by between and . The approximate agreement between the observed distribution and the results of this experiment once again point to an association between the stream and M5, and suggest that the cluster is undergoing strongly episodic tidal stripping.
Could M5’s trailing tail be detected using traditional, photometry-only matched filter techniques applied to deeper photometric surveys? We tested this by applying the matched-filter technique described by Grillmair (2009) to the Pan-STARRs PS-1 catalog, using and color-magnitude diagrams for M5 to a limiting magnitude of . This fainter magnitude limit would nominally gain us between two and three times as many stream stars. However, owing presumably to the lack of proper motions and the concomitant severe contamination by foreground stars, no trace of a stream could be detected. This underscores the tremendous value of Gaia proper motions for detecting very tenuous streams.
A possible issue with the identification of the stream with M5 is that the stream stars fall on the “wrong” side of the M5’s putative orbit. Our adopted Galactic model predicts that we are very nearly in the plane of M5’s orbit, though very slightly ahead of this plane in the direction of Galactic rotation. If this is indeed the trailing tail of M5, then the stars would have been cast into slightly higher Galactic orbits than that of M5. From our vantage point, this would nominally put a trailing tail on or just slightly to the north of M5’s orbit. Yet the observed stream lies south of the putative orbit over its entire length. This situation holds for a variety of orbits computed by offsetting the velocities, proper motions, and parallax to their limits (including a systematic error of 0.035 mas/yr per Gaia Collaboration et al. (2018b)). The distance to M5 remains the most uncertain of the input parameters, and the stream offset issue can be alleviated if we set this to be 7 kpc. As shown in Figure 3, the predicted orbit then lines up with the stream very well. However, such a distance would depart by more than from the 7.6 kpc main-sequence fitting estimate of Sandquist et al. (1996).
Alternatively, it is quite possible that our simple, spherical halo model is inaccurate in this region of the Galaxy, and that either non-sphericity and/or dynamical changes in the dark matter distribution (Erkal et al., 2019; Carlberg, 2019) are responsible for the apparent divergence between orbit and stream. Realistic N-body modeling of the stream may also shed light on whether the position of the stream and M5’s putative orbit can be plausibly reconciled. Finally, despite our arguments above, it is possible that the stream is not associated with M5. Spectroscopy of many individual stars will be required to determine whether they are both dynamically and chemically related to M5.
4 Conclusions
Using Gaia photometry and proper motion measurements we have detected a stream of metal-poor stars that we believe to be the trailing tidal tail of the globular cluster M5. The detection was made possible by the fact that the proper motions expected based on M5’s orbit are significantly different from those of most foreground stars in the vicinity of the north Galactic pole. The most visible part of the tail has an estimated surface density to of 1.5 stars per square degree, and a corresponding surface brightness of magnitudes per square arcsecond. Owing to both increasing distance and foreground contamination, the stream could plausibly extend much further around the Galaxy but be largely undetectable in the Gaia data.
The predicted destruction rate of M5 is not particularly high among globular clusters generally (Gnedin & Ostriker, 1997), ranking somewhere in the middle or near the bottom depending on the model used. The detection of M5’s trailing tail suggests that, given Gaia proper motions, extended tidal tails for many other globular clusters may now be detectable. Previous work suggests that most if not all globular clusters should have tidal tails and our detection demonstrates that Gaia proper motion measurements may, in favorable circumstance, provide a way of mapping the extended portions of these tails. Given the relatively accurate measurements of the six dimensional phase space coordinates now available for many of the nearby globular clusters, finding such extended tidal tails will at a minimum aid in our efforts to map the detailed contours and possible secular evolution of the Galactic potential.
References
- Aguado et al. (2018) Aguado et al. 2018, ApJS, 240, 23
- Allen & Santillan (1991) Allen, C., & Santillan, A. 1991, Rev. Mex. Astron. Astrofis., 22, 255
- Balbinot et al. (2015) Balbinot, E., Yanny, B., Li, T. S. et al. 2015, ApJ, in press.
- Belokurov et al. (2006) Belokurov, V., Evans, N. W., Irwin, M. J., Hewett, P. C., & Wilkinson, M. I. 2006, ApJ, 637, 29
- Bovy et al. (2016) Bovy, J., Bahmanyar, A., Fritz, T. K., & Kallivayalil, N. 2016, ApJ, 833, 31
- Carlberg (2009) Carlberg, R. G., ApJ, 705, 223
- Carlberg (2019) Carlberg, R. G., arXiv:1902.03275
- Carlberg & Grillmair (2013) Carlberg, R. G., & Grillmair, C. J. 2013, ApJ, 768, 171
- Erkal et al. (2019) Erkal, D., Belokurov, C., Laport, C. F. P. et al. 2019, MNRAS, in press.
- Eyre & Binney (2011) Eyre, A., & Binney, J. 2011, MNRAS, 413, 1852
- Fardal et al. (2015) Fardal, M. A., Huang, S., & Weinberg, M. D. 2015, MNRAS, 452, 301
- Gaia Collaboration et al. (2016) Gaia Collaboration Brown, A. et al. 2016, å, 595, 2
- Gaia Collaboration et al. (2018a) Gaia Collaboration, Brown, A. et al. 2018a, å, 616, 1
- Gaia Collaboration et al. (2018b) Gaia Collaboration, Helmi, A. et al. 2018b, å, 616, 12
- Gnedin & Ostriker (1997) Gnedin, O. Y., & Ostriker, J. P. 1997, /apj, 474, 223
- Grillmair (2009) Grillmair, C. J. 2009, ApJ, 694, 1118
- Grillmair et al. (1995) Grillmair, C. J., Freeman, K. C., Irwin, M., & Quinn, P. J. 1995, AJ, 109, 2553
- Grillmair & Johnson (2006) Grillmair, C. J., & Johnson, R. 2006, ApJ, 639, 17
- Grillmair & Carlin (2016) Grillmair, C. J., & Carlin, J. L. 2016, in Tidal Streams in the Local Group and Beyond, H. J. Newberg & J. L. Carlin eds., Springer
- Harris (1996) Harris, W. E. 1996, AJ, 112, 1487
- Ibata et al. (2019) Ibata, R. A., Malhan, K., & Martin, N. F. 2019, ApJ, 872, 152
- Irrgang et al. (2013) Irrgang, A., Wilcox, B., Tucker, E., & Schiefelbein, L. 2013, å, 549, 137
- King (1966) King, I. R. 1966, ApJ, 71, 64
- Küpper et al. (2012) Küpper, A. H. W., Lane, R. R., & Heggie, D. C. 2012, MNRAS, 420, 2700
- Malhan & Ibata (2018) Malhan, K. & Ibata, R. A. 2018, MNRAS, 477, 4063
- Malhan et al. (2018) Malhan, K., Ibata, R. A., & Martin, N. F. 2018, MNRAS, 481, 3442
- Leon et al. (2000) Leon, S., Meylan, G., & Combes, F. 2000, å, 359, 907
- Odenkirchen et al. (2003) Odenkirchen, M., Grebel, E. K., Dehnen, W. et al. 2003, AJ, 126, 2385
- Palau & Miralda-Escude (2019) Palau, C. G. & Miralda-Escude, J. 2019, arXiv: 1905.01193
- Rockosi et al. (2002) Rockosi, C. M., Odenkirchen, M., Grebel, E. K. et al. 2002, AJ, 124, 349
- Sanderson et al. (2017) Sanderson, R. E., Bellini, A., Casertano, S. et al. 2017, arXiv:1712.05420
- Sandquist et al. (1996) Sandquist, E. L., Bolte, M., Stetson, P. B., & Hesser, J. E. 1996, ApJ, 470, 910
- Schlegel, Finkbeiner, & Davis (1998) Schlegel, D. J., Finkbeiner, D. P., & Davis, M. 1998, ApJ, 500, 525
- Shipp et al. (2018) Shipp, N., Drlica-Wagner, A., Balbinot, E. et al. 2018, ApJ862, 114
- Yoon et al. (2011) Yoon, J. H., Johnston, K. V., & Hogg, D. W. 2011, ApJ, 731, 58

| Rank | R.A. (J2015) | dec (J2015) | (mas yr-1) | (mas yr-1) | Relative Weight | ||
|---|---|---|---|---|---|---|---|
| 1 | 211.8487 | 10.5403 | 18.030 | 0.648 | 3.741 0.346 | -9.117 0.096 | 1.000 |
| 2 | 214.1377 | 10.8701 | 18.624 | 0.661 | 3.439 0.518 | -9.072 0.079 | 0.864 |
| 3 | 191.8278 | 19.3288 | 18.750 | 0.658 | 2.943 0.495 | -7.059 0.117 | 0.836 |
| 4 | 221.2704 | 6.3224 | 18.349 | 0.633 | 3.604 0.453 | -9.941 0.325 | 0.823 |
| 5 | 224.7915 | 5.2440 | 17.813 | 0.649 | 3.970 0.288 | -9.758 0.357 | 0.690 |
| 6 | 219.6210 | 9.3874 | 18.481 | 0.626 | 3.470 0.454 | -9.502 0.229 | 0.623 |
| 7 | 206.9149 | 13.8379 | 18.128 | 0.641 | 3.302 0.359 | -8.887 0.304 | 0.612 |
| 8 | 189.1147 | 20.2214 | 18.553 | 0.631 | 2.236 0.429 | -6.821 0.132 | 0.580 |
| 9 | 215.2481 | 9.1563 | 18.036 | 0.640 | 3.838 0.366 | -9.582 0.484 | 0.565 |
| 10 | 200.5500 | 16.3797 | 18.725 | 0.660 | 2.524 0.525 | -7.885 1.231 | 0.458 |
| 11 | 203.8473 | 13.6791 | 18.998 | 0.686 | 2.631 0.846 | -8.046 0.453 | 0.458 |
| 12 | 225.6028 | 6.4901 | 18.418 | 0.612 | 4.303 0.394 | -9.856 0.882 | 0.432 |
| 13 | 198.0241 | 17.3266 | 18.062 | 0.601 | 2.738 0.332 | -7.762 0.355 | 0.420 |
| 14 | 202.0928 | 15.2032 | 17.942 | 0.650 | 3.382 0.382 | -8.304 0.192 | 0.402 |
| 15 | 215.6956 | 10.3686 | 18.525 | 0.658 | 4.195 0.444 | -8.972 0.182 | 0.373 |
| 16 | 214.1131 | 9.6728 | 18.593 | 0.676 | 3.546 0.486 | -9.272 0.456 | 0.372 |
| 17 | 191.8149 | 16.7659 | 19.318 | 0.743 | 2.724 1.841 | -7.245 0.394 | 0.371 |
| 18 | 194.1823 | 17.1066 | 18.529 | 0.642 | 3.553 0.521 | -7.361 0.967 | 0.363 |
| 19 | 221.8236 | 7.5419 | 18.722 | 0.684 | 4.295 0.510 | -9.537 0.122 | 0.362 |
| 20 | 199.0225 | 14.7108 | 19.222 | 0.704 | 3.293 0.799 | -8.407 0.130 | 0.351 |
| 21 | 188.0709 | 17.4787 | 19.177 | 0.675 | 2.394 0.779 | -6.701 0.122 | 0.337 |
| 22 | 216.2352 | 8.7810 | 19.415 | 0.734 | 3.002 0.882 | -9.145 0.276 | 0.327 |
| 23 | 195.6849 | 15.8065 | 19.131 | 0.692 | 2.230 0.664 | -7.666 0.667 | 0.324 |
| 24 | 210.9052 | 11.3475 | 19.595 | 0.781 | 3.522 0.863 | -9.240 0.821 | 0.318 |
| 25 | 215.7512 | 6.6868 | 19.016 | 0.686 | 3.167 0.666 | -9.635 0.036 | 0.293 |
| 26 | 194.0119 | 18.7484 | 18.648 | 0.695 | 3.016 0.468 | -7.340 0.368 | 0.286 |
| 27 | 216.3491 | 10.2678 | 19.143 | 0.708 | 4.509 0.685 | -8.981 0.621 | 0.283 |
| 28 | 201.8017 | 15.1407 | 19.615 | 0.765 | 3.949 1.281 | -8.356 0.287 | 0.277 |
| 29 | 200.4833 | 16.7628 | 18.267 | 0.639 | 2.743 0.382 | -7.539 0.577 | 0.276 |
| 30 | 215.8864 | 6.4038 | 18.756 | 0.565 | 3.355 0.771 | -9.170 0.257 | 0.273 |
| 31 | 209.8048 | 10.4813 | 19.318 | 0.746 | 3.749 0.732 | -8.350 0.082 | 0.272 |
| 32 | 210.2689 | 12.6871 | 19.811 | 0.811 | 3.111 1.208 | -9.248 0.132 | 0.268 |
| 33 | 220.3115 | 7.1609 | 18.590 | 0.634 | 3.162 0.438 | -9.549 0.071 | 0.266 |
| 34 | 217.4034 | 6.8449 | 18.993 | 0.695 | 2.829 0.645 | -9.338 0.641 | 0.265 |
| 35 | 224.8610 | 4.9289 | 19.491 | 0.747 | 4.670 0.784 | -9.577 0.869 | 0.262 |
| 36 | 197.7927 | 16.3254 | 18.502 | 0.631 | 3.473 0.393 | -7.965 0.344 | 0.262 |
| 37 | 209.8688 | 11.0934 | 19.416 | 0.720 | 4.132 0.850 | -8.683 0.053 | 0.261 |
| 38 | 209.1230 | 13.0422 | 19.078 | 0.703 | 4.395 0.741 | -8.458 0.070 | 0.260 |
| 39 | 226.7971 | 6.8240 | 18.880 | 0.692 | 3.524 0.628 | -10.534 0.047 | 0.259 |
| 40 | 205.6701 | 14.1893 | 19.461 | 0.735 | 3.359 1.023 | -8.997 1.079 | 0.259 |
| 41 | 202.4636 | 15.4496 | 19.501 | 0.754 | 2.331 0.841 | -7.971 0.446 | 0.257 |
| 42 | 216.7714 | 9.6120 | 18.744 | 0.680 | 4.442 0.687 | -8.955 0.054 | 0.257 |
| 43 | 189.7340 | 20.4308 | 18.829 | 0.629 | 2.502 0.429 | -6.752 0.191 | 0.252 |
| 44 | 218.7209 | 8.8706 | 19.974 | 0.850 | 4.217 1.579 | -10.959 0.259 | 0.251 |
| 45 | 221.0086 | 6.6657 | 19.428 | 0.744 | 4.235 0.867 | -10.441 1.050 | 0.245 |
| 46 | 212.5012 | 11.5745 | 19.523 | 0.776 | 3.038 0.962 | -8.436 0.111 | 0.243 |
| 47 | 196.2040 | 17.9566 | 19.937 | 0.825 | 2.030 1.202 | -6.985 0.051 | 0.242 |
| 48 | 196.3534 | 18.0855 | 19.751 | 0.797 | 2.016 0.994 | -7.253 0.801 | 0.241 |
| 49 | 213.7135 | 10.4678 | 19.555 | 0.746 | 3.806 1.591 | -8.274 0.128 | 0.241 |
| 50 | 199.6213 | 16.5163 | 19.149 | 0.676 | 2.654 0.731 | -7.496 0.242 | 0.239 |