The Young Stellar Population of the metal-poor galaxy NGC 6822
Abstract
We present a comprehensive study of massive young stellar objects (YSOs) in the metal-poor galaxy NGC 6822 using IRAC and MIPS data obtained from the Spitzer Space Telescope. We find over 500 new YSO candidates in seven massive star-formation regions; these sources were selected using six colour-magnitude cuts. Via spectral energy distribution fitting to the data with YSO radiative transfer models we refine this list, identifying 105 high-confidence and 88 medium-confidence YSO candidates. For these sources we constrain their evolutionary state and estimate their physical properties. The majority of our YSO candidates are massive protostars with an accreting envelope in the initial stages of formation. We fit the mass distribution of the Stage I YSOs with a Kroupa initial mass function and determine a global star-formation rate of 0.039 . This is higher than star-formation rate estimates based on integrated UV fluxes. The new YSO candidates are preferentially located in clusters which correspond to seven active high-mass star-formation regions which are strongly correlated with the 8 and 24 m emission from PAHs and warm dust. This analysis reveals an embedded high-mass star-formation region, Spitzer I, which hosts the highest number of massive YSO candidates in NGC 6822. The properties of Spitzer I suggest it is younger and more active than the other prominent H ii and star-formation regions in the galaxy.
keywords:
Galaxies: individual (NGC 6822) – galaxies: photometry – galaxies: stellar content – galaxies: star-forming – Local Group – stars: formation – stars: pre-main sequence1 Introduction
NGC 6822 is an isolated gas-rich barred irregular galaxy in the Local Group. At a distance of kpc (Sibbons et al., 2012, 2015), it is the third-nearest dwarf irregular galaxy after the Large and Small Magellanic Clouds (LMC and SMC respectively); and has a metallicity comparable to that of the SMC (; Skillman et al. 1989; Lee et al. 2006; García-Rojas et al. 2016). Its proximity, low metallicity, and lack of known close companions (de Blok & Walter, 2000) makes NGC 6822 an ideal candidate for studying resolved stellar populations in an undisturbed system. We summarise the global properties of NGC 6822 in Table 1.
NGC 6822 has many prominent metal-poor H ii regions and OB associations (Efremova et al., 2011; Rubin et al., 2016; Schruba et al., 2017) which are actively forming massive stars. Despite these being amongst the brightest and most massive star-forming regions known, this isolated galaxy has a low global star-formation rate (SFR) of (Israel et al., 1996; Efremova et al., 2011), which appears to have been relatively consistent over the last 11 Gyr. Recently, the SFR has increased (Wyder, 2003; Cannon et al., 2012), particularly in the past 400 Myr (Gallart et al., 1996a; Clementini et al., 2003; Komiyama et al., 2003), with a burst of star formation in the bar 200 Myr ago (de Blok & Walter, 2000). The young stellar content of NGC 6822 appears mainly in a central bar structure (Schruba et al., 2017), which is orientated in a north-south direction in the inner part of the H i distribution, whilst the old- and intermediate-age population is elliptically distributed (Demers et al., 2006; Letarte et al., 2002), and dynamically decoupled from the H i envelope (Battinelli et al., 2006).
Despite detailed studies of the prominent star-forming regions in NGC 6822, its massive young stellar population has been more difficult to characterise on a global scale, and no global survey of its intermediate- to high-mass young stellar objects (YSOs) and how they relate to the galaxy’s gas and dust distributions have been conducted. In this paper we investigate the massive young stellar population of NGC 6822 to infer the properties of metal-poor star formation without the additional influence of tidal effects from any associated neighbours (as in the SMC). In Section 2 we describe the photometric data and how we selected the YSO candidates. Given the distance of NGC 6822 and the resolution of Spitzer, these candidates are unlikely to be individual sources, but proto-clusters which are dominated by the most luminous source (Chen et al., 2009; Oliveira et al., 2009; Ward et al., 2017). This technique has been effective in the LMC and SMC to identify embedded regions that are actively forming stars over the last 0.2 Myr, as apposed to other tracers e.g., H and UV emission from massive stars, which identify star-formation on 10 Myr timescales (Whitney et al., 2008; Sewiło et al., 2013). In Section 3 we perform spectral energy distribution (SED) fitting with YSO models and discuss the results in Sections 4 and 5. Finally, our conclusions are summarised in Section 6.
| Property | Value | References |
| Right ascension | 19 44 56.4 | |
| Declination | -14 48 04.5 | |
| Distance | Rich et al. (2014) | |
| Pietrzyński et al. (2004) | ||
| Position angle | deg | Weldrake et al. (2003) |
| Inclination | deg | Weldrake et al. (2003) |
| Systemic vel. | km s−1 | Koribalski et al. (2004) |
| E(B – V) | 0.21 | Schlafly & Finkbeiner (2011) |
| 12 + log(O/H) | García-Rojas et al. (2016) | |
| MV | -15.96 | Dale et al. (2007) |
| Madden et al. (2013) | ||
| Rémy-Ruyer et al. (2015) | ||
| Gas-to-dust ratio | 186 – 480 | Zubko et al. (2004) |
| Galametz et al. (2010) | ||
| SFR UV | 0.015 | Efremova et al. (2011) |
2 Photometric Data
2.1 Point Source Catalogues
There is excellent wide-field coverage of NGC 6822 in the optical to mid-IR. We use these deep, uniform photometric catalogues to produce a combined multi-wavelength data set from which we identify YSO candidates and assess potential contamination from other populations of sources.
Near-IR photometry covering an area of 3 deg2 was taken from Sibbons et al. (2012). They observed NGC 6822 with the Wide Field CAMera (WFCAM) on the 3.8 m United Kingdom Infrared Telescope (UKIRT). This data is complete to a depth of 19.5 mag in the -band and 18.7 in . In the mid-IR, NGC 6822 was observed with Spitzer Infrared Array Camera (IRAC) and Multiband Imaging Photometer for Spitzer (MIPS) as part of the Spitzer Infrared Nearby Galaxies Survey (SINGS; Kennicutt et al., 2003). This data covers the central 0.1 deg2 area of NGC 6822 and encompasses the optical emission from the galaxy to the R25 level (Cannon et al., 2006). This data was processed by Khan et al. (2015) using aperture photometry to generate a Spitzer point-source catalogue of 30,745 IRAC objects of which 7,268 had a MIPS 24 m counterpart.
The Spitzer data are matched to the near-IR () data via positional cross-matching using a radius of 1; the closest match was selected if multiple stars met this criteria. To ensure a high photometric reliability in the cross-matched catalogue only stars with standard errors less than 0.1 mag were included in the matching process. See Hirschauer et al in prep; Paper I for more details on the generation of the master catalogue. The initial cross-matched catalogue contains 30,745 sources in a 0.115 deg2 region. To construct a reliable list of YSO candidates we require that each source has valid fluxes in at least three of the five Spitzer bands or at least two of the three WFCAM bands and two Spitzer IRAC detections. We also remove objects from the catalogue without a 3.6 m or a 4.5 m flux and those that have magnitude uncertainties 0.2 mag, which leaves 23,908 sources, 78% of the initial catalogue.
2.2 Colour classifications
In order to identify candidate YSOs in NGC 6822 we adapt the successful methodology applied on a galaxy-wide scale by Whitney et al. (2008) and Sewiło et al. (2013) to Spitzer IRAC and MIPS data for the Magellanic Clouds (Meixner et al., 2006; Gordon et al., 2011). This strict multi-dimensional colour-magnitude selection criteria (using five or more different CMDs) developed from theoretical models and combined with spectral energy distribution (SED) fitting with YSO models was shown to be 80% reliable for complex populations and over 95% accurate in verified star-forming regions (e.g. Carlson et al., 2012) by Jones et al. (2017a). These selections separate YSO candidates from evolved stars and divide YSOs into two categories; a reliable candidate list and a possible YSO candidate list, based on their near- and mid-IR colours.
Our combined point-source catalogue contains a total of 30,745 stars, 14,486 of which have near-IR counterparts and 16,259 of which only appear in the mid-IR. Due to dust extinction, heavily embedded protostars may be too faint in the near-IR to be detected, and only mid-IR photometry can recover these sources. Out of the 20,999 reliable Spitzer sources in NGC 6822, 4,153 have a MIPS 24 m counterpart. These very red sources are indicative of young YSOs and are traditionally classified as Class I or Stage I sources (based on their IR spectral index or mass-accretion rates, respectively; Lada 1987; Robitaille et al. 2006).
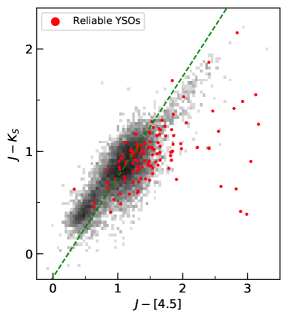
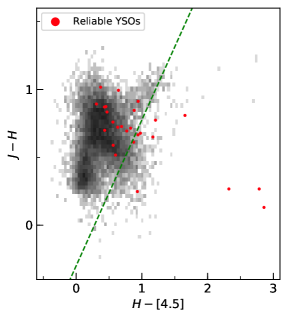
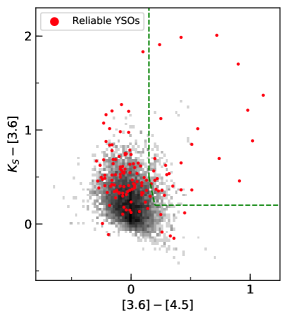
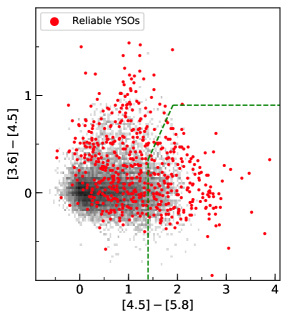
Figure 1 shows the stellar-density distribution of NGC 6822 in the six mid-IR CMDs used to select candidate YSOs. The CMDs are displayed as Hess diagrams, with brightness of each pixel corresponding to the number density of sources. Different populations can be identified in the CMDs. To select the YSO candidates, we first identify sources with an IR-excess. This red population (37% of the original catalogue) is comprised of YSOs, evolved stars, reddened stellar photospheres, and background galaxies, all of which can overlap significantly in colour-magnitude space. A series of colour-magnitude selection criteria, adjusted for the distance to NGC 6822, given in Equations 7–39 and shown graphically in Figure 1 are then used to isolate sources in regions of colour-magnitude space occupied predominantly by YSOs and remove contaminating sources. We do not correct the colours for reddening due to dust along the line of sight since, at mid-IR wavelengths, the reddening is small. To account for the difference in distance between the SMC and NGC 6822 we adjust the boundaries of the magnitude cuts from Sewiło et al. (2013) to be 4.39 mag fainter. For NGC 6822 we adopt a distance modulus of mag (Pietrzyński et al., 2004). Similarly, we adopt mag for the SMC (de Grijs & Bono, 2015).
Altering the faint-source limit in the mid-IR selection criteria may result in the selection of sources in the galaxy-dominated region of the CMD. We test this by comparing the distance-adjusted cuts from Whitney et al. (2008) and Sewiło et al. (2013) to the source densities in the respective Hess diagrams. For the and CMDs the adjusted colour selection becomes unreliable at faint magnitudes due to the large overlap YSOs in NGC 6822 have with the general and background populations. To ensure a reliable selection of candidate YSOs, we increase the faint-source limits for these CMDs to minimise contamination, at the cost of reduced completeness.
| (7) |
| (13) |
| (17) |
| (23) |
| (32) |
| (39) |
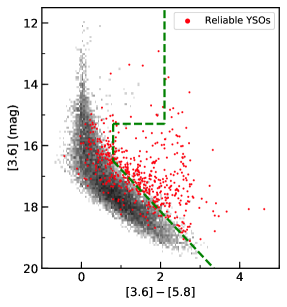
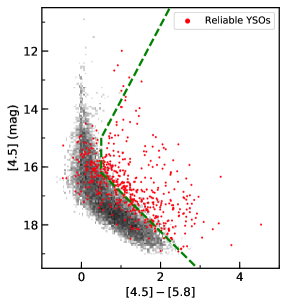
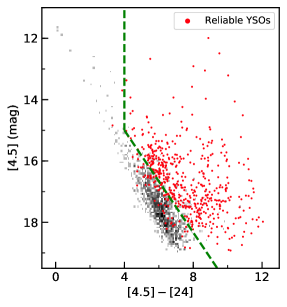
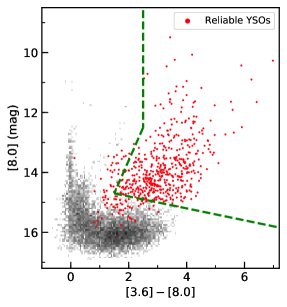
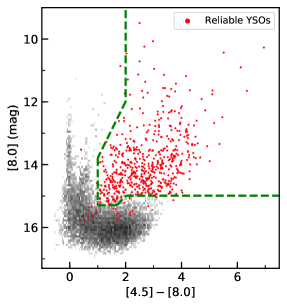
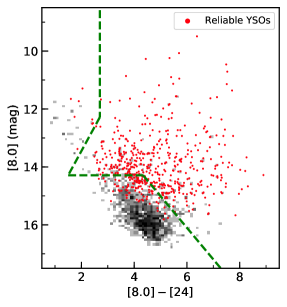
Mid-IR colours with longer photometric baselines (e.g. [3.8]-[8.0], [4.5]-[8.0] and [8.0]–[24]) are best at separating YSOs into a distinct group. In these bands YSOs appear extremely red as their SEDs rise steeply toward longer wavelengths. The 24 m data point helps constrain the long-wavelength shape of the SED and therefore the luminosity of the sources. Short baselines are less effective; colours of YSOs may mirror those exhibited by dust features from other classes resulting in a degeneracy or, in some instances, be masked by the noise for faint sources.
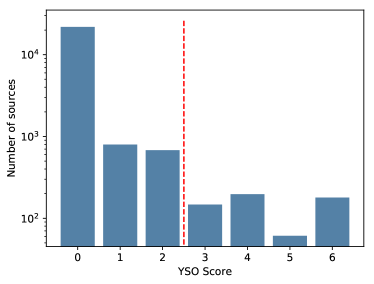
We assign each source a colour score based on the total number of CMDs in which it meets the YSO colour-criteria, the distribution of scores in shown in Figure 2. Sources with a score of three or more are ‘reliable’ YSO candidates; this selection contains 584 sources. We consider the 680 sources with a score of two to be ‘possible’ YSO candidates. Tables 2 and 3 contains the list of positions, , IRAC, and MIPS [24] magnitudes, and uncertainties for the 584 reliable YSO candidates in NGC 6822. These have been separated into a high-confidence and a medium-confidence YSO list based on their SED fit in Section 3.2.
Our data are only sensitive to massive (8) sources, so the YSO sample included in this work is not complete, due to decreasing completeness of the Spitzer data with increasing wavelength. Colour-magnitude selections are biased towards brighter sources, as these have both a cleaner separation for low-luminosity background galaxies in the CMDs and better S/N ratios. Multiple colour criteria can be utilised to assign a classification, making the identification more reliable. Moreover, relying on mid-IR selection criteria biases our YSO candidate list towards young, embedded sources of intermediate and high mass at the initial stages (Stage I and II ) of formation (Whitney et al., 2008). More evolved (Stage III) YSOs, which have hot central objects, have a greater degeneracy in colour-magnitude space (e.g., between YSOs, evolved stars, and galaxies), which cannot be resolved with broad band infrared photometry.
| YSO | R.A. | Dec. | WFCAM | WFCAM | WFCAM | IRAC | IRAC | IRAC | IRAC | MIPS | CMD | PAH | Stellar | Cluster |
|---|---|---|---|---|---|---|---|---|---|---|---|---|---|---|
| ID | [3.6] | [4.5] | [5.8] | [8.0] | [24] | score | enhancement | photosphere | ||||||
| 162 | 296.1993 | -14.8757 | -99.99 | -99.99 | -99.99 | 17.92 | 17.83 | 16.22 | 14.57 | 7.09 | 4 | 1 | 0 | 2 |
| 179 | 296.2022 | -14.7391 | -99.99 | -99.99 | -99.99 | 17.09 | 17.13 | 15.61 | 14.50 | 8.95 | 6 | 1 | 0 | -1 |
| 188 | 296.2046 | -14.7163 | -99.99 | -99.99 | -99.99 | 15.91 | 15.44 | 13.48 | 11.67 | 8.93 | 6 | 1 | 0 | 3 |
| 189 | 296.2046 | -14.8818 | -99.99 | -99.99 | -99.99 | 17.89 | 18.05 | 15.67 | 13.85 | 7.70 | 6 | 1 | 0 | 2 |
| 191 | 296.2054 | -14.8830 | -99.99 | -99.99 | -99.99 | 16.99 | 16.54 | 14.41 | 12.90 | 6.56 | 6 | 1 | 0 | 2 |
| YSO | R.A. | Dec. | WFCAM | WFCAM | WFCAM | IRAC | IRAC | IRAC | IRAC | MIPS | CMD | PAH | Stellar | Cluster |
|---|---|---|---|---|---|---|---|---|---|---|---|---|---|---|
| ID | [3.6] | [4.5] | [5.8] | [8.0] | [24] | score | enhancement | photosphere | ||||||
| 1 | 296.0293 | -14.6865 | 19.31 | 18.87 | 18.05 | 17.16 | 16.14 | 15.31 | 14.02 | 10.02 | 6 | 0 | 0 | -1 |
| 7 | 296.0566 | -14.8798 | -99.99 | -99.99 | -99.99 | 17.01 | 16.05 | 15.69 | 15.36 | 9.88 | 3 | 0 | 1 | -1 |
| 9 | 296.0590 | -14.7746 | -99.99 | -99.99 | -99.99 | 18.77 | 18.82 | 16.30 | 14.82 | 11.30 | 4 | 1 | 0 | -1 |
| 11 | 296.0663 | -14.9373 | -99.99 | -99.99 | -99.99 | 16.82 | 15.80 | 15.40 | 14.55 | 10.07 | 4 | 0 | 1 | -1 |
| 15 | 296.0681 | -14.7610 | -99.99 | -99.99 | -99.99 | 17.36 | 16.78 | 15.90 | 14.87 | 10.67 | 3 | 0 | 0 | -1 |
| R.A. | Dec. | WFCAM | WFCAM | WFCAM | IRAC | IRAC | IRAC | IRAC | MIPS | CMD | PAH | Stellar |
|---|---|---|---|---|---|---|---|---|---|---|---|---|
| [3.6] | [4.5] | [5.8] | [8.0] | [24] | score | enhancement | photosphere | |||||
| 296.1919 | -14.9305 | 18.16 0.06 | 17.53 0.05 | 17.39 0.06 | 17.12 0.09 | 17.21 0.12 | 15.86 0.07 | 16.15 0.15 | 12.70 -99.99 | 2 | 0 | 0 |
| 296.1927 | -14.9303 | 16.94 0.02 | 16.28 0.02 | 16.22 0.02 | 15.98 0.04 | 15.97 0.04 | 15.05 0.07 | 15.81 0.14 | 12.44 -99.99 | 2 | 0 | 0 |
| 296.1930 | -14.9311 | -99.99 -99.99 | -99.99 -99.99 | -99.99 -99.99 | 18.15 0.13 | 17.68 0.13 | 15.82 0.14 | 16.16 0.13 | 12.10 0.25 | 2 | 1 | 0 |
| 296.1945 | -14.9341 | -99.99 -99.99 | -99.99 -99.99 | -99.99 -99.99 | 18.04 0.12 | 18.28 0.16 | 16.02 0.11 | 15.9 -99.99 | 12.53 0.29 | 2 | 1 | -99.99 |
| 296.1948 | -14.8460 | 19.73 0.23 | 18.81 0.16 | 17.53 0.07 | 17.17 0.07 | 16.66 0.04 | 16.19 0.08 | 13.99 0.07 | 10.87 0.07 | 3 | 0 | 1 |
In this analysis we include Spitzer sources that have no valid MIPS 24 m photometry. Sources with low-quality photometry identified near the detection limits for the Spitzer [5.8], [8.0] and [24] data may also be unreliable due to the distance. Instead, we use near-IR and IRAC 3.6 and 4.5 m data to recover low signal-to-noise sources and retrieve candidate YSOs at an advanced stage of formation. To compensate for the relative drop in sensitivity in the red IRAC and MIPS bands at the distance of NGC 6822, we apply additional selection criteria to sources with at least two detections in , that have IRAC 3.6 and 4.5 m data with photometric uncertainties mag, and with no reliable [8.0] and [24] data. This ensures that we are not excluding likely YSOs in our previously unclassified objects. Sources with an IR excess were first identified using equation 45. A bright-source limit of is then imposed to remove background galaxies. Finally, we apply the colour cuts proposed by Gutermuth et al. (2009) and Koenig & Leisawitz (2014) to identify possible YSOs using only their vs. and vs. colours. The selection criteria is given in Eqs. 48 and 54. In total, we identified 131 YSO candidates which were missed by our mid-IR selection criteria.
| (45) |
| (48) |
| (54) |
The spatial distribution of the possible YSO candidates is more uniformly distributed than the high- and medium-confidence YSO candidates, which is indicative of contamination from background galaxies and field stars with ambiguous colours. To improve the reliability of candidate YSOs identified without a 5.6 m, 8 m or 24 m flux, we require the possible YSOs to be spatially correlated with a star-forming region in NGC 6822, or an area of diffuse H emission (see section 5.1). As other nearby star-forming galaxies show that YSOs are not randomly distributed, but in fact are highly clustered near the sites of their formation (Krumholz et al., 2018). Clusters in the possible YSO candidate list were identified using the density-based spatial clustering of applications with noise (DBSCAN) algorithm (Ester et al., 1996). Points within a cluster can reasonably be regarded as a possible YSO candidate, while a noise point is probably a background galaxy, field star or other contaminant, and is excluded from our list. Table 4 lists the final selection of 584 possible YSO candidates in NGC 6822 star-forming regions, identified from the near-IR or with a mid-IR colour score of two. Candidates excluded from the YSO SED fitting on the basis of insufficient data points, disjointed SEDs, or the presence of a possible stellar photosphere (see Section 2.3) are also included in this category.
2.3 Removing contaminants
Despite efforts to eliminate contamination from other populations using our extensive colour selections, some level of contamination is to be expected in the YSO sample. At the distance of NGC 6822, unresolved background galaxies, including active galactic nuclei (AGN) and star-forming galaxies, have mid-IR colours that overlap significantly with YSOs. Magnitude-based cutoffs which are very effective at selecting YSOs in the Magellanic Clouds are less efficient in more distant galaxies like NGC 6822 due to the lower luminosity of the population. To estimate a conservative upper limit for galaxy contamination, we assume that unresolved galaxies are faint and evenly distributed across the field. We select a 4.32 arcmin2 area on the outskirts of the galaxy away from known star-formation regions to estimate the approximate level of background contamination in our YSO cuts. This region has a total point-source density of 37.04 sources/arcmin2 and a reliable YSO candidate density of 0.23 sources/arcmin2, which corresponds to a 15% contamination level in our global YSO candidate list. The estimated contamination level for each colour selection is given in Table 5. As this region still contains NGC 6822 member sources and is within the H i disk, however, it is possible that we have overestimated the extent of this extragalactic contamination.
| CMD | Number of colour | Max. contamination |
|---|---|---|
| selected YSOs | (percent) | |
| vs. [3.6]–[5.8] | 787 | 49.2 |
| vs. [3.6]–[8.0] | 639 | 15.2 |
| vs. [4.5]–[5.8] | 875 | 55.4 |
| vs. [4.5]–[8.0] | 897 | 21.6 |
| vs. [4.5]–[24] | 911 | 10.6 |
| vs. [8.0]–[24] | 654 | 14.8 |
| Reliable catalogue | 584 | 16.6 |
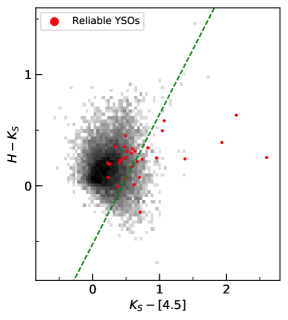
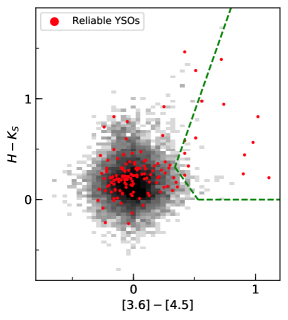
YSOs are typically found in regions with emission from PAH molecules and dust grains, which can contaminate the Spitzer fluxes. Diffuse emission from PAHs affects the 3.6, 5.8, and 8.0 m Spitzer IRAC bands. The [3.6]–[4.5] vs. [4.5]–[5.8] colour-colour diagram (CCD) shown in Figure 3 can be used to assess contamination from PAH emission in our sample (e.g. Carlson et al., 2012). Sources in the presence of the strong PAH emission occupy a distinct area in the CCD which extends towards the lower-right and are outlined by a dashed line in Figure 3. We note these PAH-enhanced sources in Tables 2, 3, and 4. Conversely, no known globular clusters display active star formation. There are three known globular clusters in our FOV, Hubble VII, SC3, and SC6 (Veljanoski et al., 2015), listed in Table 6. We identify two YSO candidates within their half-light radii and remove them from our sample.
| ID | RA | DEC | (pc) |
|---|---|---|---|
| Hubble-VII | 19 44 55.8 | -14 48 56.2 | 2.5 |
| SC3 | 19 45 40.2 | -14 49 25.8 | 7.5 |
| SC6 | 19 45 37.0 | -14 41 10.8 |
Resolution limitations of Spitzer can confuse the colour selection. At the distance of NGC 6822, source confusion and flux enhancements in our catalogues are a limitation of our data. Star-forming regions are inherently crowded, and our catalogue is both crowding- and magnitude-limited. The aperture diameter of MIPS (6′′ corresponds to pc at our adopted distance) is considerably larger than the FWHM of the IRAC 3.6 m PSF (pc), which is larger still compared to the data. Rather than isolated sources, a single YSO data point is likely to contain multiple objects and even entire star-formation clusters that make up a local surface density enhancement. These Spitzer fluxes are dominated by the most massive object in the protoclusters, owing to the steep mass-luminosity relation (Seale et al., 2009; Oliveira et al., 2013). Multiple sources within a single data point likely belong to the same cluster, however it is also possible that other emission may also contaminate the beam resulting in a flux enhancement.
Sources with spectral energy distributions (SEDs) that rise from 8 to 24 m are typically YSOs, compact H ii regions, unresolved background galaxies, or planetary nebulae (PNe). Visual inspection of the YSO candidates’ SEDs reveal a significant number of sources with both a stellar photosphere component and an infrared excess component not directly associated with the point-source. This can be explained by the limited resolution of the mid-IR imaging detecting stars embedded within larger ISM structures in the longer-wavelength images or multiple sources in the beam. This can be especially problematic in star-formation regions.
To ensure only photometry associated with one astronomical object is included in our analysis of each YSO SED and our cross-matched data belongs to a red point-source or compact cluster, we fit SEDs of the YSO candidates with a grid of Kurucz atlas9 model atmospheres from Castelli & Kurucz (2003), using the Robitaille et al. (2007) SED fitting tool (see Section 3.2), and remove sources that are well fitted by a stellar photosphere. Before SED fitting, we inspect each individual SED and discarded sources with the following criteria: too few valid data points (5 bands) in the combined catalogue; disjointed SEDs due to a mismatch between catalogues; sources with fewer than three Spitzer detections; and sources without an 8 or 24 m detection, such that the fitting can be better constrained. 518 sources (89%) of the colour-selected YSO sample meet these criteria. During the fitting procedure for the stellar photospheres, both the 8 and 24 m fluxes were treated as upper limits, to account for possible enhancements from PAH emission and warm dust in the large MIPS beam, respectively. Figure 4 shows example fits to the candidate YSO SEDs by the model photospheres. In total, we have removed 305 YSO candidates during this process, and flagged a further 20 as potential contaminants, leaving 213 sources.
Finally, we searched the SIMBAD and VizieR Astronomical Databases using the CDS X-Match Service111http://cdsxmatch.u-strasbg.fr/##tab=xmatch to check if any of the YSO candidates are associated with a known astronomical object. 89 of the high confidence YSO candidates were matched within a 2 radius. Of these sources, five have a spectroscopic classification; 73 had a literature classification indicative of youth, e.g., H-emitting objects, CO-bright clumps, compact H ii source, or location in a star-formation region (Massey et al., 2007; Schruba et al., 2017; Hernández-Martínez & Peña, 2009; Melena et al., 2009); three had multiple conflicting classifications; whilst the remaining seven sources were matched to a candidate AGB star, identified from optical or near-IR colours (Sibbons et al., 2012; Whitelock et al., 2013; Kang et al., 2006; Letarte et al., 2002). In total, 10 % of our colour selected YSO candidates have a conflicting classification to our own.
Evolved stars can have significant IR emission due to circumstellar dust. In general, AGB stars are more luminous than YSOs and have colours which are not quite as red. Only the most extreme AGB stars which are surrounded by a significant amount of dust, for instance OH/IR stars, have colours similar to YSOs in the mid-IR. In metal-poor galaxies like NGC 6822, these objects are rare (Jones et al., 2015, 2018) and thus are unlikely to pose a significant level of contamination to our YSO lists. We do not exclude any source with a literature classification which is based solely on colour-magnitude cuts, as YSOs and AGBs are easily confused in optical and near-IR colour space.
Rather surprisingly, a spectroscopically confirmed Red Giant (Kirby et al., 2017) is matched to one of our YSO candidates. This is probably a result of a superposition of sources; one optically bright and one IR bright in this crowded field.
Unlike AGB stars, unresolved planetary nebulae (PNe) are potentially a source of significant contamination in our YSO sample. They have mid-IR Spitzer colours which are indistinguishable from YSOs and spectroscopic data are needed to segregate these objects (Jones et al., 2017a). There are currently 26 known PN candidates in NGC 6822, most of them located along the optical bar Hernández-Martínez & Peña (2009). Indeed, our literature search finds that four spectroscopically confirmed planetary-nebular and three PNe candidates identified via their [O iii] 5007/H flux ratio (Hernández-Martínez & Peña, 2009; García-Rojas et al., 2016) are included in our YSO candidate list. We exclude them from further analysis.
3 Radiative transfer modelling of YSO candidates
YSOs can be classified according to their evolutionary stage based on the physical properties of their circumstellar dust distribution (Robitaille et al., 2006) rather than the observational characteristics of its SED (Lada, 1987). To determine the evolutionary stage and physical properties of our YSO candidates, we fit their SED with the grid of radiative transfer models developed by Robitaille et al. (2006); Robitaille (2017) hereafter \al@Robitaille2006, Robitaille2017; \al@Robitaille2006, Robitaille2017 respectively.
3.1 YSO model grids
3.1.1 Robitaille et al. (2006) Model Grid
The axisymmetric YSO model grid of R06 spans a range of different stellar, disk, and envelope properties at 10 inclination angles, resulting in a set of 200,000 model SEDs. These models were computed using the Whitney et al. (2003a, b) radiative transfer code for a central stellar mass between 0.1 – 50 with an age between 103 – 107 yr. The pre-main-sequence stars have varying combinations of circumstellar geometry including a flared accretion disk and an infalling, rotationally-flattened envelope which can include cavities carved out by a bipolar outflow. In total, 14 stellar and circumstellar dust geometry parameters are varied to produce the model grid. These include: stellar luminosity, temperature, disk mass, radius, inner radius, envelope infall rate, and bipolar cavity opening angle. Thus these YSO models include the youngest, most embedded YSOs at the early stage of envelope infall to the late disk-only stage and ultimately pre-main-sequence stars with little or no dusty disk. Fits with the R06 models can then be directly compared to star-formation results for the LMC and SMC (Whitney et al., 2008; Chen et al., 2010; Carlson et al., 2012; Sewiło et al., 2013).
3.1.2 Robitaille et al. (2017) Model Grid
The R17 models are a set of eighteen different YSO model grids of increasing complexity. In these models the central protostellar source may be associated with a disk, a circumstellar infalling envelope, bipolar cavities, and an ambient medium. Each SED was computed for nine viewing angles using a random stratified sampling between 0∘ and 90∘. The dust properties are the same for all models and do not include polycyclic aromatic hydrocarbon (PAH) emission. The simplest model has two free parameters: a stellar radius and an effective temperature , which defines the central irradiating source. Conversely, the most complex set of models, which includes all possible physical components, has twelve free parameters. These parameters have been uniformly sampled and do not introduce correlations, at the cost of some parameter combinations being nonphysical. For more details on each component in the models and their free input parameters, we refer the reader to R17.
3.2 SED Fitting procedure
We use a Python-based SED-fitting tool222https://sedfitter.readthedocs.io/en/stable/index.html (Robitaille et al., 2007) to fit the large set of YSO models to the photometric data, as this accounts for errors in the distance to the source, the effects of interstellar extinction (), and aperture size. As before we assume a distance to NGC 6822 of 490 kpc with a error of 8%. Prior to fitting, photometric uncertainties in each band were adjusted so that a lower limit of 10% on the observed flux was introduced, in order to account for variability (e.g. Morales-Calderón et al., 2011; Günther et al., 2014) and other systematic and calibration errors in the data. The models were fitted to the near-IR and Spitzer photometry of all our YSO candidates listed in Tables 2 and 3, providing they meet the photometric-quality criteria listed above.
PAH emission is not accounted for in the models. Sources contaminated by PAHs along the line of sight have a distinctive dip at 4.5m in their SEDs, the intensity of which depends on the strength of the PAH emission. In total, 117 SEDs have IRAC data which is clearly affected by emission from PAHs; only the [4.5] band is unaffected (Churchwell et al., 2004), and should be assigned a higher weight in the fitting. To account for this we adopt the PAH correction method employed by Carlson et al. (2012) and increase the error bars to 20%, 10%, 30%, and 40% in the 3.6, 4.5, 5.8, and 8.0 m bands to fit sources with significant PAH contributions.
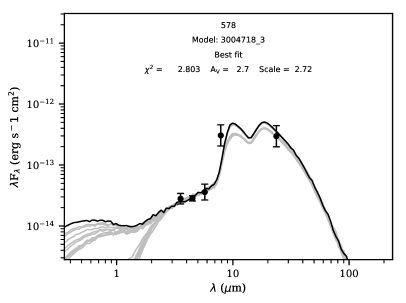
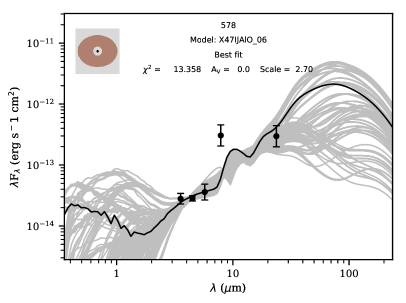
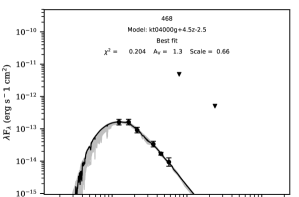
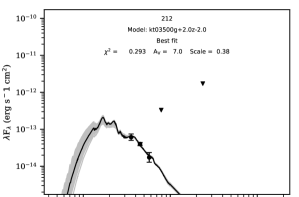
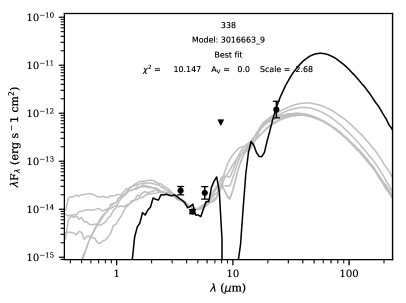
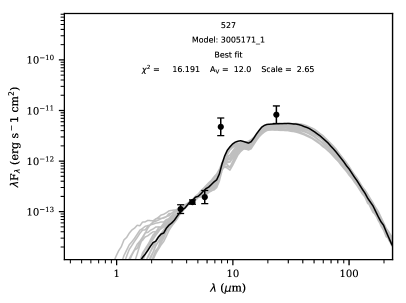
55% of the candidate YSOs were satisfactorily fit by the YSO models. We consider these sources to be ‘high-confidence’ YSO candidates. Figure 5 displays the SEDs and model fits to some example sources selected to illustrate the range of YSO parameters spanned by our sample at different evolutionary stages. Given the model complexity and the number of input parameters, there is degeneracy in the model output. Several models can produce a valid and almost equally good fit to the data; to prevent over-fitting, we consider the YSO models with the lowest values and use these to estimate the median absolute deviation uncertainty in the best-fit model parameters. For each source and model set, we identify the model with the lowest reduced , namely which determines the YSOs best-fit parameters. A set of ‘good’ fits is then defined as those with . The range in these model parameters is used to test the sensitivity of the fit to variation in the input parameters and ultimately quantify the error in the best-fit values. Table 7 lists the best-fit value, its median absolute deviation of each parameter of the good fits for each source. For the R17 models these parameters were determined from the most probable model set, which provides the most reasonable fits to the data.
As our fitting procedure involves comparing each source to a large set of model templates, it is possible that some of the combinations of parameters may be nonphysical. We filter out any YSO model outside of the parameter space covered by the PARSEC evolutionary tracks (Chen et al., 2015; Tang et al., 2014). Furthermore, if several models with vastly divergent properties provide a good fit we may not be able to produce strong constraints on the parameters and hence the nature of the object. In such a situation, we determine which model is most likely based on the complexity required to fit the data and the fraction of models with those properties that provide a good fit to the object’s SED.
In some instances, the SEDs of the YSO candidates are adversely affected by the size of the physical aperture at the distance of NGC 6822. Consequently, obtaining a high-quality SED fit to the data by the theoretical YSO models is challenging. Incomplete sampling of the SEDs, a bad data point, or unresolved protoclusters masquerading as a single object in environments of illuminated dust may produce poor fits to sources likely to be a YSO. For many sources the fit is poorly constrained at 8 m (even when the PAH correction method is employed) due to strong contamination by the 7.7 m PAH emission complex. This is also complicated by the models having a single dust composition and parameters optimised for solar metallicities. For instance, in metal-poor star formation the silicate dust is likely to be oxygen deficient (Jones et al., 2012), which may also affect the fit to the IRAC 8.0 m data point.
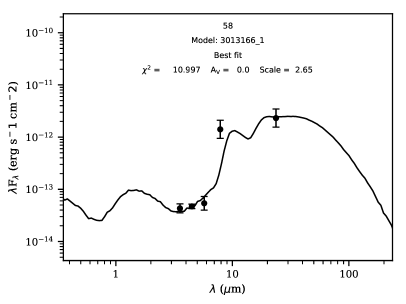
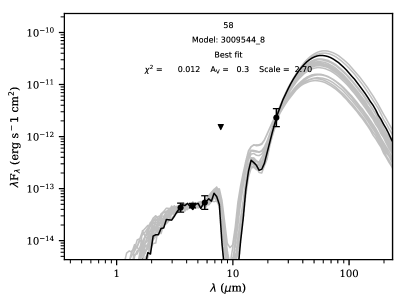
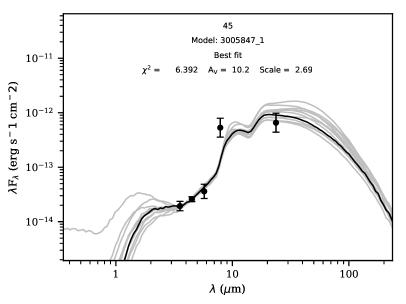
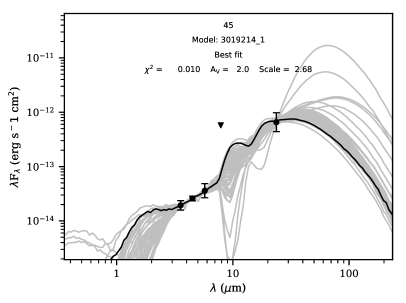
To quantify how the 8 m data affect the quality of the fits for the YSO candidates, we compare the SED fits where the 8 m data is treated as an upper limit to fits obtained with increased error bars. Figure 7 compares the SED fits using both methods for two example sources. For Source 58 the difference in the best-fit model properties using the two methods is appreciable, whilst little change is seen between the model parameters for Source 45. In each instance, fitting the data points where the 8 m fluxes are considered an upper limit results in a substantial improvement to the quality of the fit and a lower YSO mass estimate. Consequently, all sources flagged as contaminated by PAHs in the [3.6]–[4.5] vs. [4.5]–[5.8] CCD have their 8 m flux set as an upper limit in the SED fitter input. This method is not appropriate if the flux at 24 m is unconstrained.
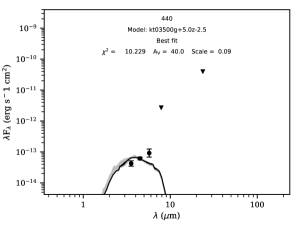
It is probable that some legitimate YSO sources have been excluded from our ‘high-confidence’ list due to their modest YSO model fits. Examples of ‘medium-confidence’ YSOs with poor SED fits are given in Figure 8. We consider sources to be ‘medium-confidence YSOs’ if they have a high YSO colour score and an SED shape indicative of a YSO (Lada, 1987). These sources typically have a in the range 10 to 15. The 13 YSO-candidates which have both good fits by the YSO models and stellar photosphere models are also assigned to this category, leaving 105 high-confidence and 88 medium-confidence sources.
4 Results
4.1 The physical properties of the high-confidence YSO candidates
The results of the R06 SED model fits to the high-confidence YSO candidates are given in Table 7. Only selected physical parameters of the best-fit models are listed to prevent over-interpretation. These are: the total luminosity ( and stellar mass (), as well as their median absolute deviations. The evolutionary stage, number of well-fit models, and the best fit is also given. For comparison, the best R17 model set (which outlines the model components present), the number of best-fit models from the most-likely model set, the best-fit stellar radius (), effective temperature (), and the luminosity for the high-confidence YSO candidates are listed in Table 8.
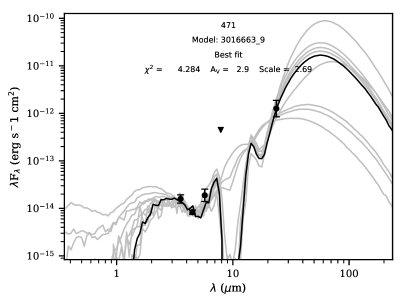
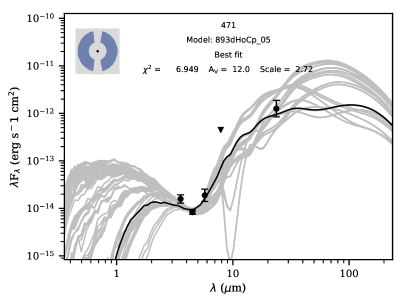
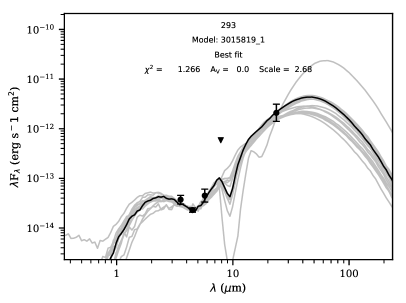
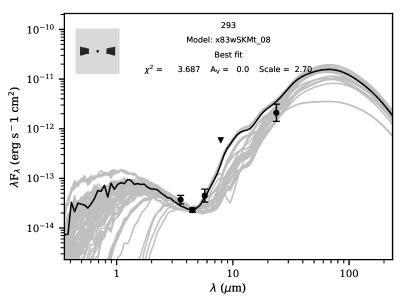
Figure 5 shows the difference in the best-fit models to three sources using the R06 and R17 model grid. These three sources represent the Stages I–III in a YSOs evolution. Using both sets of models, which have their own advantages and drawbacks, allows us to draw comparisons to previous works using the R06 models, place stronger constraints on the error associated with the YSO properties, and restrict correlations between parameters which were present in the R06 models. For instance, the R06 values for the envelope accretion rate and disk mass are used to determine an evolutionary stage, these values can have large uncertainties and may correlate with the stellar mass, whilst the R17 models take a Bayesian approach, and the model components present in the best set determines the evolutionary stage of the source. Source 471 shown in the middle panel of Figure 5 is a good example of why one model set was not preferred to the other; it appears to have very different SED fits using the two sets of models, however both YSO evolutionary stages derived from the fitting are in agreement with each other, increasing the confidence in our derived pre-main sequence evolutionary stage.
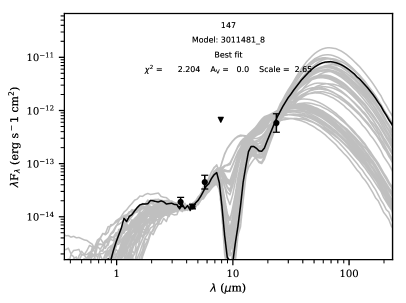
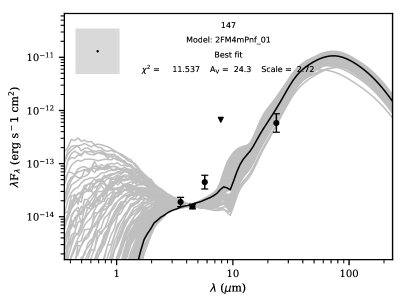
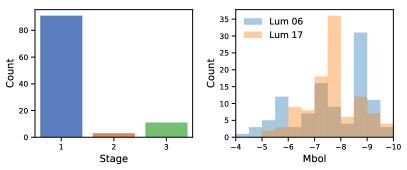
The YSO fitting provides estimates of the YSOs’ evolutionary stage. Embedded Stage I sources have ; the more evolved Stage II sources have and an optically thick disk ; Stage III YSOs in the later stages of pre-main-sequence evolution have and . Figure 9 shows the distribution of evolutionary stages for our high-reliability YSO candidates. In total, 91, 3, and 11 stars in NGC 6822 are classified as Stage I, II, and III YSO candidates, respectively. For the R17 models we use the presence of an envelope and/or disk in the best-fitting model set to estimate the YSOs evolutionary stage. Our sample preferentially detects young embedded (Stage I) sources, compared to Stage II and III sources as younger sources are bright in the mid-IR compared to YSOs identified via blue tracers (e.g. UV, H). Generally the stage returned by both model sets is consistent, however for Source 147 shown in Figure 6, the best-fit R17 model-set was a star plus ambient ISM rather than a Stage I object returned using the R06 models.
In NGC 6822, our YSO candidates are probably embedded star-forming clusters, as resolution limitations prevent us isolating individual sources. These clusters will have a range of YSO properties, resulting in the blending of the individual model parameters. For instance, for the circumstellar dust geometry, the disk-flaring angle and scale-height are poorly constrained. This can affect the derived disk mass, envelope accretion rate, and hence the evolutionary stage of the source. Given the limitations of our data, and given that the most-massive and most luminous source in any unresolved cluster dominates the total radiative output, treating the Spitzer YSO candidates as single massive objects is a reasonable approximation and the aggregate properties listed in Tables 7 and 8 are a good estimation.
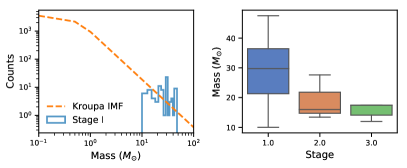
The stellar luminosity is the most robust parameter obtained from the model fits. From this and the effective temperature (), a stellar mass () and age () can be obtained assuming a pre-main-sequence evolutionary track. For the R06 models this is pre-computed, whilst the R17 models allow the user to specify their own evolutionary track. For these models we must also calculate the YSO’s luminosity using the Stefan-Boltzmann law, and the best-fit stellar radius () and effective temperature. The total luminosity of the well-fit YSOs is 1.6 0.2 . Figure 9 shows the derived luminosity from the R06 and R17 models and mass distribution of our high-confidence YSO candidates derived from the SED fitting. In general, the luminosities derived using the R17 models are lower than the R06 models. This is due to the better treatment of emission at long-wavelengths in the R17 models and the improved sampling in parameter space. Approximately 25 % of our sample have an average mass greater than 15. From the shape of the histogram we expect our sample to have the highest completeness for the 15 – 35 mass range. Our sample of YSOs is incomplete for low-mass sources due to our selection criteria employed to produce a reliable sample of YSO and limitations in sensitivity and resolution of our data. High-mass sources may also be missing, as multiple high-mass stars in proto-clusters will be detected as a single massive source within the IRAC and MIPS PSF. We therefore expect our Spitzer data for each source to encompass multiple YSOs at similar evolutionary stages, with a dominant component arising from the most massive source in the proto-cluster (e.g Oliveira et al., 2013; Ward et al., 2017). YSO model fits to these unresolved clusters overestimate the mass of the most massive YSO, but underestimate the total mass of all the YSOs in the beam (Chen et al., 2010). Thus the mass estimates have large uncertainties and should be viewed as a lower limit as we assume single sources.
| Source | R.A. | Dec. | nfits | err. | err. | Stage | |||
|---|---|---|---|---|---|---|---|---|---|
| 10 | 296.0626 | -14.820 | 7.00 | 744 | 14 | 1 | 17300 | 5400 | 3 |
| 16 | 296.0697 | -14.839 | 4.04 | 713 | 10 | 5 | 18600 | 7250 | 1 |
| 20 | 296.0714 | -14.888 | 7.03 | 1358 | 12 | 1 | 10900 | 5090 | 3 |
| 25 | 296.0775 | -14.881 | 0.70 | 1782 | 16 | 4 | 15400 | 30100 | 1 |
| 28 | 296.0806 | -14.964 | 1.52 | 2470 | 20 | 6 | 73100 | 54400 | 1 |
| Source | R.A. | Dec. | Model | err. | err | err. | ||||
|---|---|---|---|---|---|---|---|---|---|---|
| Set | set | |||||||||
| 10 | 296.0626 | -14.820 | s-u-smi | 240 | 28.33 | 16 | 13220 | 2950 | 21990 | 10820 |
| 16 | 296.0697 | -14.839 | s-u-smi | 172 | 6.46 | 27 | 29860 | 15840 | 29750 | 29920 |
| 20 | 296.0714 | -14.888 | s-u-smi | 113 | 72.62 | 28 | 6700 | 7320 | 39570 | 12460 |
| 25 | 296.0775 | -14.881 | s-u-smi | 254 | 29.91 | 20 | 17920 | 3580 | 82770 | 22160 |
| 28 | 296.0806 | -14.964 | s—smi | 122 | 95 | 31 | 11730 | 1460 | 153880 | 50475 |
5 Discussion
5.1 Spatial Distribution and Comparison to Gas and Dust Tracers
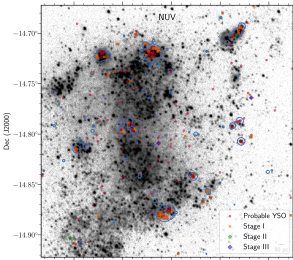
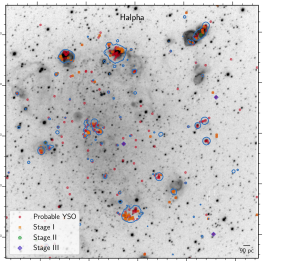
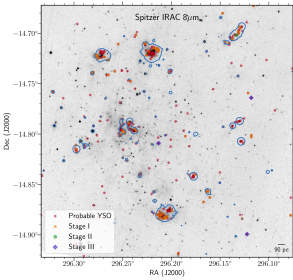
The spatial distribution of the YSO candidates is overlaid on the near-ultraviolet (near-UV) (Hunter et al., 2010; Zhang et al., 2012), H (Hunter & Elmegreen, 2004) and IRAC 8 m (Kennicutt et al., 2003) images in Figure 10. The blue contours in the figure correspond to a 5 MIPS 24 m detection. The 8 m emission primarily originates from PAH molecules which trace diffuse extended structure in photodissociation regions (PDRs). The 24 m surface brightness traces warm dust associated embedded star-formation, whilst the H and photospheric UV emission reveals unobscured young, massive stars and hence a more advanced epoch of star-formation. NGC 6822 has not been mapped in CO, however there is a close correlation between CO and 8 m emission on large scales (Gratier et al., 2010; Schruba et al., 2017). Thus the IRAC 8 m image is an effective tracer of molecular gas in the galaxy, particularly at low metallicity (Regan et al., 2006; Sandstrom et al., 2012; Cortzen et al., 2019). This emission is relatively high in diffuse regions and low in high-UV environments. In NGC 6822 the 24 m emission is not co-spatial with the H emission. The YSO candidates tend to be located in the densest regions of 24m flux, whilst the H images show some evidence for YSO candidates located along ridges or in the shells of bubbles. Indicating that star formation in these regions may have been triggered by previous generation of massive star formation.
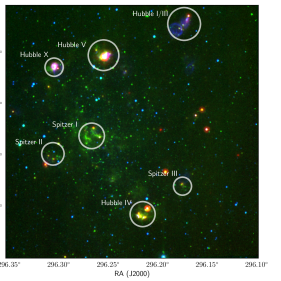
There is a strong degree of clustering which coincides with the major star-forming regions: Hubble X, V, IV, III and I, and two newly discovered embedded star formation regions we dub Spitzer I and II, which are located in the centre and to the centre-east of the bar. To quantify the number of star-formation regions in the galaxy, the number of sources associated with each region, and the radius of the semi-major axis for the region, we use the density-based spatial clustering of applications with noise (DBSCAN) clustering algorithm (Ester et al., 1996). This algorithm is very effective for membership determination of arbitrarily-shaped clusters and rejecting outliers without any prior assumptions about the number of clusters or about the stellar distribution. Once we have estimated the number of clusters we then calculate their physical parameters. Using the 584 colour-selected YSO candidates, we identify seven major star-forming regions in NGC 6822 with the DBSCAN algorithm. Of these, 294 sources were associated with a cluster and the remaining 290 sources are considered a ‘noise’ point. Each cluster must have at least seven sources within the maximum search radius to be considered. For comparison, we also determine the number of star-forming clusters in NGC 6822 using the high-confidence and medium-confidence YSO candidates listed in Tables 2 and 3. Table 9 lists the star-forming cluster properties; the cluster centres are determined from the mean position of all YSOs associated with that cluster and the semi-major axis radius from the outermost high-confidence YSO member from the cluster centre. Over 60 percent of the high-confidence YSO candidates are associated with a cluster, with the remainder mostly distributed along dusty ridges in the bar of NGC 6822. Massive YSOs in the Magellanic clouds show a similar correlation (Whitney et al., 2008; Ochsendorf et al., 2016).
Seven major star-formation regions were identified in NGC 6822. These include three bright regions in H: Hubble IV, Hubble V, and Hubble X, located in the south, north-east and north-west of the bar, respectively. These are young H ii regions powered by massive O and B stars which contain 53, 53, and 33 colour-selected YSO candidates, respectively. The ring nebula, Hubble III, and the neighbouring Hubble I nebula in the north-west region off from the main bar are identified as one elongated region by the DBSCAN routine. Here, Figure 10 shows that the majority of the Spitzer-identified YSOs are associated with Hubble I rather than Hubble III. The number of Stage I and II YSOs and the ratio of 24 m to H emission suggests that Hubble I is more active and younger than Hubble III. Hubble IV and V are thought to be even younger than Hubble I, III, and X (Schruba et al., 2017), with more compact CO morphologies and higher ratios of embedded to exposed SFR tracers. Our star counts of YSO candidates confirm this.
Three new regions of embedded star formation were also discovered: Spitzer I is a new area of active star formation. It has substantial 8 m emission, some 24 m emission, but is faint in H and the UV. This region contains 90 YSO candidates, the highest number in NGC 6822. Together with Hubble V, Spitzer I is rich in molecular gas inferred from the 8 µm emission (Sandstrom et al., 2012) and is probably the youngest SFR in the galaxy. The high IR flux compared to UV or H indicates that star formation is on rise in this region, and it has has yet to reach its peak star-formation activity, similar to the N79 object H72.97-69.39 (Ochsendorf et al., 2017).
Spitzer II has a substantial fraction of YSO candidates, however the number of high-confidence sources is lower than the Hubble regions and Spitzer I. Its properties are comparable to Hubble V and is probably of a similar age.
Spitzer III is a small region of embedded star-formation containing 11 YSO candidates; the lowest of all the regions identified using DBSCAN. It has a similar H-to-IR flux ratio as Hubble IV, and encompasses the H ii regions KD7–9 (Killen & Dufour, 1982).
Unfortunately, we have no direct measurements of the molecular gas content of the southern part of the galaxy which encompasses Spitzer I, II and III, only the major Hubble regions and the northern section and of NGC 6822 have been observed in the CO(2-1) line (Gratier et al., 2010; Schruba et al., 2017).
For the ‘possible’ YSO candidates listed in Table 4 identified using the , 3.6 m and 4.5 m fluxes which are not well-fit by a stellar photosphere model, we separate clusters of high density from the rest of the populations via the DBSCAN algorithm. The majority of the sources are associated with the seven star-forming region listed in Table 9; based on their locations and their SED shapes, these are likely true YSOs at a more advanced stage of formation. From this population of sources we note two clusters: one at 296.134 -14.789 (identified as a H ii region by Hodge et al. 1988) and one located at 296.178 -14.842 with radii of 118 and 31 pc respectively.
| Name | Region | RA | Dec | Radius | Number of colour |
|---|---|---|---|---|---|
| ID | (pc) | selected YSOs | |||
| Hubble I/III | 0 | 296.1338 | -14.7006 | 140 | 24 |
| Spitzer III | 1 | 296.1626 | -14.8585 | 77 | 11 |
| Hubble IV | 2 | 296.2076 | -14.8793 | 107 | 53 |
| Hubble V | 3 | 296.2204 | -14.7180 | 131 | 53 |
| Spitzer I | 4 | 296.2459 | -14.7947 | 109 | 90 |
| Hubble X | 5 | 296.2723 | -14.7216 | 78 | 33 |
| Spitzer II | 6 | 296.2881 | -14.8059 | 96 | 30 |
5.2 The current star-formation rate
To estimate the global star formation rate (SFR) for NGC 6822, we use the YSO counts and their derived mass at each evolutionary stage. Figure 9 shows a histogram of the measured YSO masses for our sample. The total mass of our 105 high-confidence YSOs is 2810 . This is dominated by the 91 Stage I sources with a mass of 2580 . Assuming our sample is approximately complete at the peak of the distribution, we can fit a Kroupa (2002) initial mass function (IMF) to this peak, in the mass range 20 – 35 . This IMF is a broken power law where for 0.08 0.5 M⊙ and for . To obtain a total YSO mass in NGC 6822, we then integrate under the IMF for the mass range 0.08 to 50 M⊙, resulting in a lower mass limit of 7800 for our high-confidence Stage I sources. The current SFR can be estimated by dividing the total mass of YSO candidates by the formation timescale, assuming this is constant over time. Here we consider only Stage I sources as they trace the most recent star-formation, are of approximately equal age, and these young embedded massive YSOs are preferentially detected by our Spitzer sample, thus providing the best completeness. Following the examples of Whitney et al. (2008); Lada et al. (2010); Sewiło et al. (2013, 2019); Carlson et al. (2012) we assume a formation timescale of 0.2 Myr for Stage I YSOs (Lada, 1999). This results in a global star-formation rate for NGC 6822 of 0.039 0.012 .
Our global SFR estimate is in good agreement (considering the uncertainties) with current SFR estimates of 0.04 derived from the stellar population of NGC 6822 (Gallart et al., 1996b) and 0.02 based on integrated 24 m emission by Efremova et al. (2011), but higher than the UV SF estimates of 0.014 , which trace SF over the last 100 Myr. SFR estimates based on H emission which traces the hottest, most massive stars range between 0.01 – 0.016 (Hunter & Elmegreen, 2004; Cannon et al., 2006) are also lower than our estimated SFR. In general, SFR measured from H and 24 m integrated light tend to be lower than SFR estimates from YSO counts (Chen et al., 2010). The SFRs calculated from star counts of Stage I objects and from 24 m emission depicts an early (My), embedded phase of star formation; thus the higher value compared to UV and H tracers may suggest a recent increase in the SFR in NGC 6822. This is surprising as major mergers or other dynamical interactions are usually required to stimulate such an increase in the global SFR of a galaxy on a timescales of 1 Myr.
NGC 6822 is thought to have a high SFR-to-CO ratio typical of dwarf galaxies (Lee et al., 2009), however the four prominent star-forming complexes in NGC 6822 observed by ALMA may have a relatively short depletion time compared to the rest of the galaxy (Schruba et al., 2017). This could be explained if NGC 6822 has experienced a recent starburst, with feedback dispersing the gas reservoirs. Schruba et al. (2017) dismiss this scenario as unfeasible, as there is no evidence that NGC 6822 has recently undergone a burst of star formation - the global SFR of NGC 6822 is thought to have be constant over the last 400 Myr (Efremova et al., 2011). We also see no evidence for a starburst, however our results indicate lots of current activity and we obtain a higher rate of star formation, by a factor of two, compared to UV and H measurements.
The Magellanic Clouds are a pair of metal-poor interacting galaxies. Compared to the SMC which has a SFR of 0.06 (Wilke et al., 2004; Sewiło et al., 2013) and a high SFR-to-CO ratio typical of dwarf galaxies, the SFR of NGC 6822 is comparable to that of the SMC if we account for the difference in mass between the galaxies. The SMC and NGC 6822 are currently more active than the LMC, which has a SFR of 0.06 (Whitney et al., 2008) and a total mass 5-10 times greater (Monachesi et al., 2012).
6 Conclusions
We present a comprehensive study of the massive young stellar population in NGC 6822 as observed with Spitzer. Metal-poor YSO candidates were identified via CMD examination and SED fitting. Using six mid-IR colour-cuts we find over 500 YSO candidates in seven massive star-formation regions. This is the first catalogue of young embedded stars in the process of formation identified in the galaxy. Removing known contaminants and through multi-wavelength SED fitting to the data with the R06 an R17 models, we compile a robust inventory of 105 high-confidence and 88 medium-confidence YSO candidates. The majority of these sources are Stage I YSOs with an accreting envelope in the initial stages of formation. For these sources we also determine the YSO mass and bolometric luminosity from the effective temperature and radius. Fitting a Kroupa (2002) IMF to the mass distribution of the Stage I YSOs, which are actively forming, we determine a global star-formation rate for NGC 6822 of 0.039 0.012 . This is likely a lower limit with a high uncertainty as we expect most of our YSO candidates to be resolved into clusters of young stars with higher-resolution mid-IR observations.
The Spitzer catalogue of YSOs in NGC 6822 presented here is incomplete. Our data is only sensitive to massive sources at early evolutionary stages. The addition of higher-sensitivity data with improved resolution would resolve protostar clusters and detect stars forming at lower masses, revealing new star formation sites. Future studies with the James Webb Space Telescope (JWST) would unveil more YSO candidates at all stages of evolution and provide better sampling of the SED for each source, improving their identification and evolutionary classification (Jones et al., 2017b). Improved spatial resolution would also allow better comparisons to gas tracers and to examine substuctures and filaments at smaller spatial scales in these massive star-forming complexes.
We compare the distribution of the YSO candidates with respect to the large-scale gas and dust emission. The YSO sources have a clumpy distribution, with the majority clustering into seven active high-mass star-formation regions which are strongly correlated with the 8 and 24 m emission from PAHs and warm dust. The clustered distributions also indicate contamination from AGB stars and background galaxies is low. The majority of star-formation in NGC 6822 was thought to take place in four prominent H ii regions: Hubble I/III, IV, V and X. We identify a new high-mass star formation region, Spitzer I, which hosts the highest number of embedded YSO candidates in NGC 6822. The properties of Spitzer I suggests it is younger and more active than the other prominent well-studied star-formation regions in the galaxy.
Acknowledgements
OCJ and MR has received funding from the EUs Horizon 2020 programme under the Marie Sklodowska-Curie grant agreement No 665593 awarded to the STFC. ASH and MM acknowledge support from NASA grant NNX14AN06G. This research made use of Astropy,333http://www.astropy.org a community-developed core Python package for Astronomy (Astropy Collaboration et al., 2013); APLpy, an open-source plotting package for Python (Robitaille & Bressert, 2012); and the SIMBAD database, operated at CDS, Strasbourg, France (Wenger et al., 2000).
References
- Astropy Collaboration et al. (2013) Astropy Collaboration et al., 2013, A&A, 558, A33
- Battinelli et al. (2006) Battinelli P., Demers S., Kunkel W. E., 2006, A&A, 451, 99
- Cannon et al. (2006) Cannon J. M., et al., 2006, ApJ, 652, 1170
- Cannon et al. (2012) Cannon J. M., et al., 2012, ApJ, 747, 122
- Carlson et al. (2012) Carlson L. R., Sewiło M., Meixner M., Romita K. A., Lawton B., 2012, A&A, 542, A66
- Castelli & Kurucz (2003) Castelli F., Kurucz R. L., 2003, in Piskunov N., Weiss W. W., Gray D. F., eds, IAU Symposium Vol. 210, Modelling of Stellar Atmospheres. p. A20 (arXiv:astro-ph/0405087)
- Chen et al. (2009) Chen C.-H. R., Chu Y.-H., Gruendl R. A., Gordon K. D., Heitsch F., 2009, ApJ, 695, 511
- Chen et al. (2010) Chen C.-H. R., et al., 2010, ApJ, 721, 1206
- Chen et al. (2015) Chen Y., Bressan A., Girardi L., Marigo P., Kong X., Lanza A., 2015, MNRAS, 452, 1068
- Churchwell et al. (2004) Churchwell E., et al., 2004, ApJS, 154, 322
- Clementini et al. (2003) Clementini G., Held E. V., Baldacci L., Rizzi L., 2003, ApJL, 588, L85
- Cortzen et al. (2019) Cortzen I., et al., 2019, MNRAS, 482, 1618
- Dale et al. (2007) Dale D. A., et al., 2007, ApJ, 655, 863
- Demers et al. (2006) Demers S., Battinelli P., Artigau E., 2006, A&A, 456, 905
- Efremova et al. (2011) Efremova B. V., et al., 2011, ApJ, 730, 88
- Ester et al. (1996) Ester M., Kriegel H., Sander J., Xu X., 1996, in Kdd. pp 226–231
- Galametz et al. (2010) Galametz M., et al., 2010, A&A, 518, L55
- Gallart et al. (1996a) Gallart C., Aparicio A., Bertelli G., Chiosi C., 1996a, AJ, 112, 1950
- Gallart et al. (1996b) Gallart C., Aparicio A., Bertelli G., Chiosi C., 1996b, AJ, 112, 2596
- García-Rojas et al. (2016) García-Rojas J., Peña M., Flores-Durán S., Hernández-Martínez L., 2016, A&A, 586, A59
- Gordon et al. (2011) Gordon K. D., et al., 2011, AJ, 142, 102
- Gratier et al. (2010) Gratier P., Braine J., Rodriguez-Fernandez N. J., Israel F. P., Schuster K. F., Brouillet N., Gardan E., 2010, A&A, 512, A68
- Günther et al. (2014) Günther H. M., et al., 2014, AJ, 148, 122
- Gutermuth et al. (2009) Gutermuth R. A., Megeath S. T., Myers P. C., Allen L. E., Pipher J. L., Fazio G. G., 2009, ApJS, 184, 18
- Hernández-Martínez & Peña (2009) Hernández-Martínez L., Peña M., 2009, A&A, 495, 447
- Hodge et al. (1988) Hodge P., Kennicutt Robert C. J., Lee M. G., 1988, PASP, 100, 917
- Hunter & Elmegreen (2004) Hunter D. A., Elmegreen B. G., 2004, AJ, 128, 2170
- Hunter et al. (2010) Hunter D. A., Elmegreen B. G., Ludka B. C., 2010, AJ, 139, 447
- Israel et al. (1996) Israel F. P., Bontekoe T. R., Kester D. J. M., 1996, A&A, 308, 723
- Jones et al. (2012) Jones O. C., et al., 2012, MNRAS, 427, 3209
- Jones et al. (2015) Jones O. C., Meixner M., Sargent B. A., Boyer M. L., Sewiło M., Hony S., Roman-Duval J., 2015, ApJ, 811, 145
- Jones et al. (2017a) Jones O. C., et al., 2017a, MNRAS, 470, 3250
- Jones et al. (2017b) Jones O. C., Meixner M., Justtanont K., Glasse A., 2017b, ApJ, 841, 15
- Jones et al. (2018) Jones O. C., Maclay M. T., Boyer M. L., Meixner M., McDonald I., Meskhidze H., 2018, ApJ, 854, 117
- Kang et al. (2006) Kang A., et al., 2006, A&A, 454, 717
- Kennicutt et al. (2003) Kennicutt Jr. R. C., et al., 2003, PASP, 115, 928
- Khan et al. (2015) Khan R., Stanek K. Z., Kochanek C. S., Sonneborn G., 2015, ApJS, 219, 42
- Killen & Dufour (1982) Killen R. M., Dufour R. J., 1982, PASP, 94, 444
- Kirby et al. (2017) Kirby E. N., Rizzi L., Held E. V., Cohen J. G., Cole A. A., Manning E. M., Skillman E. D., Weisz D. R., 2017, ApJ, 834, 9
- Koenig & Leisawitz (2014) Koenig X. P., Leisawitz D. T., 2014, ApJ, 791, 131
- Komiyama et al. (2003) Komiyama Y., et al., 2003, ApJL, 590, L17
- Koribalski et al. (2004) Koribalski B. S., et al., 2004, AJ, 128, 16
- Kroupa (2002) Kroupa P., 2002, Science, 295, 82
- Krumholz et al. (2018) Krumholz M. R., McKee C. F., Bland -Hawthorn J., 2018, arXiv e-prints, p. arXiv:1812.01615
- Lada (1987) Lada C. J., 1987, in Peimbert M., Jugaku J., eds, IAU Symposium Vol. 115, Star Forming Regions. pp 1–17
- Lada (1999) Lada C. J., 1999, in Lada C. J., Kylafis N. D., eds, Vol. 540, NATO Advanced Science Institutes (ASI) Series C. p. 143
- Lada et al. (2010) Lada C. J., Lombardi M., Alves J. F., 2010, ApJ, 724, 687
- Lee et al. (2006) Lee H., Skillman E. D., Venn K. A., 2006, ApJ, 642, 813
- Lee et al. (2009) Lee J. C., et al., 2009, ApJ, 706, 599
- Letarte et al. (2002) Letarte B., Demers S., Battinelli P., Kunkel W. E., 2002, AJ, 123, 832
- Madden et al. (2013) Madden S. C., et al., 2013, PASP, 125, 600
- Massey et al. (2007) Massey P., Olsen K. A. G., Hodge P. W., Jacoby G. H., McNeill R. T., Smith R. C., Strong S. B., 2007, AJ, 133, 2393
- Meixner et al. (2006) Meixner M., et al., 2006, AJ, 132, 2268
- Melena et al. (2009) Melena N. W., Elmegreen B. G., Hunter D. A., Zernow L., 2009, AJ, 138, 1203
- Monachesi et al. (2012) Monachesi A., Trager S. C., Lauer T. R., Hidalgo S. L., Freedman W., Dressler A., Grillmair C., Mighell K. J., 2012, ApJ, 745, 97
- Morales-Calderón et al. (2011) Morales-Calderón M., et al., 2011, ApJ, 733, 50
- Ochsendorf et al. (2016) Ochsendorf B. B., Meixner M., Chastenet J., Tielens A. G. G. M., Roman-Duval J., 2016, ApJ, 832, 43
- Ochsendorf et al. (2017) Ochsendorf B. B., Zinnecker H., Nayak O., Bally J., Meixner M., Jones O. C., Indebetouw R., Rahman M., 2017, Nature Astronomy, 1, 784
- Oliveira et al. (2009) Oliveira J. M., et al., 2009, ApJ, 707, 1269
- Oliveira et al. (2013) Oliveira J. M., et al., 2013, MNRAS, 428, 3001
- Pietrzyński et al. (2004) Pietrzyński G., Gieren W., Udalski A., Bresolin F., Kudritzki R.-P., Soszyński I., Szymański M., Kubiak M., 2004, AJ, 128, 2815
- Regan et al. (2006) Regan M. W., et al., 2006, ApJ, 652, 1112
- Rémy-Ruyer et al. (2015) Rémy-Ruyer A., et al., 2015, A&A, 582, A121
- Rich et al. (2014) Rich J. A., Persson S. E., Freedman W. L., Madore B. F., Monson A. J., Scowcroft V., Seibert M., 2014, ApJ, 794, 107
- Robitaille (2017) Robitaille T. P., 2017, A&A, 600, A11
- Robitaille & Bressert (2012) Robitaille T., Bressert E., 2012, APLpy: Astronomical Plotting Library in Python, Astrophysics Source Code Library (ascl:1208.017)
- Robitaille et al. (2006) Robitaille T. P., Whitney B. A., Indebetouw R., Wood K., Denzmore P., 2006, ApJS, 167, 256
- Robitaille et al. (2007) Robitaille T. P., Whitney B. A., Indebetouw R., Wood K., 2007, ApJS, 169, 328
- Rubin et al. (2016) Rubin R. H., Simpson J. P., Colgan S. W. J., Dufour R. J., Kader J., McNabb I. A., Pauldrach A. W. A., Weber J. A., 2016, MNRAS, 459, 1875
- Sandstrom et al. (2012) Sandstrom K. M., et al., 2012, ApJ, 744, 20
- Schlafly & Finkbeiner (2011) Schlafly E. F., Finkbeiner D. P., 2011, ApJ, 737, 103
- Schruba et al. (2017) Schruba A., et al., 2017, ApJ, 835, 278
- Seale et al. (2009) Seale J. P., Looney L. W., Chu Y.-H., Gruendl R. A., Brandl B., Chen C.-H. R., Brandner W., Blake G. A., 2009, ApJ, 699, 150
- Sewiło et al. (2013) Sewiło M., et al., 2013, ApJ, 778, 15
- Sewiło et al. (2019) Sewiło M., et al., 2019, ApJS, 240, 26
- Sibbons et al. (2012) Sibbons L. F., Ryan S. G., Cioni M.-R. L., Irwin M., Napiwotzki R., 2012, A&A, 540, A135
- Sibbons et al. (2015) Sibbons L. F., Ryan S. G., Napiwotzki R., Thompson G. P., 2015, A&A, 574, A102
- Skillman et al. (1989) Skillman E. D., Kennicutt R. C., Hodge P. W., 1989, ApJ, 347, 875
- Tang et al. (2014) Tang J., Bressan A., Rosenfield P., Slemer A., Marigo P., Girardi L., Bianchi L., 2014, MNRAS, 445, 4287
- Veljanoski et al. (2015) Veljanoski J., et al., 2015, MNRAS, 452, 320
- Ward et al. (2017) Ward J. L., Oliveira J. M., van Loon J. T., Sewiło M., 2017, MNRAS, 464, 1512
- Weldrake et al. (2003) Weldrake D. T. F., de Blok W. J. G., Walter F., 2003, MNRAS, 340, 12
- Wenger et al. (2000) Wenger M., et al., 2000, A&AS, 143, 9
- Whitelock et al. (2013) Whitelock P. A., Menzies J. W., Feast M. W., Nsengiyumva F., Matsunaga N., 2013, MNRAS, 428, 2216
- Whitney et al. (2003a) Whitney B. A., Wood K., Bjorkman J. E., Wolff M. J., 2003a, ApJ, 591, 1049
- Whitney et al. (2003b) Whitney B. A., Wood K., Bjorkman J. E., Cohen M., 2003b, ApJ, 598, 1079
- Whitney et al. (2008) Whitney B. A., et al., 2008, AJ, 136, 18
- Wilke et al. (2004) Wilke K., Klaas U., Lemke D., Mattila K., Stickel M., Haas M., 2004, A&A, 414, 69
- Wyder (2003) Wyder T. K., 2003, AJ, 125, 3097
- Zhang et al. (2012) Zhang H.-X., Hunter D. A., Elmegreen B. G., Gao Y., Schruba A., 2012, AJ, 143, 47
- Zubko et al. (2004) Zubko V., Dwek E., Arendt R. G., 2004, ApJS, 152, 211
- de Blok & Walter (2000) de Blok W. J. G., Walter F., 2000, ApJL, 537, L95
- de Grijs & Bono (2015) de Grijs R., Bono G., 2015, AJ, 149, 179