Large Scale Question Answering using Tourism Data
Abstract
We introduce the novel task of answering entity-seeking recommendation questions using a collection of reviews that describe candidate answer entities. We harvest a QA dataset that contains 47,124 paragraph-sized real user questions from travelers seeking recommendations for hotels, attractions and restaurants. Each question can have thousands of candidate answers to choose from and each candidate is associated with a collection of unstructured reviews. This dataset is especially challenging because commonly used neural architectures for reasoning and QA are prohibitively expensive for a task of this scale. As a solution, we design a scalable cluster-select-rerank approach. It first clusters text for each entity to identify exemplar sentences describing an entity. It then uses a scalable neural information retrieval (IR) module to select a set of potential entities from the large candidate set. A reranker uses a deeper attention-based architecture to pick the best answers from the selected entities. This strategy performs better than a pure IR or a pure attention-based reasoning approach yielding nearly 25% relative improvement in Accuracy@3 over both approaches.
1 Introduction
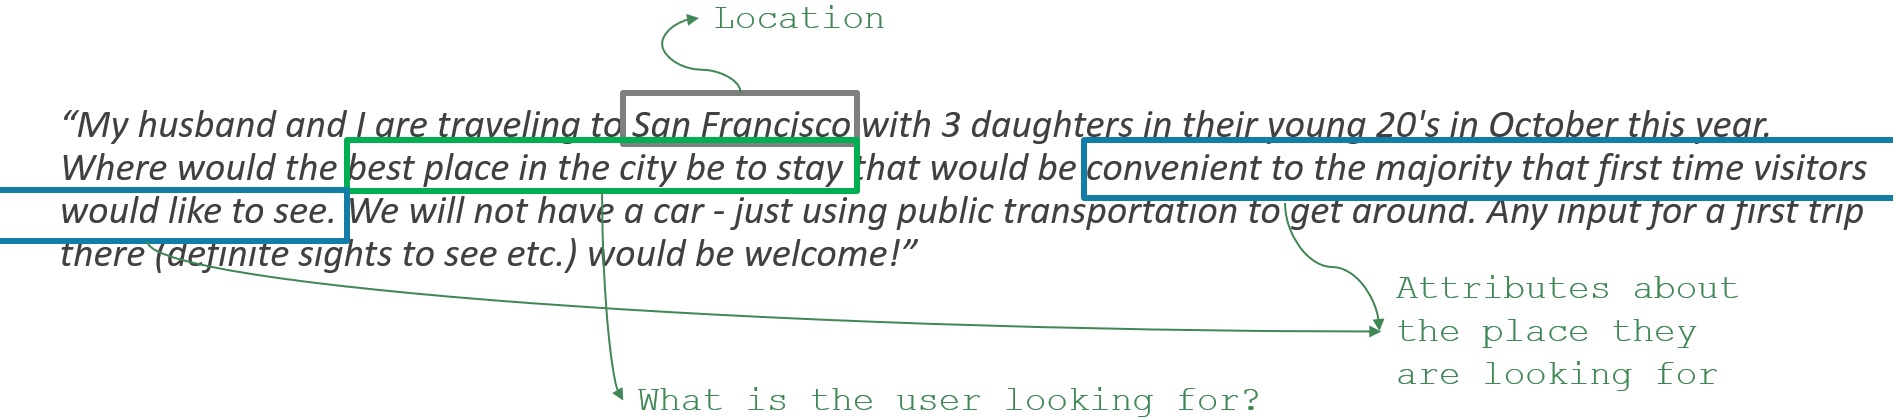
Real-world questions, such as those seen on online forums are often verbose, requiring us to first determine what is crucial in the question for answering. For example, consider the question in Figure 1. Here the user describes who they are, what they are looking for, as well as their preferences for the expected answer. They also mention that they are looking forward to the trip and are going to be first time visitors to the city. Answering such questions requires understanding the relevant parts of the question, reading information about each candidate answer entity in travel articles, blogs or reviews (entity documents), matching relevant question parts with entity documents, and ranking each candidate answer based on the degree of match.
In this paper we introduce the novel task of answering such entity-seeking recommendation questions using a collection of reviews describing entities. Our task reflects real-word challenges of reasoning and scale.
Reasoning: Entity reviews written by users can be informal and noisy, and may contain subjective contradictory opinions. Further, reviews may also discuss other entities (e.g., for comparison), making reasoning even harder. Finally, not all aspects of the question are relevant for answering which makes identifying the informational need challenging. It is worth noting that the question in Figure 1 is almost as large as the reading comprehension paragraphs used in tasks such as SQuAD.111Average size of paragraphs in SQuAD is 140 tokens
Scalability: Typical QA algorithms apply cross-attention between question and candidate answer texts, which do not scale in our task where entities may have long review documents (see Table 1 for comparison of document sizes across different QA datasets). Moreover, the candidate answer spaces for this problem are very high (e.g., New York has tens of thousands of restaurants to choose from), affecting scalability further.
1.1 Contributions
We introduce the novel task of answering entity-seeking recommendation questions using a collection of reviews describing entities. Formally, given an entity seeking recommendation question (), its target class ( {hotel, attraction, restaurant}), the city , a candidate space of entities for each corresponding city and entity class, a collection of their reviews ; the goal of this task is to find the correct (gold) answer entity using the documents describing the candidate answer entities. It is inspired by the recent work on parsing multi-sentence questions Contractor et al. (2020). Our work differs from theirs, because they do not attempt to solve this QA task end-to-end and, instead, rely on a pipeline of semantic parsing and querying into a Web API. In contrast, we harvest a novel dataset 222We release scripts to regenerate the dataset. of tourism questions consisting of QA pairs extracted from online travel forums. Each QA pair consists of a question and an answer entity ID, which corresponds to one of the over entity review documents collected from the Web. The entities in our dataset are hotels, restaurants and general attractions of interest in cities across the world. Gold-answer entities are extracted from mentions in full text user responses to the actual forum post. To the best of our knowledge, we are the first to propose and attempt such an end-to-end task using a collection of entity reviews.
In addition to a QA task, our task can also be viewed as an instance of information retrieval (IR), since we wish to return entity documents (equivalent to returning entities), except that the query is a long question. IR models are more scalable, as they often have methods aimed at primarily matching and aggregating information Mitra and Craswell (2018). Thus, these models typically do not achieve deep reasoning, which QA models do, but as mentioned previously, deeper reasoning in QA models (eg. using multiple layers of cross attention) makes them less scalable. We therefore, propose a Cluster-Select-Rerank (CsrQA) architecture for our task, drawing from strengths of both.
The CsrQA architecture first clusters text for each entity to identify exemplar sentences describing an entity. It then uses a scalable neural information retrieval (IR) module to select a set of potential entities from the large candidate set. A reranker uses a deeper attention-based architecture to pick the best answers from the selected entities. This strategy performs better than a pure IR or a pure attention-based reasoning approach yielding nearly 25% relative improvement in Accuracy@3 over both approaches.
2 Related Work
| Dataset |
|
|
|
|
|
||||||||||||
| SQuAD Rajpurkar et al. (2018) | Wikipedia paragraphs | Span | 137 | Y | N | ||||||||||||
| NewsQATrischler et al. (2016) | CNN News articles | Span | 300 | Y | N | ||||||||||||
| SearchQA Dunn et al. (2017) | Web snippets | Span | 25-46 | N | N | ||||||||||||
| RACE Lai et al. (2017) | Passages on topics | Choices | 350 | Y | N | ||||||||||||
| OpenBookQA Mihaylov et al. (2018) | Fact sentences | Choices | 10 | Y | Y | ||||||||||||
| MSMARCO Nguyen et al. (2016) | Web article snippets | Free text | 10 | N | Y | ||||||||||||
| MedQA Zhang et al. (2018) | Medical Articles | Choices | 35 | Y | Y | ||||||||||||
| WikiReading Hewlett et al. (2016) | Wikipedia articles | Infobox property | 489 | N | N | ||||||||||||
| TriviaQA Joshi et al. (2017) | Web articles | Span | 2895† | N | Y | ||||||||||||
| HotPot-QA Yang et al. (2018) | Wikipedia paragraphs | Span | 800 | N | Y | ||||||||||||
| ELI5 Fan et al. (2019) | Passages on topics | Free text | 858 | Y | N | ||||||||||||
| TechQA Castelli et al. (2019) | IT support notes | Free text | 48 | Y | Y | ||||||||||||
| Dialog QA - QuAC Choi et al. (2018) | Wikipedia passages | Span | 401 | Y | N | ||||||||||||
| Dialog QA - CoQA Reddy et al. (2018) | Passages on topics | Free text | 271 | Y | N | ||||||||||||
| Our Dataset | Reviews | Entity (doc.) | 3266 | N | Y |
QA Tasks: Recent question answering tasks such as those based on reading comprehension require answers to be generated either based on a single passage, or after reasoning over multiple passages (or small-sized documents) (e.g. SQuAD Rajpurkar et al. (2018), HotpotQA Yang et al. (2018), NewsQA Trischler et al. (2016)). Answers to questions are assumed to be stated explicitly in the documents Rajpurkar et al. (2018) and can be derived with single or multi-hop reasoning over sentences mentioning facts Yang et al. (2018). Other variants of these tasks add an additional layer of complexity where the document containing the answer may not be known and needs to be retrieved from a large corpus before answers can be extracted/generated (e.g. SearchQA Dunn et al. (2017), MS MARCO Nguyen et al. (2016), TriviaQA Joshi et al. (2017)). Models for these tasks typically use variants of TF-IDF like BM25 ranking Robertson and Zaragoza (2009) to retrieve and sub-select candidate documents Chen et al. (2017); reasoning is then performed over this reduced space to return answers. However, we find that in our task retrieval strategies such as BM25 perform poorly333Accuracy@3 of 7% and are thus not effective in reducing the candidate space (see Section 5). As a result, our task requires processing times more documents per question and also requires reasoning over large entity review-documents (Table 1) that consist of noisy, subjective opinions. Further, traditional QA models such as BiDAF Seo et al. (2016) or those based on BERT Devlin et al. (2019) are infeasible444BiDAF requires 43 hours for 1 epoch (4 K-80 GPUs) to train for our task. Thus, while existing tasks and datasets have been useful in furthering research in comprehension, inference and reasoning, we find that they do not always reflect all the complexities of real-world question answering motivated in our task.
IR Tasks: Our QA task is one that also shares characteristics of information retrieval (IR), because, similar to document retrieval, answers in our task are associated with long entity documents, though they are without any additional structure. The goal of IR, specifically document retrieval tasks, is to retrieve documents for a given query. Typical queries in these tasks are short, though some IR works have also studied long queries Agichtein et al. (2015). Documents in such collections tend to be larger than passages and often retain structure – titles, headings, etc. Neural models for IR focus on identifying good representations for queries and documents to maximize mutual relevance in latent space Mitra and Craswell (2018). To improve dealing with rare words recent neural models also incorporate lexical matching along with semantic matching Mitra et al. (2017). However, unlike typical retrieval tasks, the challenge for answering in our task is not merely that of semantic gap – subjective opinions need to be reasoned over and aggregated in order to assess relevance of the entity document. This is similar to other reading comprehension style QA tasks that require deeper reasoning over text.
We believe that this setting brings together an interesting mix: (i) a large search space with large documents (like in IR), and that (ii) answering cannot rely only on methods that are purely based on semantic and lexical overlap (it requires reasoning). Thus, in this paper we present a coarse-to-fine algorithm that sub-selects documents using IR and trains a deep reasoner over the selected subset (Section 4).
3 Data Collection
Most recent QA datasets have been constructed using crowdsourced workers who either create QA pairs given documents Rajpurkar et al. (2018); Reddy et al. (2018) or identify answers for real world questions Nguyen et al. (2016); Kwiatkowski et al. (2019). Creating QA datasets manually using the crowd can be very expensive and we therefore choose to automatically harvest a dataset using forums and a collection of reviews. We first crawled forum posts along with their corresponding conversation thread as well as meta-data including date and time of posting. We then also crawled reviews for restaurants and attractions for each city from a popular travel forum. Hotel reviews were scraped from a popular hotel booking website. Entity meta-data such as the address, ratings, amenities, etc was also collected where available.
We observed that apart from questions, forum users also post summaries of trips, feedback about services taken during a vacation, open-ended non entity-seeking questions such as queries about the weather and economic climate of a location, etc. Such questions were removed by precision oriented rules which discarded questions that did not contain any one of the phrases in the set [“recommend”, “suggest”, “where”, “place to” “best” and “option”]. While the use of such rules may introduce a bias towards a certain class of questions, as Table 3 suggests, they continue to retain a lot of variability in language of expression that still makes the task challenging. We further removed posts explicitly identified as “Trip Reports” or “Inappropriate" by the forum. Excessively long questions ( 1.7X more than average) were also removed.
3.1 Answer Extraction
We create a list of entity names crawled for each city and use it to find entity mentions in user responses to forum posts. A high level entity class (hotel, restaurant, attraction) for each entity is also tagged based on the source of the crawl. Each user response to a question is tagged for part-of-speech, and the nouns identified are fuzzily searched555Levenstein distance¡0.05 in the entity list (to accommodate for typographical errors). This gives us a noisy set of “silver" answer entities extracted from free text user responses for each question. We now describe a series of steps aimed at improving the precision of extracted silver answers, resulting in our gold QA pairs.
3.2 Filtering of Silver Answer Entities
Question Parsing: As a first step, we use the multi-sentence question understanding component developed by Contractor et al. (2020) to identify phrases in the question that could indicate a target entity’s “type” and “attribute”. For instance, in the example in Figure 1 tokens “place to stay” will be identified as an while “convenient to the majority of first time visitors” will be identified as .
Type-based filtering: All entities collected from the online forums come with labels (from a set of nearly 210 unique labels) indicating the nature of the entity. For instance, restaurants have cuisine types mentioned, attractions are tagged as museums, parks etc. Hotels from the hotel booking website are simply identified as “hotels”. We manually cluster the set of unique labels into 11 clusters. For a given question we use the phrase tagged with the label from the question parse, and determine its closest matching cluster using embedding representations. Similarly, for each silver answer entity extracted we identify the most likely cluster given its tagged attribute list; if the two clusters do not match, we drop the QA pair.
Peer-based filtering: As mentioned previously, all entities and their reviews contain labels in their meta-data indicating the nature of the entity. Using all silver (entity) answers for a question, we determine the frequency counts of each label encountered (an entity can be labeled with more than one label by the online forum). We then compare the label of each silver answer with the most frequent label and remove any silver (entity) answer that does not belong to the majority label.
Filtering entities with generic names: Some entities are often named after cities, or generic place types – for example “The Cafe” or “The Spa” which can result in spurious matches during answer extraction. We collect a list of entity types666Examples of types include “cafe”, “hospital”, “bar” etc. from Google Places777https://developers.google.com/places/web-service/supported_types and remove any answer entity whose name matches any entry in this list.
Removing entities that are chains and franchises: Answers to questions can also be names of restaurant or hotel chains without adequate information to identify the actual franchisee referred. In such cases, our answer extraction returns all entities in the city with that name. We thus, discard all such QA pairs.
Removing spurious candidates: User answers in forum posts often have multiple entities mentioned not necessarily in the context of an answer but for locative references (e.g. “opposite Starbucks”, or “near Wendys”) or for expressing opinions on entities that are not the answer. We write simple rules to remove candidates extracted in such conditions (e.g.: if more than one entity is extracted from a sentence, we drop them all or if entity mentions are in close proximity to phrases such as “next to”, “opposite” etc. they are dropped).
Additionally, we review the set of entities extracted and remove QA pairs with entity names that were common English words or phrases (eg: “August”, “Upstairs”, “Neighborhood” were all names of restaurants that could lead to spurious matches). We remove unique entity names as a result of this exercise. Note that it is the only step that involved human annotation in the data collection pipeline thus far.
3.3 Crowd-sourced Data Cleaning
We expect that our automated QA pair extraction methods are likely to have some degree of noise (See Section 5.1). In order to facilitate accurate bench-marking, we crowd-source and clean our validation and test sets. We use the Amazon Mechanical Turk(AMT)888http://requester.mturk.com for crowd-sourcing999See Supplementary Notes. Workers are presented with a QA-pair, which includes the original question, an answer-entity extracted by our rules and the original forum-post response thread where the answer entity was mentioned. Workers are then asked to check if the extracted answer entity was mentioned in the forum responses as an answer to the user question. We spend $0.05 for each QA pair costing a total of $. The crowd-sourced cleaning was of high quality; on a set of expert annotated question-answer pairs, the crowd had an agreement score of 97%. The resulting dataset is summarized in Table 2.
| #Ques. |
|
|
|
|
|
|||||||||||
|---|---|---|---|---|---|---|---|---|---|---|---|---|---|---|---|---|
| Training | 18,531 | 38,586 | 73.30 | 4,819 | 30,106 | 3,661 | ||||||||||
| Validation | 2119 | 4,196 | 70.67 | 585 | 3267 | 335 | ||||||||||
| Test | 2,173 | 4,342 | 70.97 | 558 | 3,418 | 366 |
3.4 Data Characteristics
In our dataset, the average number of tokens in each question is approximately , which is comparable to the document lengths for some existing QA tasks. Additionally, our entity documents are larger than the documents used in existing QA datasets (See Table 1) – they contain tokens on average. Lastly, answering any question requires studying all the possible entities in a given city – the average number of candidate answer entities per question is more than which further highlights the challenges of scale for this task.
| Feature | % | Examples of Phrases in Questions | ||||||||
|---|---|---|---|---|---|---|---|---|---|---|
|
23 |
|
||||||||
|
21 |
|
||||||||
|
41 |
|
||||||||
|
8 |
|
||||||||
|
61 |
|
Our dataset contains QA pairs for cities. The total number of entities in our dataset is . In almost every city, the most common entity class is restaurants. On average, each question has gold answers extracted. 61% of the questions contain personal preferences of users, 23% of the questions contain constraints on budgetary constraints, while 41% contain locative constraints (Table 3). Details about the knowledge source are summarized in Table 4. Samples of review documents of entities, QA pairs as well as additional characteristics of the dataset are available for reference in the supplementary material.
| Avg # Tokens | 3266 |
|---|---|
| Avg # Reviews | 69 |
| Avg # Tokens per Review | 47 |
| Avg # Sentences | 263 |
4 The Cluster-Select-Rerank Model
We now describe our model that trains on our dataset to answer a new question. Our model uses a cluster-select-rerank approach and combines benefits of both IR and QA architectures. We refer to it as CsrQA. It consists of three major components: (1) a clustering module to generate representative entity documents, (2) a fast scalable retrieval model that selects candidate answers and reduces the search space, and (3) a QA-style re-ranker that reasons over the selected answers and scores them to return the final answer. We now describe each component in detail.
4.1 Cluster: Representative Entity Document Creation
As stated previously, entity documents in our dataset are much larger than documents used by previous QA tasks. In order to make training a sufficiently expressive neural model tractable, CsrQA first constructs smaller representative documents101010representative documents are a set of review sentences for each entity using the full entity documents (containing all reviews for an entity). It encodes each review sentence using the pre-trained universal sentence encoder (USE) Cer et al. (2018) to generate sentence embeddings. It then clusters sentences within each document and uses the top-(nearest to the cluster centroid) sentences from each cluster to represent the entity. In our experiments we use and generate clusters per entity, thus reducing our document size to sentences each. This constitutes an approximately % reduction in document size. We note that despite this reduction our problem continues to be large-scale. This is because our documents are still larger than those used in most QA tasks and before returning an answer to a question, the system still has to explore over times111111Most QA tasks with large answer spaces are able to filter (reduce to top-10) candidates using TFIDF-style methods. more documents, as compared to most existing QA tasks.
4.2 Select: Shortlisting Candidate Answers
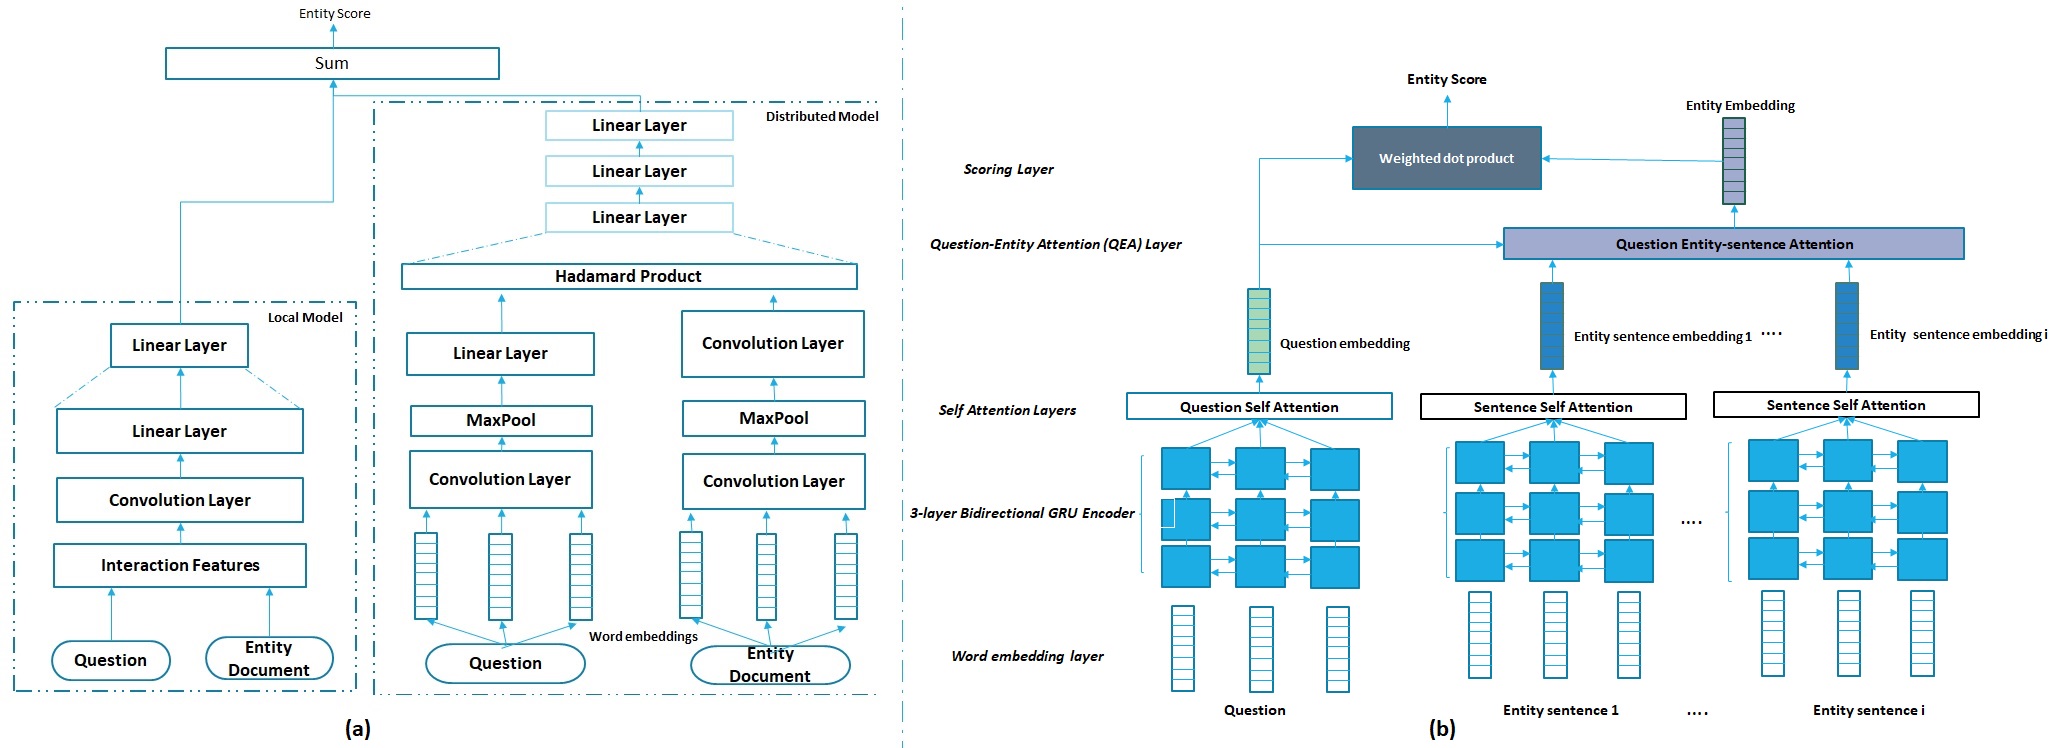
In this step, CsrQA trains a neural retrieval model with the question as the query and representative entity documents as the text corpus. As its retrieval model, it uses the recently improved Duet Mitra and Craswell (2019) network. Duet is an interaction-based neural network that compares elements of the question with different parts of a document and then aggregates evidence for relevance. It uses both local as well as distributed representations to capture lexical and semantic features. It is quite scalable for our task, since its neural design is primarily based on CNNs (Figure 2 (a)).
Duet is trained over the QA-pair training dataset and randomly sampled negative examples and uses cross-entropy loss. Duet can be seen as ranking the full candidate answer space for a given question, since it scores each representative entity document. CsrQA selects the top-30 candidate entities from this ranked list for a deeper reading and reasoning, as described in the next section.
4.3 Rerank: Answering over Selected Candidates
In this step, our goal is to perform careful reading and reasoning over the shortlisted candidate answers to build the best QA system. The CsrQA implements a model for re-ranking based on Siamese networkRao et al. (2016); Lai et al. (2018) with recurrent encoding and attention-based matching.
Input Layer: It uses 128-dimensional word2vec embeddings Mikolov et al. (2013) to encode each word of a question and a representative entity document. It uses a three layer bi-directional GRU Cho et al. (2014), which is shared between the question and the review sentence encoder.
Self Attention Layer: It learns shared self-attention (intra-attention) weights for questions and representative entity documents Cheng et al. (2016) and generates attended embedding representations for both.
Question-Entity Attention (QEA) Layer: In order to generate an entity embedding, it attends over the sentence embeddings121212obtained from the Self Attention Layer of its representative entity document, with respect to the question Luong et al. (2015). This helps identify “important” sentences and the sentence embeddings are then combined based on their attention weights to create the entity embedding. Thus, the entity embeddings are question-dependent.
Scoring Layer: Finally, given a question and the entity embedding, the model uses a weighted dot product between the two vectors to generate the score that is used to compute the max-margin loss. The model is summarized in Figure 2 (b).
The network is trained by sampling negative (incorrect answer) entities for each question-answer pair and using hinge loss. We improve model training by employing curriculum learning and present harder negative samples returned by a simpler version of the ranker. For details and hyper-parameter settings, please refer to the Supplementary notes.
5 Experiments
We ask the following questions in our experiments: (1) What is quality of data collected by our automated method? (2) What is the performance of the CsrQA model compared to other baselines for this task? (3) How does the CsrQA model compare with neural IR and neural QA models? (4) What are the characteristics of questions correctly answered by our system?
5.1 Qualitative Study: Data
We studied QA pairs of the train-set131313Note: this set is not cleaned by crowd-sourced workers, representing approximately % of the dataset, for errors in the automated data collection process. We found that our high precision filtering rules have an answer extraction accuracy of %. The errors can be traced to one of four major causes (i) (%) Entity name was a generic English word (e.g. “The Park”) (ii) (%) Entity matched another entity in the answer response which was not intended to be the answer entity to the original question. (e.g. Starbucks in "next to Starbucks") (iii) (%) Entity matched another entity with a similar name but of a different target class (e.g. hotel with same name instead of restaurant). (iv) (%) Failing to detect negations/negative sentiment (e.g. an entity mention in a post where the user says “i wouldn’t go there for the food”. (v) The remaining % of the errors were due to errors such as invalid questions (non-entity seeking), or incorrect answers provided by the forum users.
We find that the extraction accuracy is comparable to that seen in some existing datasets such as TriviaQA Joshi et al. (2017). However, as described previously we crowd-source and clean14141497% agreement with experts both our test and validation sets to allow accurate assessment and bench-marking of model performance of any system designed for our task.
5.2 Models for comparison
We began by trying to adapt traditional reading comprehension QA models such as BiDAF Seo et al. (2016) for our task, but we found they were infeasible to run – just epoch of training using negative samples per QA pair, and our representative entity documents, took BiDAF over hours to execute on K- GPUs. Running a trained BiDAF model on our test data would take even longer and was projected to require over hours. Similarly, we also tried using models based on BERT fine-tuning, but again, it did not scale for our task. In the absence of obvious scalable QA baselines, we compare the performance of CsrQA with other baselines for our task.
Random Entity Baseline: Returns a random ranking of the candidate answer space.
Ratings Baseline: Returns a global (question-independent) ranking of candidate entities based on user review ratings of entities.
BM25 Retrieval: We index each entity along with its reviews into Lucene151515http://lucene.apache.org/. Each question is transformed into a query using the default query parser that removes stop words and creates a disjunctive term query. Entities are scored and ranked using BM25 ranking Robertson and Zaragoza (2009). Note that this baseline is considered a strong baseline for information retrieval (IR) and is, in general, better than most neural IR models McDonald et al. (2018).
Review-AVG Model: This baseline uses averaged vector embeddings of the review sentences to represent each document - we use universal sentence embeddings (USE) Cer et al. (2018) to pre-compute vector representations for each sentence and average them to create a document representation. Questions are encoded using a self-attended bi-directional GRU Cheng et al. (2016) to generate a question representation. An entity is scored via a weighted dot product between question and document embeddings.
5.2.1 Ablation Models
RsrQA: This model highlights the value of the clustering step and the creation of representative entity documents. We replace the clustering phase of our CsrQAmodel and use randomly-selected review-sentences to represent entities. We also tried to create a model that creates document representations by selecting sentences from an entity document by indexing them in Lucene and then using the question as a query. However, this method, understandably, returned very few sentences – the questions (query) are longer than a sentence on average and the lexical gap is too big to overcome with simple expansion techniques. Lastly, if we give the full entity document instead of a representative one, the neural select-rerank model cannot be trained due to GPU memory limitations.
CsQA : This model returns answers by running the neural information retrieval model, Duet, on the clustered representative documents. This model is effectively the CsrQA model but without re-ranking.
CrQA : This model returns answers by running the reasoner directly on the clustered representative documents. Thus, this model does not use neural IR to select and reduce the candidate search space.
5.3 Metrics for Model evaluation
We use Accuracy@N metrics for evaluating a QA system. For a question , let the set of top ranked entities returned by the system be , and let the correct (gold) answer entities for the question be denoted by set . We give credit to a system for Accuracy@N if the sets and have a non-zero intersection. We also use the standard mean reciprocal rank (MRR) metric. To compute MRR score we only consider the highest ranked gold answer (if multiple gold answers exist for a question).
5.4 Results
Table 5 compares CsrQA against other models. We find that all non-neural baselines perform poorly on the task. Even the strong baseline of BM25 retrieval, which is commonly used in retrieval tasks, is not as effective for this dataset. Methods such as BM25 are primarily aimed at addressing challenges of semantic gap while in our task, answers require reasoning over subjective opinions in entity documents. We also observe that the performance of the neural model, Review-AVG, is comparable to that of BM25.
| Method | Acc@3 | Acc@5 | Acc@30 | MRR | |
|---|---|---|---|---|---|
| Random | 0.32 | 0.58 | 3.78 | 0.007 | |
|
0.37 | 0.92 | 3.33 | 0.007 | |
| BM25 | 6.72 | 9.98 | 30.60 | 0.071 | |
| Review-AVG | 7.87 | 11.83 | 30.65 | 0.084 | |
| RsrQA | 10.22 | 14.63 | 36.99 | 0.104 | |
| CrQA | 16.89 | 23.75 | 52.51 | 0.159 | |
| CsQA | 17.25 | 23.01 | 52.65 | 0.161 | |
| CsrQA | 21.44 | 28.20 | 52.65 | 0.186 |
The RsrQA model that uses randomly sampled review-sentences, has a low Acc@3 of 10.22 %. In contrast, both the CsQA and CrQA models, that use the clustered representative entity-documents have higher accuracy than RsrQA. Our final model CsrQA, has an Acc@3 of approximately 21.44% (last row).
We also find that CsrQA does better than CrQA . We attribute the gain in using CsrQA over CrQA to the fact that training the reasoner is compute intensive, and it is unable to see many hard negative samples for a question even after a long time of training. Due to this it optimizes its loss on the negatives seen during training, but may not perform well when the full candidate set is provided. On the other hand, in the complete CsrQA model, the select module shortlists good candidates apriori and the reasoner’s job is limited to finding the best ones from the small set of good candidates.
Comparing CsrQA and CsQA suggests that, while the scalable matching of Duet is useful enough for filtering candidates, it is not good enough to return the best answer. On the other hand the CsrQA model has a reasoner specifically trained to re-rank a harder set of filtered candidates and hence performs better.
Overall, we find that each component of CsrQA is critical in its contributing towards its performance on the task. Moreover, strong IR only (CsQA) and QA only baselines (CrQA) are not as effective as their combination in CsrQA.
5.5 Answering Characteristics
|
|
CsQA | CrQA | CsrQA | ||||
|---|---|---|---|---|---|---|---|---|
| <=1000 | 631 | 28.69 | 30.27 | 32.49 | ||||
| >1000 | 1542 | 12.58 | 11.41 | 16.93 |
Table 6 breaks down the performance of systems based on size of the candidate space encountered while answering. In questions where the candidate space is relatively smaller (<1000), we find CrQA model has slightly better performance than the CsQA model. However, in large candidate spaces we find the CsQA model is more effective in pruning the candidate search space and performs better than the CrQA model. The CsrQA model outperforms both systems regardless of candidate space size, highlighting the benefit of our method.
5.6 Qualitative Study: Answering System
Since we rely on automated methods used to construct the dataset, it is likely that our precision-oriented rules for data-set creation erroneously exclude some entity-answers originally recommended by forum users. In addition, there may also be alternative recommendations that were not part of the original forum responses, but may be valid alternatives. Therefore, we assess whether metrics computed using the gold-entity answers as reference answers, correlate with human relevance judgements on the top-3 answers returned by a system.
| Human Scores | Machine Scores | |
|---|---|---|
| Method | Acc@3 | Acc@3 |
| CR | 50.0 | 19.79 |
| CS | 63.51 | 22.92 |
| CSR | 65.63 | 33.33 |
We randomly select questions from the validation data and use the top-3 answers returned from three models, CsQA, CrQA and CsrQA for a qualitative study. The human evaluators part of this study are blind to the models returning the answers and we present each question-recommendation pair independently and in random order. We ask the evaluators to manually query a web-search engine and asses if each question-recommendation pair (returned by a model) adequately matches the requirements of the user posting that question. Specifically, the evaluators are asked to rank an answer correctly, if in their judgement, a candidate answer would have been one that they would recommend to a user based on the information they find on the web. To keep the real-world nature of the task intact we do not ask them to refer to specific websites or pages but suggest that they consider reviews, ratings, location, popularity, budget, convenience of access/transportation, timings when marking a candidate answer as a valid recommendation. Thus, evaluating whether an entity-answer returned is correct is subjective and time consuming. Based on these guidelines, two evaluators assessed a different set of unseen questions-recommendation pairs with over entities and we found the inter-annotator agreement on relevance judgements to be .
5.7 Results
The results of the qualitative evaluation on the QA Pairs ( questions) from the validation data are summarized in Table 7. As can be seen from the table, the absolute performance of the systems as measured by the human annotators is higher indicating the presence of false negatives in the dataset. In order to assess whether performance improvements measured using our gold-data correlate with human judgements on this task, we compute the Spearman’s rank coefficient161616https://en.wikipedia.org/wiki/Spearman%27s_rank
_correlation_coefficient between the human assigned scores and machine-evaluated scores. We compute pair-wise correlation coefficients between CsrQA, CsQA and CrQA, and we find there is moderately positive correlation Akoglu (2018) with high confidence between the human judgements and gold-data based measurements for both Acc@3 (, p-value<0.0009) as well as on Acc@5 ( p-value<0.04). Please see appendix for more details.
5.8 Error Analysis
We conducted an error analysis of the CsrQA model using the results of the human evaluation. We found that nearly % of the errors made were on questions involve location constraints while, % of the errors were due to either budgetary or temporal constraints not being satisfied. (See Appendix for more details)
6 Conclusion
In the spirit of defining a question answering challenge that is closer to a real-world QA setting, we introduce the novel task of identifying the correct entity answer to a given user question based on a collection of unstructured reviews describing entities. We harvest a dataset of over 47,000 QA pairs, which enables end to end training of models.
The biggest challenge in this dataset is that of scalability. Our task requires processing times more documents per question than most existing QA tasks, and individual documents are also much larger in size. In response, we develop a cluster-select-rerank architecture that brings together neural IR and QA models for an overall good performance. Our best system registers a 25% relative improvement over our baseline models. However, a correct answer is in top-3 for only 21% of the questions, which points to the difficulty of the task.
We believe that further research on this task will significantly improve the state-of-the-art in question answering. Neuro-symbolic methods that reason on locative and budgetary constraints could be an interesting direction of future work. These types of questions constitute nearly 64% of the user constraints specified in questions in our dataset. We will make resources from this paper available for further research (please see appendix for more details).
7 Acknowledgements
We would like to thank Yatin Nandwani, Sumit Bhatia, Dhiraj Madan, Dinesh Raghu, Sachindra Joshi, Shashank Goel, Gaurav Pandey, Dinesh Khandelwal for their helpful suggestions during the course of this work. We would like to thank Shashank Goel for re-implementing the data collection scripts and maintaining the GitHub repository. We would also like to acknowledge the IBM Research India PhD program that enables the first author to pursue the PhD at IIT Delhi. This work is supported by an IBM AI Horizons Network grant, IBM SUR awards, Visvesvaraya faculty awards by Govt. of India to both Mausam and Parag as well as grants by Google, Bloomberg and 1MG to Mausam.
References
- Agichtein et al. (2015) Eugene Agichtein, David Carmel, Dan Pelleg, Yuval Pinter, and Donna Harman. 2015. Overview of the TREC 2015 liveqa track. In Proceedings of The Twenty-Fourth Text REtrieval Conference, TREC 2015, Gaithersburg, Maryland, USA, November 17-20, 2015.
- Akoglu (2018) Haldun Akoglu. 2018. User’s guide to correlation coefficients. Turkish Journal of Emergency Medicine, 18:91 – 93.
- Castelli et al. (2019) Vittorio Castelli, Rishav Chakravarti, Saswati Dana, Anthony Ferritto, Radu Florian, Martin Franz, Dinesh Garg, Dinesh Khandelwal, J. Scott McCarley, Mike McCawley, Mohamed Nasr, Lin Pan, Cezar Pendus, John F. Pitrelli, Saurabh Pujar, Salim Roukos, Andrzej Sakrajda, Avirup Sil, Rosario Uceda-Sosa, Todd Ward, and Rong Zhang. 2019. The techqa dataset. CoRR, abs/1911.02984.
- Cer et al. (2018) Daniel Cer, Yinfei Yang, Sheng-yi Kong, Nan Hua, Nicole Limtiaco, Rhomni St. John, Noah Constant, Mario Guajardo-Cespedes, Steve Yuan, Chris Tar, Yun-Hsuan Sung, Brian Strope, and Ray Kurzweil. 2018. Universal sentence encoder. CoRR, abs/1803.11175.
- Chen et al. (2017) Danqi Chen, Adam Fisch, Jason Weston, and Antoine Bordes. 2017. Reading Wikipedia to answer open-domain questions. In Association for Computational Linguistics (ACL).
- Cheng et al. (2016) Jianpeng Cheng, Li Dong, and Mirella Lapata. 2016. Long short-term memory-networks for machine reading. In Proceedings of the 2016 Conference on Empirical Methods in Natural Language Processing, pages 551–561, Austin, Texas. Association for Computational Linguistics.
- Cho et al. (2014) Kyunghyun Cho, Bart van Merrienboer, Caglar Gulcehre, Dzmitry Bahdanau, Fethi Bougares, Holger Schwenk, and Yoshua Bengio. 2014. Learning phrase representations using RNN encoder–decoder for statistical machine translation. In Proceedings of the 2014 Conference on Empirical Methods in Natural Language Processing (EMNLP), pages 1724–1734, Doha, Qatar. Association for Computational Linguistics.
- Choi et al. (2018) Eunsol Choi, He He, Mohit Iyyer, Mark Yatskar, Wen-tau Yih, Yejin Choi, Percy Liang, and Luke Zettlemoyer. 2018. Quac: Question answering in context. In Proceedings of the 2018 Conference on Empirical Methods in Natural Language Processing, Brussels, Belgium, October 31 - November 4, 2018, pages 2174–2184.
- Contractor et al. (2020) Danish Contractor, Barun Patra, Mausam, and Parag Singla. 2020. Constrained bert bilstm crf for understanding multi-sentence entity-seeking questions. Natural Language Engineering, page 1–23.
- Devlin et al. (2019) Jacob Devlin, Ming-Wei Chang, Kenton Lee, and Kristina Toutanova. 2019. BERT: pre-training of deep bidirectional transformers for language understanding. In Proceedings of the 2019 Conference of the North American Chapter of the Association for Computational Linguistics: Human Language Technologies, NAACL-HLT 2019, Minneapolis, MN, USA, June 2-7, 2019, Volume 1 (Long and Short Papers), pages 4171–4186.
- Dunn et al. (2017) Matthew Dunn, Levent Sagun, Mike Higgins, V. Ugur Güney, Volkan Cirik, and Kyunghyun Cho. 2017. Searchqa: A new q&a dataset augmented with context from a search engine. CoRR, abs/1704.05179.
- Fan et al. (2019) Angela Fan, Yacine Jernite, Ethan Perez, David Grangier, Jason Weston, and Michael Auli. 2019. ELI5: long form question answering. In Proceedings of the 57th Conference of the Association for Computational Linguistics, ACL 2019, Florence, Italy, July 28- August 2, 2019, Volume 1: Long Papers, pages 3558–3567.
- Hewlett et al. (2016) Daniel Hewlett, Alexandre Lacoste, Llion Jones, Illia Polosukhin, Andrew Fandrianto, Jay Han, Matthew Kelcey, and David Berthelot. 2016. Wikireading: A novel large-scale language understanding task over wikipedia. In Proceedings of the 54th Annual Meeting of the Association for Computational Linguistics, ACL 2016, August 7-12, 2016, Berlin, Germany, Volume 1: Long Papers.
- Joshi et al. (2017) Mandar Joshi, Eunsol Choi, Daniel S. Weld, and Luke Zettlemoyer. 2017. Triviaqa: A large scale distantly supervised challenge dataset for reading comprehension. In Proceedings of the 55th Annual Meeting of the Association for Computational Linguistics, ACL 2017, Vancouver, Canada, July 30 - August 4, Volume 1: Long Papers, pages 1601–1611.
- Kwiatkowski et al. (2019) Tom Kwiatkowski, Jennimaria Palomaki, Olivia Redfield, Michael Collins, Ankur Parikh, Chris Alberti, Danielle Epstein, Illia Polosukhin, Matthew Kelcey, Jacob Devlin, Kenton Lee, Kristina N. Toutanova, Llion Jones, Ming-Wei Chang, Andrew Dai, Jakob Uszkoreit, Quoc Le, and Slav Petrov. 2019. Natural questions: a benchmark for question answering research. Transactions of the Association of Computational Linguistics.
- Lai et al. (2017) Guokun Lai, Qizhe Xie, Hanxiao Liu, Yiming Yang, and Eduard Hovy. 2017. Race: Large-scale reading comprehension dataset from examinations. In Proceedings of the 2017 Conference on Empirical Methods in Natural Language Processing, pages 785–794. Association for Computational Linguistics.
- Lai et al. (2018) Tuan Manh Lai, Trung Bui, and Sheng Li. 2018. A review on deep learning techniques applied to answer selection. In Proceedings of the 27th International Conference on Computational Linguistics, COLING 2018, Santa Fe, New Mexico, USA, August 20-26, 2018, pages 2132–2144.
- Le and Mikolov (2014) Quoc Le and Tomas Mikolov. 2014. Distributed representations of sentences and documents. In Proceedings of the 31st International Conference on International Conference on Machine Learning - Volume 32, ICML’14, pages II–1188–II–1196. JMLR.org.
- Louizos et al. (2018) Christos Louizos, Max Welling, and Diederik P. Kingma. 2018. Learning sparse neural networks through l_0 regularization. In 6th International Conference on Learning Representations, ICLR 2018, Vancouver, BC, Canada, April 30 - May 3, 2018, Conference Track Proceedings.
- Luong et al. (2015) Thang Luong, Hieu Pham, and Christopher D. Manning. 2015. Effective approaches to attention-based neural machine translation. In Proceedings of the 2015 Conference on Empirical Methods in Natural Language Processing, EMNLP 2015, Lisbon, Portugal, September 17-21, 2015, pages 1412–1421.
- McDonald et al. (2018) Ryan McDonald, George Brokos, and Ion Androutsopoulos. 2018. Deep relevance ranking using enhanced document-query interactions. In Proceedings of the 2018 Conference on Empirical Methods in Natural Language Processing, Brussels, Belgium, October 31 - November 4, 2018, pages 1849–1860.
- Mihaylov et al. (2018) Todor Mihaylov, Peter Clark, Tushar Khot, and Ashish Sabharwal. 2018. Can a suit of armor conduct electricity? a new dataset for open book question answering. In EMNLP.
- Mikolov et al. (2013) Tomas Mikolov, Ilya Sutskever, Kai Chen, Greg Corrado, and Jeffrey Dean. 2013. Distributed representations of words and phrases and their compositionality. In Proceedings of the 26th International Conference on Neural Information Processing Systems - Volume 2, NIPS’13, pages 3111–3119, USA. Curran Associates Inc.
- Mitra and Craswell (2018) Bhaskar Mitra and Nick Craswell. 2018. An introduction to neural information retrieval. Foundations and Trends® in Information Retrieval, 13(1):1–126.
- Mitra and Craswell (2019) Bhaskar Mitra and Nick Craswell. 2019. An updated duet model for passage re-ranking. arXiv preprint arXiv:1903.07666.
- Mitra et al. (2017) Bhaskar Mitra, Fernando Diaz, and Nick Craswell. 2017. Learning to match using local and distributed representations of text for web search. In Proceedings of the 26th International Conference on World Wide Web, pages 1291–1299. International World Wide Web Conferences Steering Committee.
- Nguyen et al. (2016) Tri Nguyen, Mir Rosenberg, Xia Song, Jianfeng Gao, Saurabh Tiwary, Rangan Majumder, and Li Deng. 2016. MS MARCO: A human generated machine reading comprehension dataset. In CoCo@NIPS, volume 1773 of CEUR Workshop Proceedings. CEUR-WS.org.
- Rajpurkar et al. (2018) Pranav Rajpurkar, Robin Jia, and Percy Liang. 2018. Know what you don’t know: Unanswerable questions for squad. In Proceedings of the 56th Annual Meeting of the Association for Computational Linguistics, ACL 2018, Melbourne, Australia, July 15-20, 2018, Volume 2: Short Papers, pages 784–789.
- Rao et al. (2016) Jinfeng Rao, Hua He, and Jimmy Lin. 2016. Noise-contrastive estimation for answer selection with deep neural networks. In Proceedings of the 25th ACM International on Conference on Information and Knowledge Management, CIKM ’16, pages 1913–1916, New York, NY, USA. ACM.
- Reddy et al. (2018) Siva Reddy, Danqi Chen, and Christopher D. Manning. 2018. Coqa: A conversational question answering challenge. CoRR, abs/1808.07042.
- Robertson and Zaragoza (2009) Stephen Robertson and Hugo Zaragoza. 2009. The probabilistic relevance framework: Bm25 and beyond. Found. Trends Inf. Retr., 3(4):333–389.
- Seo et al. (2016) Min Joon Seo, Aniruddha Kembhavi, Ali Farhadi, and Hannaneh Hajishirzi. 2016. Bidirectional attention flow for machine comprehension. CoRR, abs/1611.01603.
- Trischler et al. (2016) Adam Trischler, Tong Wang, Xingdi Yuan, Justin Harris, Alessandro Sordoni, Philip Bachman, and Kaheer Suleman. 2016. Newsqa: A machine comprehension dataset. CoRR, abs/1611.09830.
- Yang et al. (2018) Zhilin Yang, Peng Qi, Saizheng Zhang, Yoshua Bengio, William W. Cohen, Ruslan Salakhutdinov, and Christopher D. Manning. 2018. HotpotQA: A dataset for diverse, explainable multi-hop question answering. In Proceedings of the Conference on Empirical Methods in Natural Language Processing (EMNLP).
- Zhang et al. (2018) Xiao Zhang, Ji Wu, Zhiyang He, Xien Liu, and Ying Su. 2018. Medical exam question answering with large-scale reading comprehension. In Proceedings of the Thirty-Second AAAI Conference on Artificial Intelligence, (AAAI-18), the 30th innovative Applications of Artificial Intelligence (IAAI-18), and the 8th AAAI Symposium on Educational Advances in Artificial Intelligence (EAAI-18), New Orleans, Louisiana, USA, February 2-7, 2018, pages 5706–5713.
Appendix H Appendix
The supplementary information contains the following:
-
•
Section H.1 describes details about the crowd-sourcing task used to clean the validation and test sets.
-
•
Section H.2 presents a qualitative study characterizing the questions seen in our dataset.
-
•
Section H.3 describes the hyper-parameter settings used in our models.
-
•
Section H.4 describes how the size of candidate search space for each entity class affects answering accuracy of CsQA, CrQA and CsrQA systems.
-
•
Section H.5 studies the effect of the number of candidates to be re-ranked affects the performance of the CsrQA models.
-
•
Section H.6 describes experiments indicating how generating better samples for training with curriculum learning affects the performance of the re-ranker (CrQA).
-
•
Section H.7 presents details of the correlation study on human-assigned relevance judgements and scores computed by using the automatically extracted data as gold-data.
-
•
Section H.8 presents an error analysis performed on the answers returned by the CsrQA system.
-
•
Section H.9 describes the scripts being released as part of this work for generating the dataset as well scripts that allow users to collect QA pairs for new cities.
-
•
Section H.10 contains some detailed statistics of the train, test and validation sets including the city and answer-entity class wise distributions.
H.1 Crowd-sourcing task
In order to generate a clean test and validation set for accurate benchmarking we ask crowd-sourced workers. We use the Amazon Mechanical Turk(AMT)171717http://requester.mturk.com for crowd-sourcing. Workers are presented with a QA-pair, which includes the original question, an answer-entity extracted by our rules and the original forum post response thread where the answer entity was mentioned. Workers are then asked to check if the extracted answer entity was mentioned in the forum responses as an answer. Figure 3 shows an example of the task set up on AMT.
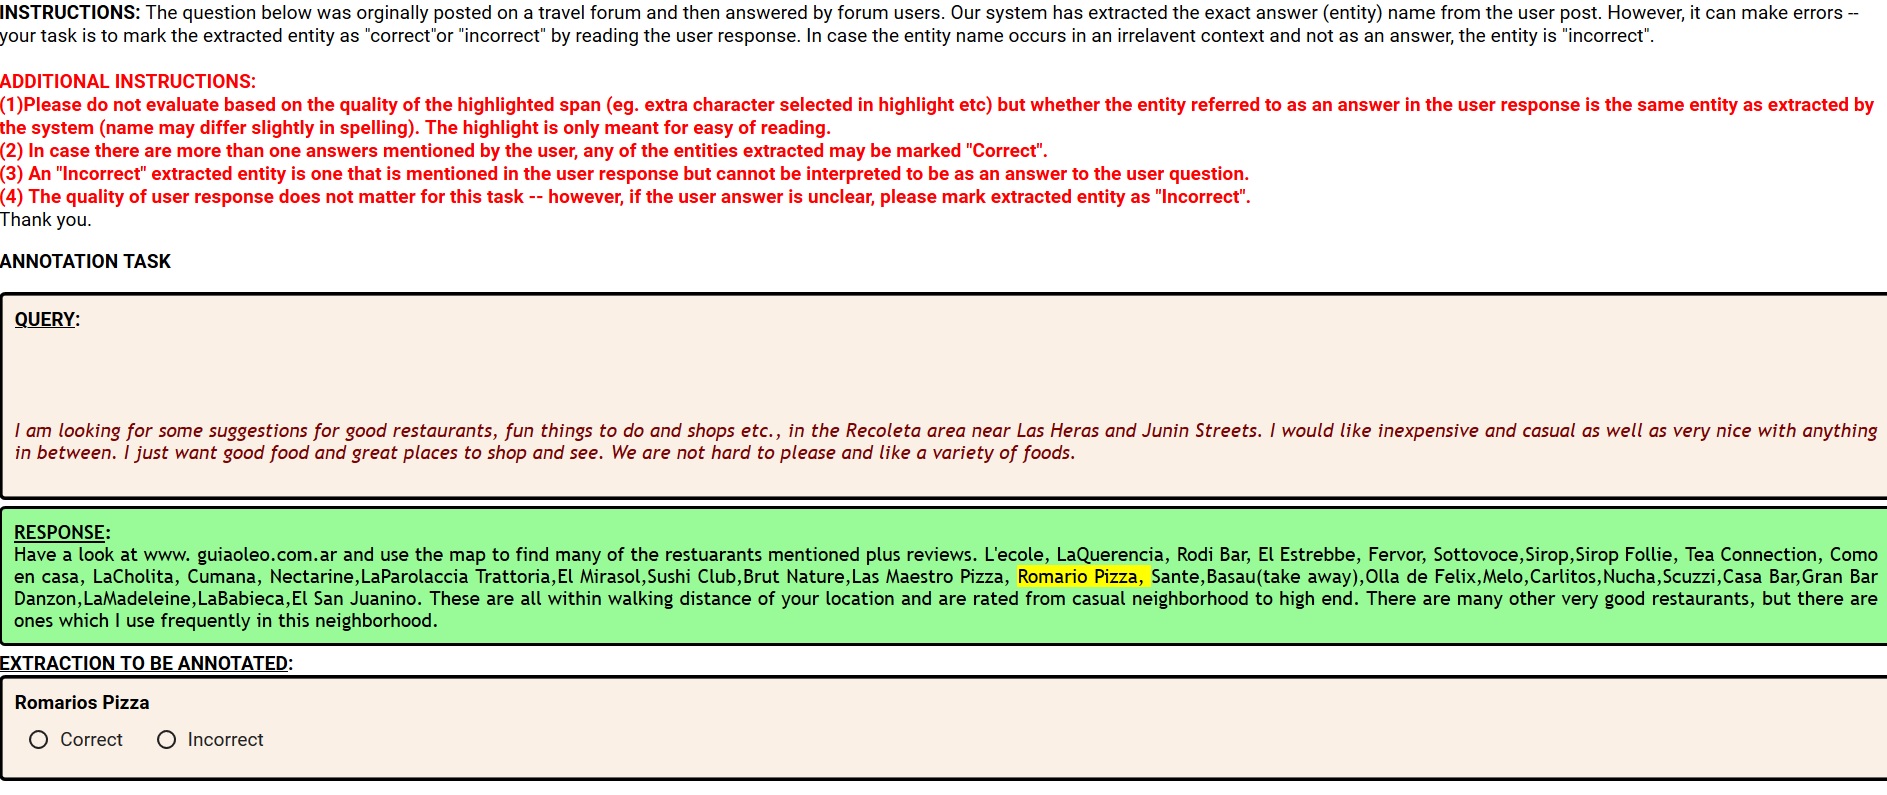
We spend $0.05 for each QA pair costing a total of . The crowd-sourced cleaning was of high quality – on a set of expert annotated question-answer pairs, the crowd had an agreement score of 97%.
H.2 Qualitative Study: Questions
| Feature | Definition | % | Example of phrases | ||||||||||
|---|---|---|---|---|---|---|---|---|---|---|---|---|---|
|
|
23 |
|
||||||||||
|
|
21 |
|
||||||||||
|
|
41 |
|
||||||||||
|
|
8 |
|
||||||||||
|
User specific constraints | 61 |
|
We analyzed questions and summarize their characteristics in Table 8. As expected, most questions (61%) have user-specific preferential constraints that govern the characteristics of the answer entity to be returned. As can be seen in phrases extracted from questions, they are rich and varied in both style and language of expression. Questions include those directed at cuisine preferences, capacity and age-group constraints, celebrations etc. 41 % of the questions contain constraints specifying location requirements (eg near a particular entity). Budgetary and Temporal constraints such as those based on time of day, event in a calendar etc occur in 23% and 21% of the questions.
H.3 Hyper-parameter Settings:
For all experiments we set in our max-margin criterion. We used Adam Optimizer Louizos et al. (2018) with a learning rate of for training. The convolution layers in the Duet model (retriever) used kernel sizes of and for local and distributed interactions respectively. Hidden nodes were initialized with size of input word embeddings, dimensions. The reasoning network (re-ranker) was trained for 5 days on K80 GPUs (approx. 14 epochs models) using negative samples for each QA pair. We used -layer -dimensional bidirectional GRUs to encode questions and review sentences. Input word embeddings were updated during training and USE embeddings returned dimension embeddings. Training the reasoning network (re-ranker) took hours per epoch on 4 K-80 GPUs. The CsrQA model is trained on negative samples from the a simpler version of the re-ranker with curriculum learning (See Supplementary notes Section H.6).
H.4 QA System: Answering Characteristics
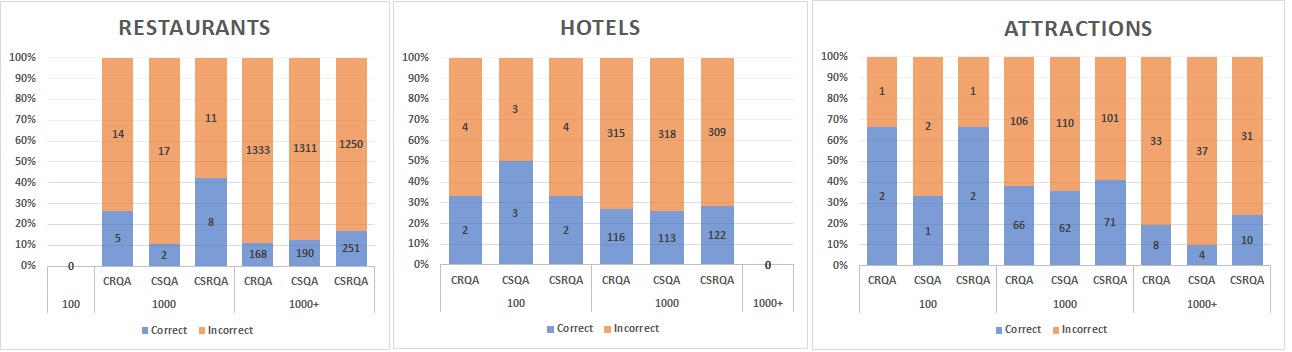
We study the performance of different configurations presented in the main paper and their characteristics for each entity-class. The plots in Figure 4 show the number of times the gold answer was in the top-3 ranks for questions from each entity class181818Recall that each question has its own candidate space. The results have been binned based on the size of the candidate space (0-100, 100-1000, 1000+). Questions on restaurants dominate the dataset and also have a larger candidate space with questions in the test set having a search space greater than candidates. In this sub-class of questions, we find that the CsQA model, which does not do deep reasoning, answers more questions correctly in the top-3 ranks, as compared to the CrQA model. This observation strengthens our motivation for using a scalable retrieval model to prune the large search space.
We find that in hotels and attractions since the search space in most questions isn’t as large , both the CsQA and CrQA models have comparable performance. However, using the full CsrQA model still shows considerable improvement (8% relative gain). Overall, we find that the reduction of search space is critical for this task and the use of a scalable shallow neural model to reduce the search space is an effective strategy to improve performance.
H.5 QA System: Effect of re-ranking space
The performance improvement of the CsrQA model over the CrQA model suggests the re-ranker is easily confused as the set of candidate entities increases. We study the performance of the CsrQA model by varying the number of candidates it has to re-rank. As expected, as we increase the number of candidates available for re-ranking, the Accuracy@3 begins to drop finally settling at approximately 15% when the full candidate space is available. However, we find that the drop in Accuracy@30 increases isn’t much suggesting that there are only a few candidates ( approx. 30-40) that the model is confused about. If we had a method of identifying confusing candidates perhaps our model could do better. We test this hypothesis in the next section by experimenting with different strategies for negative sampling, i.e for sampling harder candidates for learning the ranker.
| top-k | Acc@3 | Acc@5 | Acc@30 | MRR |
|---|---|---|---|---|
| 10 | 19.39 | 25.86 | 33.88 | 0.160 |
| 20 | 19.53 | 26.85 | 47.33 | 0.171 |
| 30 | 19.01 | 26.66 | 54.32 | 0.171 |
| 40 | 18.59 | 26.76 | 57.24 | 0.172 |
| 50 | 18.68 | 26.85 | 57.95 | 0.171 |
| 60 | 18.64 | 25.77 | 58.66 | 0.169 |
| 80 | 18.26 | 25.34 | 58.94 | 0.169 |
| 100 | 18.26 | 25.02 | 58.75 | 0.167 |
| Full | 14.67 | 21.43 | 53.56 | 0.147 |
H.6 Curriculum Learning & Sampling Strategies for Improved Re-ranking
Max-margin ranking models can be sensitive to the quality of negative samples presented to the model while training. Instead of presenting negative samples chosen at random from the candidate space, can we exploit knowledge about entities to give harder samples to the model and help improve its learning? One method of selecting harder samples would be to use the gold entity and find entities similar to it in some latent space and then present the closest entities as negative samples. In neural settings, candidate embedding space serves as a natural choice for the latent space; negative samples could be generated by sampling from a probability distribution fitted over the distances from the answer embedding.
We also experiment with two baseline methods of creating entity embeddings: (i) Using the averaged sentence embeddings of the representative documents (AVG. Emb in Table 10) (ii) Doc2Vec Le and Mikolov (2014). We employ curriculum learning, slowly increasing the selection probability of hard negatives up to a maximum of .
One could also use task specific embeddings from CrQA to model the candidate space, however, running running our trained model on the the test data takes 191919Using K- GPUs days. Generating question specific candidate embeddings for each instance while training (which is nearly times larger) is thus infeasible. We therefore, decide to generate task specific embeddings using our CrQA model but without the Question-Entity-Attention (QEA) layer that learns question independent entity embeddings. Once a model is trained, embeddings can be generated offline and used to generate a probability distribution (per answer entity) for negative sampling.
As can be seen in the last row of Table 10, training CrQA with harder negative samples with curriculum learning helps train a better model. Interestingly, the negative samples from Duet Mitra et al. (2017); Mitra and Craswell (2019) results in comparable performance but using Duet as selection mechanism results in significantly improved performance as shown in the main paper. The CrQA model described in the main paper using the task specific embeddings (last row) for training.
| Method | Acc@3(%) | Acc@5(%) | Acc@30 (%) | MRR | ||
|---|---|---|---|---|---|---|
|
16.06 | 22.18 | 53.04 | 0.155 | ||
|
16.38 | 22.14 | 52.97 | 0.149 | ||
|
16.24 | 22.14 | 51.68 | 0.157 | ||
|
16.06 | 21.95 | 52.88 | 0.155 | ||
|
16.89 | 23.75 | 52.51 | 0.159 |
H.7 Correlations between Human and Machine relevance judgements
In order to assess whether performance improvements measured using our gold-data correlate with human judgements on this task, we compute the Spearman’s rank coefficient202020https://en.wikipedia.org/wiki/Spearman%27s_rank
_correlation_coefficient between the human assigned scores and machine-evaluated scores. Let the scoring schemes corresponding to the human and machine judgements be , respectively. Let and be any two models developed for our task and let denote the the of an question-answer instance returned by model {,} using scoring scheme {,}. We then define a random variable as the following: for each question-answer instance , is assigned a value of , or based on whether the of (according to scoring scheme ) is less than, equal to or greater than the of as measured under the same scoring scheme. Formally,
We can now compute the Spearman’s rank correlation coefficient ) using different models.
Table 11 summarizes the correlation coefficients measured between different model pairs. We also report the p-values between each pair which indicates the probability of an uncorrelated system producing data that has a at least as high as the correlation coefficient computed on our data. As can be seen we find there is moderately positive correlation Akoglu (2018) with high confidence between the human judgements and gold-data based measurements for both Acc@3 (, p-value<0.0009) as well as on Acc@5 ( p-value<0.04).
| Acc@N | p-value | |||
|---|---|---|---|---|
| CsrQA | CsQA | 0.42 | 0.00002 | |
| CsrQA | CrQA | 0.33 | 0.0009 | |
| CsQA | CrQA | 0.43 | 0.000014 | |
| CsrQA | CsQA | 0.21 | 0.038 | |
| CsrQA | CrQA | 0.43 | 0.00001 | |
| CsQA | CrQA | 0.31 | 0.002 |
H.8 Answer System Error Analysis
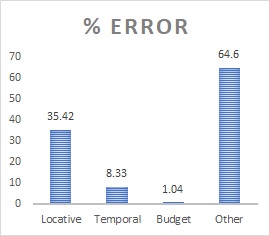
Figure 5 gives a detailed break-up of the types of errors made by the CsrQA system. As can be seen a large set of the errors (35%) can be traced to answers not fulfilling locative constraints specified in the question. Questions with Budgetary and temporal constraints constitute approximately 9% of the errors while remaining 65% of the errors collectively constitute not fulfilling user preferences of cuisine, age appropriate and/or celebration activities, hotel preferences etc.
H.9 Dataset Generation
We release scripts that regenerate the dataset consisting of the following:
-
•
QA Pairs containing a question and the set of answer entity IDs. In case of the validation and test data, these question-entity pairs are those generated after crowd-sourced verification. Thus, users of our scripts do not need to run any additional processing apart from executing the crawl scripts.
-
•
Entity Reviews for each city mapped by a unique entity ID.
Additionally, we also release scripts that allow users to generate new QA pairs. The scripts are organized into the following three stages:
-
•
Crawl: Download questions and forum post threads based on a seed-url for a city. Additionally, download entities for each city based on a seed-url. We release seed-urls for all our data and those can be used as reference for constructing urls for new data.
-
•
Organize: Organize the crawled into city specific folders as well generate the silver QA pairs using the entity data as described in Section 3.1 of the main paper.
-
•
Process: Generate gold QA pairs after executing the high precision extraction steps as described in Section 3.2 of the Main Paper.
H.10 Additional Data statistics
-
•
Table 12 presents the distribution of entities based on their type and the length of review documents for each city.
-
•
As noted in the main paper, most of the cities have restaurants as their majority entity.
-
•
The number of tokens in entity review documents has a huge variance across cities ranging anywhere between to . The average length of the questions ranges between 40 - 90 based on the city.
-
•
We excluded cities out of the data set while curating the train, test and validation splits for future studies.
- •
-
•
Restaurant is the most common entity class.
| City ID | #Attractions | #Restaurants | #Hotels | Total Entities | Avg #Reviews | Avg #Tokens |
|
||
|---|---|---|---|---|---|---|---|---|---|
| New York | 846 | 8336 | 562 | 9744 | 83.16 | 4570.5 | 54.9 | ||
| Washington | 351 | 2213 | 220 | 2784 | 100.7 | 5403.2 | 53.6 | ||
| Chicago | 471 | 5287 | 174 | 5932 | 51.44 | 2833.4 | 55.1 | ||
| San Francisco | 426 | 3661 | 302 | 4389 | 60.36 | 3170.6 | 52.5 | ||
| Mexico City | 290 | 2607 | 318 | 3215 | 26.6 | 1173.5 | 44.1 | ||
| Miami | 168 | 2283 | 191 | 2642 | 52.5 | 2416.5 | 46.0 | ||
| Vancouver | 243 | 2518 | 118 | 2879 | 63.17 | 3183.9 | 50.4 | ||
| Sao Paulo | 248 | 3336 | 232 | 3816 | 9.1 | 370.0 | 40.7 | ||
| Buenos Aires | 324 | 2385 | 334 | 3043 | 27.17 | 1283.4 | 47.2 | ||
| Rio De Janeiro | 290 | 2320 | 205 | 2815 | 24.54 | 1118.14 | 45.5 | ||
| London | 1466 | 16212 | 710 | 18388 | 130.46 | 7243.7 | 55.5 | ||
| Dublin | 387 | 1938 | 270 | 2595 | 160.6 | 8667.8 | 53.9 | ||
| Paris | 767 | 11379 | 711 | 12857 | 58.6 | 3172.4 | 54.1 | ||
| Rome | 850 | 6393 | 402 | 7645 | 77.546 | 4115.2 | 53. | ||
| Stockholm | 200 | 2168 | 125 | 2493 | 56.39 | 2646.8 | 46.9 | ||
| Oslo | 211 | 1061 | 74 | 1346 | 73.06 | 3362.0 | 46.0 | ||
| Zurich | 144 | 1434 | 97 | 1675 | 47.81 | 2162.0 | 45.2 | ||
| Vienna | 412 | 2761 | 332 | 3505 | 82.33 | 3724.7 | 45.2 | ||
| Berlin | 518 | 5147 | 593 | 6258 | 64.99 | 2958.4 | 45.5 | ||
| Budapest | 340 | 2225 | 170 | 2735 | 123.26 | 5762.8 | 46.7 | ||
| Bucharest | 212 | 1424 | 196 | 1832 | 47.76 | 2043.1 | 42.7 | ||
| Moscow | 544 | 3291 | 259 | 4094 | 21.73 | 946.1 | 43.5 | ||
| Amsterdam | 358 | 3055 | 422 | 3835 | 116.8 | 5769.9 | 49.4 | ||
| Beijing | 509 | 2234 | 0 | 2743 | 18.87 | 1067.4 | 56.6 | ||
| New Delhi | 350 | 5102 | 671 | 6123 | 31.72 | 1317.7 | 41.5 | ||
| Mumbai | 432 | 7159 | 383 | 7974 | 22.45 | 881.6 | 39.3 | ||
| Agra | 66 | 250 | 203 | 519 | 93.27 | 3979.7 | 42.6 | ||
| Bangkok | 435 | 5778 | 793 | 7006 | 54.48 | 2457.0 | 45.1 | ||
| Karachi | 62 | 219 | 14 | 295 | 22.31 | 869.4 | 38.9 | ||
| Singapore | 28 | 7616 | 453 | 8097 | 42.52 | 1965.2 | 46.2 | ||
| Jakarta | 194 | 3853 | 602 | 4649 | 25.64 | 887.3 | 34.6 | ||
| Tokyo | 0 | 0 | 781 | 781 | 157.04 | 6215.8 | 39.6 | ||
| Seoul | 354 | 3747 | 611 | 4712 | 25.53 | 1098.8 | 43.0 | ||
| Bukhara | 38 | 23 | 14 | 75 | 24.4 | 1112.3 | 45.5 | ||
| Ulaanbaatar | 56 | 222 | 47 | 325 | 23.75 | 1103.1 | 46.4 | ||
| Kathmandu | 111 | 588 | 178 | 877 | 54.07 | 2356.9 | 43.6 | ||
| Melbourne | 324 | 3030 | 162 | 3516 | 49.31 | 2464.2 | 49.9 | ||
| Sydney | 353 | 4100 | 362 | 4815 | 64.57 | 3125.5 | 48.4 | ||
| Auckland | 175 | 1733 | 238 | 2146 | 48.5 | 2330.7 | 48.0 | ||
| Havana | 183 | 657 | 23 | 863 | 44.07 | 2394.8 | 54.3 | ||
| Honolulu | 218 | 1561 | 117 | 1896 | 88.2 | 4762.8 | 54.0 | ||
| Kingston | 39 | 159 | 54 | 252 | 68.6 | 2721.9 | 39.7 | ||
| Seychelles | 0 | 1 | 0 | 1 | 20.0 | 1306.0 | 65.3 | ||
| Dubai | 247 | 5786 | 347 | 6380 | 54.14 | 2419.6 | 44.7 | ||
| Cairo | 155 | 1232 | 111 | 1498 | 33.27 | 1344.9 | 40.4 | ||
| Amman | 41 | 499 | 143 | 683 | 58.52 | 2264.7 | 38.7 | ||
| Jerusalem | 227 | 561 | 31 | 819 | 55.93 | 2651.8 | 47.4 | ||
| Johannesburg | 111 | 929 | 180 | 1220 | 58.559 | 2262.5 | 38.6 | ||
| Cape Town | 139 | 822 | 287 | 1248 | 121.638 | 4969.0 | 40.8 | ||
| Nairobi | 72 | 477 | 107 | 656 | 42.2698 | 2013.7 | 47.6 |
| City Name | #Questions | #QA Pairs |
|
|
|
|
||||||||
|---|---|---|---|---|---|---|---|---|---|---|---|---|---|---|
| New York | 5891 | 14673 | 1030 | 12841 | 802 | 77.1 | ||||||||
| Washington | 861 | 1886 | 168 | 1591 | 127 | 73.2 | ||||||||
| Chicago | 1189 | 2888 | 129 | 2583 | 176 | 76.2 | ||||||||
| San Francisco | 1621 | 4079 | 410 | 3417 | 252 | 74.0 | ||||||||
| Mexico City | 127 | 216 | 65 | 137 | 14 | 68.4 | ||||||||
| Miami | 98 | 134 | 28 | 97 | 9 | 68.2 | ||||||||
| Vancouver | 498 | 874 | 223 | 554 | 97 | 74.9 | ||||||||
| Sao Paulo | 16 | 25 | 7 | 16 | 2 | 75.7 | ||||||||
| Buenos Aires | 268 | 493 | 140 | 325 | 28 | 77.2 | ||||||||
| London | 3387 | 8265 | 569 | 6572 | 1124 | 75.9 | ||||||||
| Dublin | 621 | 1103 | 196 | 810 | 97 | 72.5 | ||||||||
| Rome | 1004 | 1782 | 234 | 1292 | 256 | 72.4 | ||||||||
| Stockholm | 160 | 280 | 56 | 190 | 34 | 78.1 | ||||||||
| Oslo | 67 | 114 | 43 | 65 | 6 | 78.2 | ||||||||
| Zurich | 95 | 147 | 41 | 97 | 9 | 69.8 | ||||||||
| Vienna | 292 | 465 | 89 | 320 | 56 | 66.0 | ||||||||
| Berlin | 386 | 652 | 68 | 453 | 131 | 71.8 | ||||||||
| Budapest | 317 | 655 | 23 | 605 | 27 | 75.3 | ||||||||
| Bucharest | 22 | 46 | 3 | 41 | 2 | 59.8 | ||||||||
| Moscow | 64 | 106 | 26 | 74 | 6 | 70.2 | ||||||||
| Amsterdam | 669 | 1299 | 207 | 1002 | 90 | 70.6 | ||||||||
| Beijing | 54 | 71 | 0 | 57 | 14 | 70.7 | ||||||||
| New Delhi | 28 | 55 | 24 | 18 | 13 | 54.0 | ||||||||
| Mumbai | 166 | 334 | 98 | 198 | 38 | 63.8 | ||||||||
| Agra | 40 | 52 | 36 | 14 | 2 | 54.8 | ||||||||
| Bangkok | 743 | 963 | 313 | 482 | 168 | 65.1 | ||||||||
| Singapore | 515 | 821 | 332 | 471 | 18 | 67.6 | ||||||||
| Jakarta | 25 | 44 | 15 | 15 | 14 | 64.7 | ||||||||
| Tokyo | 16 | 22 | 22 | 0 | 0 | 64.6 | ||||||||
| Seoul | 70 | 82 | 39 | 29 | 14 | 69.4 | ||||||||
| Kathmandu | 23 | 39 | 26 | 13 | 0 | 75.7 | ||||||||
| Melbourne | 33 | 65 | 5 | 56 | 4 | 63.7 | ||||||||
| Sydney | 344 | 508 | 100 | 340 | 68 | 67.0 | ||||||||
| Havana | 37 | 52 | 8 | 39 | 5 | 70.0 | ||||||||
| Honolulu | 61 | 93 | 24 | 61 | 8 | 56.0 | ||||||||
| Kingston | 5 | 6 | 1 | 4 | 1 | 87.6 | ||||||||
| Cairo | 48 | 57 | 10 | 36 | 11 | 77.8 | ||||||||
| Amman | 9 | 10 | 3 | 7 | 0 | 56.7 | ||||||||
| Jerusalem | 44 | 58 | 4 | 43 | 11 | 57.9 | ||||||||
| Johannesburg | 17 | 20 | 14 | 4 | 2 | 66.3 | ||||||||
| Cape Town | 40 | 57 | 26 | 31 | 0 | 65.3 | ||||||||
| Nairobi | 25 | 28 | 5 | 19 | 4 | 66.3 |
| City Name | #Questions | #QA Pairs |
|
|
|
|
||||||||
|---|---|---|---|---|---|---|---|---|---|---|---|---|---|---|
| New York | 627 | 1445 | 116 | 1243 | 86 | 77.0 | ||||||||
| Washington | 104 | 243 | 18 | 213 | 12 | 80.9 | ||||||||
| Chicago | 141 | 324 | 16 | 295 | 13 | 74.2 | ||||||||
| San Francisco | 185 | 439 | 38 | 360 | 41 | 73.9 | ||||||||
| Mexico City | 14 | 20 | 7 | 9 | 4 | 62.4 | ||||||||
| Miami | 13 | 16 | 2 | 9 | 5 | 54.7 | ||||||||
| Vancouver | 53 | 99 | 26 | 57 | 16 | 74.3 | ||||||||
| Sao Paulo | 1 | 1 | 1 | 0 | 0 | 65.0 | ||||||||
| Buenos Aires | 39 | 82 | 15 | 66 | 1 | 68.7 | ||||||||
| London | 342 | 634 | 76 | 469 | 89 | 75.2 | ||||||||
| Dublin | 62 | 122 | 20 | 97 | 5 | 76.9 | ||||||||
| Rome | 118 | 185 | 25 | 139 | 21 | 72.7 | ||||||||
| Stockholm | 24 | 46 | 9 | 29 | 8 | 82.6 | ||||||||
| Oslo | 9 | 12 | 5 | 7 | 0 | 82.9 | ||||||||
| Zurich | 11 | 16 | 3 | 13 | 0 | 53.4 | ||||||||
| Vienna | 29 | 47 | 9 | 32 | 6 | 55.7 | ||||||||
| Berlin | 39 | 60 | 13 | 37 | 10 | 82.6 | ||||||||
| Budapest | 48 | 96 | 3 | 87 | 6 | 66.5 | ||||||||
| Bucharest | 2 | 7 | 0 | 7 | 0 | 44.5 | ||||||||
| Moscow | 9 | 14 | 7 | 5 | 2 | 65.7 | ||||||||
| Amsterdam | 72 | 113 | 30 | 74 | 9 | 75.5 | ||||||||
| Beijing | 7 | 8 | 0 | 7 | 1 | 65.9 | ||||||||
| New Delhi | 1 | 3 | 0 | 3 | 0 | 75.0 | ||||||||
| Mumbai | 20 | 38 | 20 | 14 | 4 | 64.0 | ||||||||
| Agra | 4 | 7 | 5 | 2 | 0 | 37.5 | ||||||||
| Bangkok | 56 | 68 | 32 | 26 | 10 | 64.8 | ||||||||
| Singapore | 46 | 72 | 30 | 41 | 1 | 62.2 | ||||||||
| Jakarta | 3 | 4 | 3 | 1 | 0 | 43.3 | ||||||||
| Tokyo | 1 | 1 | 1 | 0 | 0 | 42.0 | ||||||||
| Seoul | 4 | 4 | 3 | 1 | 0 | 50.8 | ||||||||
| Kathmandu | 1 | 3 | 3 | 0 | 0 | 12.0 | ||||||||
| Melbourne | 2 | 2 | 0 | 0 | 2 | 31.5 | ||||||||
| Sydney | 39 | 50 | 12 | 32 | 6 | 80.4 | ||||||||
| Havana | 3 | 4 | 0 | 3 | 1 | 75.0 | ||||||||
| Honolulu | 8 | 8 | 2 | 5 | 1 | 73.2 | ||||||||
| Kingston | 1 | 1 | 0 | 0 | 1 | 78.0 | ||||||||
| Cairo | 12 | 15 | 0 | 14 | 1 | 77.8 | ||||||||
| Amman | 3 | 4 | 0 | 3 | 1 | 83.3 | ||||||||
| Jerusalem | 6 | 8 | 0 | 5 | 3 | 87.3 | ||||||||
| Johannesburg | 4 | 5 | 1 | 4 | 0 | 47.5 | ||||||||
| Cape Town | 7 | 13 | 6 | 7 | 0 | 70.6 | ||||||||
| Nairobi | 3 | 3 | 1 | 2 | 0 | 68.3 |
| City Name | #Questions | #QA Pairs |
|
|
|
|
||||||||
|---|---|---|---|---|---|---|---|---|---|---|---|---|---|---|
| New York | 621 | 1362 | 119 | 1169 | 74 | 75.6 | ||||||||
| Washington | 114 | 236 | 20 | 202 | 14 | 74.0 | ||||||||
| Chicago | 140 | 334 | 20 | 293 | 21 | 71.6 | ||||||||
| San Francisco | 171 | 413 | 55 | 328 | 30 | 78.2 | ||||||||
| Mexico City | 16 | 20 | 10 | 8 | 2 | 77.3 | ||||||||
| Miami | 7 | 8 | 3 | 5 | 0 | 60.6 | ||||||||
| Vancouver | 61 | 102 | 27 | 65 | 10 | 74.2 | ||||||||
| Sao Paulo | 3 | 8 | 2 | 6 | 0 | 83.7 | ||||||||
| Buenos Aires | 25 | 46 | 13 | 33 | 0 | 79.5 | ||||||||
| London | 334 | 657 | 81 | 494 | 82 | 74.5 | ||||||||
| Dublin | 71 | 125 | 34 | 85 | 6 | 72.5 | ||||||||
| Rome | 108 | 166 | 25 | 119 | 22 | 71.1 | ||||||||
| Stockholm | 17 | 32 | 7 | 18 | 7 | 62.9 | ||||||||
| Oslo | 8 | 9 | 5 | 4 | 0 | 78.5 | ||||||||
| Zurich | 17 | 26 | 12 | 14 | 0 | 73.2 | ||||||||
| Vienna | 37 | 59 | 12 | 36 | 11 | 72.8 | ||||||||
| Berlin | 28 | 46 | 12 | 28 | 6 | 73.8 | ||||||||
| Budapest | 34 | 58 | 3 | 54 | 1 | 66.8 | ||||||||
| Bucharest | 1 | 2 | 2 | 0 | 0 | 89.0 | ||||||||
| Moscow | 6 | 14 | 4 | 10 | 0 | 57.3 | ||||||||
| Amsterdam | 72 | 140 | 11 | 121 | 8 | 72.2 | ||||||||
| Beijing | 3 | 5 | 0 | 4 | 1 | 36.0 | ||||||||
| New Delhi | 5 | 6 | 1 | 3 | 2 | 24.2 | ||||||||
| Mumbai | 15 | 32 | 9 | 21 | 2 | 71.5 | ||||||||
| Agra | 3 | 5 | 4 | 1 | 0 | 33.3 | ||||||||
| Bangkok | 55 | 71 | 26 | 32 | 13 | 66.3 | ||||||||
| Karachi | 1 | 1 | 0 | 0 | 1 | 78.0 | ||||||||
| Singapore | 53 | 81 | 37 | 42 | 2 | 69.1 | ||||||||
| Jakarta | 3 | 8 | 5 | 3 | 0 | 55.7 | ||||||||
| Seoul | 8 | 8 | 6 | 0 | 2 | 57.9 | ||||||||
| Kathmandu | 4 | 6 | 6 | 0 | 0 | 86.8 | ||||||||
| Melbourne | 2 | 4 | 0 | 4 | 0 | 74.5 | ||||||||
| Sydney | 35 | 56 | 4 | 44 | 8 | 62.0 | ||||||||
| Havana | 4 | 5 | 1 | 4 | 0 | 72.8 | ||||||||
| Honolulu | 13 | 15 | 3 | 11 | 1 | 62.2 | ||||||||
| Cairo | 8 | 13 | 2 | 7 | 4 | 64.4 | ||||||||
| Jerusalem | 6 | 6 | 0 | 5 | 1 | 40.5 | ||||||||
| Johannesburg | 3 | 3 | 1 | 1 | 1 | 77.7 | ||||||||
| Cape Town | 4 | 5 | 1 | 2 | 2 | 71.2 | ||||||||
| Nairobi | 3 | 3 | 2 | 0 | 1 | 81.7 |