Modal interferometric refractive index sensing in microstructured exposed core fibres
Abstract
Optical fibre-based sensors measuring refractive index shift in bodily fluids and tissues are versatile and accurate probes of physiological processes. Here, we suggest a refractive index sensor based on a microstructured exposed-core fibre (ECF). By considering a high refractive index coating of the exposed core, our modelling demonstrates the splitting of the guided mode into a surface sensing mode and a mode that is isolated from the surface. With the isolated mode acting as a reference arm, this two-mode one-fibre solution provides for robust interferometric sensing with a sensitivity of up to rad/RIU-cm, which is suitable for sensing subtle physiological processes within hard-to-reach places inside living organisms, such as the spinal cord, ovarian tract and blood vessels.
1 Introduction
The analysis of physiological processes and early detection of certain diseases [1] requires sensors capable of probing subtle changes in temperature [2], pH level [3, 4], and concentration of biological fluids and gases [3] in hard-to-reach places inside living organisms such as the brain [5], spinal cord [6], ovarian tract [7] and blood vessels [8]. Such changes can often be sensed as small shifts in the optical refractive index of bodily fluids and tissues [8].
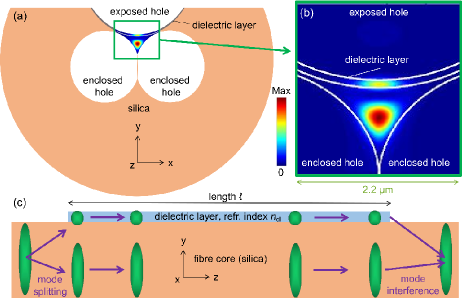
Microstructured exposed-core optical fibres (ECFs) provide a broad range of optical properties demanded by biomedical refractive index sensors intended to operate inside living organisms [9, 10, 11, 12]. ECFs confine and guide light in a small volume of a dielectric material surrounded by longitudinal air holes (Fig. 1). One of the holes is open along the entire length of the fibre, which allows using it as a sample chamber where a portion of the guided light evanescently extends above the fibre and provides light-matter overlap and enhanced interaction required for sensing.
Here, by theoretically considering a thin dielectric layer created on top of a standard ECF (Fig. 1), we show that the guided mode can be split into a surface sensing mode and a mode that is isolated from the surface. The isolated mode is immune to environmental changes, but the surface mode is highly sensitive to small refractive index shifts in the outer environment across the entire fibre length. We show that interference between the two modes can be used to create a fibre-optic sensor capable of detecting shifts in the optical refractive index with rad/RIU-cm sensitivity. Such sensitivity is comparable with that of two-arm interferometers [13, 14], two-mode one-fibre interferometers based on elliptical core fibres [15], mismatched-core fibres [16], liquid-crystal-clad fibres [17], and photonic crystal fibres [18].
2 Two-mode microstructured exposed core fibre
We consider a standard ECF structure [19] (Fig. 1) that consists of a Y-shaped silica core (the refractive index , m size) formed by three elliptical air holes () [9, 10, 11, 20, 19]. Two of these holes are fully enclosed by silica, but the third hole is open such that the top surface of the Y-shaped core can be accessed from the outer space across the fibre length. The exposed surface of the Y-shaped hole is covered by a dielectric layer of uniform thickness and optical refractive index . We consider from to because the dielectric layer deposited on top of a realistic ECF can be made of Teflon (), silica glass (), a polymer (), tellurite glass () or other high refractive index materials [21, 20, 22, 8]. The optical properties of such fibre originate from the small Y-shaped core with the dielectric layer (inset Fig. 1) and therefore only this region is considered in our analysis.
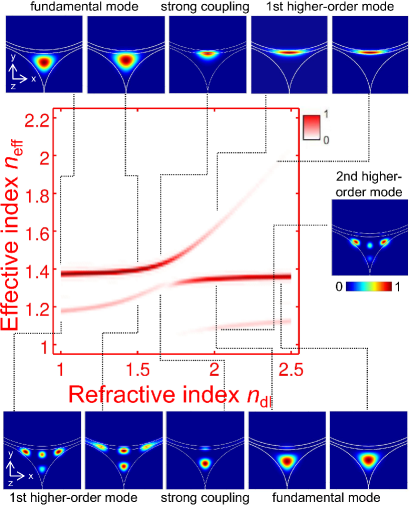
Figure 2 shows the dispersion characteristic of the ECF and the representative modal optical intensity profiles in the -plane. An finite-difference mode solver was used [23]. The wavelength is nm and the thickness of the dielectric layer is nm. Qualitatively similar results were obtained for all wavelengths across the visible spectral range as well as for the fibres with the other experimentally accessible [20] dielectric layer thicknesses nm.
The bare fibre () supports two guided modes with the effective refractive indices and . The mode with is the fundamental mode and the other mode is a higher-order guided mode.
At , the two modes behave independently – their resonance peaks are separated and have different magnitudes and linewidths. However, because of a strong dependence of of the higher-order mode on , the two modes hybridise at , which is evidenced by hybridisation of their respective modal intensity profiles (Fig. 2), nearly equal magnitude of their power density peaks, and avoided dispersion curve crossing [24].
At , the hybridisation disappears and the two modes again become independent resonators. The fundamental mode regains a profile similar to that of the bare fibre. However, the profile of the higher-order mode becomes completely different – the light is localised in the dielectric layer where the refractive index is higher than that of the core.
At there also appears the second higher-order mode with the light localised at the interface between the Y-shaped core and air. Initially, the fraction power carried by this mode is low, but it gradually increases as the value of is increased.
In the following, we will consider the regime of where the guided modes strongly confine light in the core and the dielectric layer. We will not consider the regime of mode anti-crossing (), although that regime would be suitable for other applications [24].
3 Analytical model of sensitivity
As the light propagates along the fibre section with the dielectric layer of length [Fig. 1(c)], a phase difference arises from the difference in propagation constants of the fundamental mode in the Y-shaped core, , and the higher-order mode in the dielectric layer, . A fraction of the power in the higher-order mode can be coupled back into the fundamental mode. The out-of-phase component results in an interference effect that can be observed as an oscillating attenuation measured as a function of wavelength at the output edge of the fibre.
We use the perturbation theory [25] where we assume that the refractive index of the dielectric layer is perturbed as , but that of the fibre core remains unchanged. This idealised model allows us to validate the analytical formalism presented below and also corresponds to a realistic scenario of temperature sensing [21].
The phase of fringes arising due to the interference effect is , where is the wavelength of light in free space, is the length of the fibre section with the dielectric layer [Fig. 1(c)], and is the difference in the propagation constants of the interfering modes. Under the condition of sufficiently small we obtain , where and are the unperturbed propagation constant and the fraction power of the mode guided in the dielectric layer, respectively, and is the wavevector. Thus, by following [16], the refractive index change can be related to the measurable change in phase as .
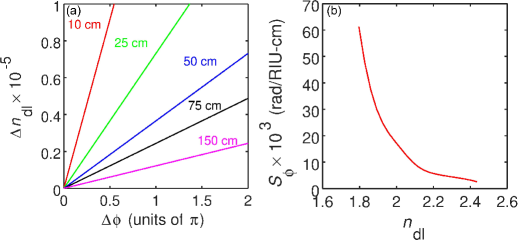
In Fig. 3(a) we plot as a function of for several representative fibre section lengths . We consider a dielectric layer material with , which in a practice would correspond to tellurite glass [21]. We observe that by using a sufficiently long section of the fibre, one could sense refractive index changes of by using a single interferometer arm for the interfering modes and without disturbing the mode propagating in the core of the fibre.
We also calculate the phase sensitivity [16, 14] as . For the practical scenario [16, 21] of for we obtain rad/RIU-cm. This value is of the same order of magnitude as predicted for a slow-light Mach–Zehnder interferometer [14]. In Fig. 3(b), we plot as a function of . The model predicts a gradual decrease in from rad/RIU-cm to rad/RIU-cm, which is consistent with the diverging behaviour of the dispersion curves of the fundamental and the first higher-order modes (Fig. 2).
4 Rigorous numerical simulations
We numerically verify the analytically predicted sensitivity in Fig. 3. FDTD simulations of centimetre-long fibre sections are very impractical due to prohibitive computational resource requirements. Therefore, in our analytical model we simultaneously increase and decrease to the micron range to maintain the same value of . We make sure that remains small enough not to disrupt the validity of the approximations made in the analytical model. Thus, we choose m and .
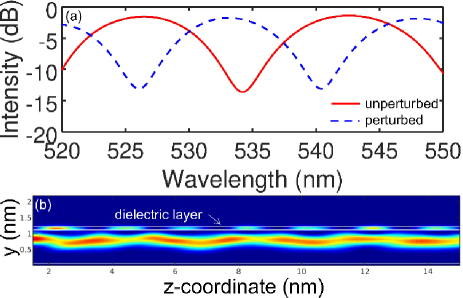
Figure 4(a) shows the fringe pattern calculated by collecting and Fourier-transforming the light emitted from the output edge of the fibre [Fig. 1(c)]. The observed fringe shift at nm is in good agreement with the predictions of the analytical theory. The small shift of the fringe from the nominal wavelength nm is an artefact.
Figure 4(b) shows the simulated optical intensity profile along the length of the fibre. We observe a picture predicted by the modal simulations in Fig. 2 – the light is guided through the fibre core and the dielectric layer, and the optical energy is periodically exchanged between the fibre core and the dielectric layer. In the fibre core, the coupling leads to a shift of the fundamental mode profile closer to the dielectric layer, which results in a zigzag pattern extended along the -coordinate. The light localisation in the dielectric layer follows this zigzag behaviour by creating a chain of equidistant hotspots. The spacing between these hotspots equals m and it is in good agreement with the predicted period of interference effect at nm and calculated as using the data from Figure 2.
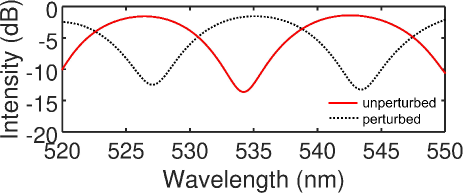
We also show that the investigated ECF is highly sensitive to changes in the refractive index, , of the medium located above the dielectric layer. In this case, the refractive indices of both fibre core and dielectric layer remain unchanged, but that of the outer medium is perturbed as . This scenario is difficult to analyse analytically because of the need to calculate leaky-mode losses [26]. Hence, we employ the FDTD method. Figure 5 shows the fringe patter calculated for a -m-long fibre section with the dielectric layer. We use and . We observe a phase shift of and we obtain rad/RIU-cm.
5 Conclusion
Our analytical modelling and numerical simulations have demonstrated that we can make a single-arm interferometric sensor by coating the core of a microstructured exposed core fibre with a high refractive index material. We show that the proposed fibre structure can guide light in both the core and coating, thereby satisfying conditions for strong mode interference and providing the sensitivity of up to rad/RIU-cm. Single-arm fibre-optical interferometers are simpler and more robust than those based on two arms, and therefore the investigated fibre structure should be especially suitable for sensing of small refractive index shifts induced by temperature changes, chemical reaction or certain diseases in living organisms.
Funding
Australian Research Council (ARC) Future Fellowship (FT180100343, FT160100357), Centre of Excellence for Nanoscale BioPhotonics (CE140100003) and LIEF (LE160100051) programs.
References
- [1] Z. Wang, K. Tangella, A. Balla, and G. Popescu, “Tissue refractive index as marker of disease,” \JournalTitleJ. Biomed. Opt. 16, 116017 (2011).
- [2] R. Correia, S. James, S.-W. Lee, S. P. Morgan, and S. Korposh, “Biomedical application of optical fibre sensors,” \JournalTitleJ. Opt. 20, 073003 (2018).
- [3] M. S. Purdey, J. G. Thompson, T. M. Monro, A. D. Abell, and E. P. Schartner, “A dual sensor for pH and hydrogen peroxide using polymer-coated optical fibre tips,” \JournalTitleSensors 15, 31904–31913 (2015).
- [4] X. Cheng, J. Bonefacino, B. O. Guan, and H. Y. Tam, “All-polymer fiber-optic pH sensor,” \JournalTitleOpt. Express 26, 14610–14616 (2018).
- [5] J. Wells, C. Kao, E. D. Jansen, P. Konrad, and A. Mahadevan-Jansen, “Application of infrared light for in vivo neural stimulation,” \JournalTitleJ. Biomed. Opt. 10, 064003 (2005).
- [6] C. Lu, U. P. Froriep, R. A. Koppes, A. Canales, V. Caggiano, J. Selvidge, E. Bizzi, and P. Anikeeva, “Polymer fiber probes enable optical control of spinal cord and muscle function in vivo,” \JournalTitleAdv. Mater. 24, 6594–6600 (2014).
- [7] T. Wang, M. Brewer, and Q. Zhu, “An overview of optical coherence tomography for ovarian tissue imaging and characterization,” \JournalTitleWIREs Nanomed. Nanobiotechnol. 7, 1–16 (2015).
- [8] J. Li, H. Ebendorff-Heidepriem, B. C. Gibson, A. D. Greentree, M. R. Hutchinson, P. Jia, R. Kostecki, G. Liu, A. Orth, M. Ploschner, E. P. Schartner, S. C. Warren-Smith, K. Zhang, G. Tsiminis, and E. M. Goldys, “Perspective: Biomedical sensing and imaging with optical fibers—innovation through convergence of science disciplines,” \JournalTitleAPL Photon. 3, 100902 (2018).
- [9] S. C. Warren-Smith, H. Ebendorff-Heidepriem, T. C. Foo, R. Moore, C. Davis, and T. M. Monro, “Exposed-core microstructured optical fibers for real-time fluorescence sensing,” \JournalTitleOpt. Express 17, 18533–18542 (2009).
- [10] R. Kostecki, H. Ebendorff-Heidepriem, C. Davis, G. McAdam, S. C. Warren-Smith, and T. M. Monro, “Silica exposed-core microstructured optical fibers,” \JournalTitleOpt. Mater. Express 2, 1538–1547 (2012).
- [11] L. Mescia and F. Prudenzano, “Advances on optical fiber sensors,” \JournalTitleFibers 2, 1–23 (2014).
- [12] J. Ballato, H. Ebendorff-Heidepriem, J. Zhao, L. Petit, and J. Troles, “Glass and process development for the next generation of optical fibers: A review,” \JournalTitleFibers 5, 11 (2017).
- [13] R. Hainberger, R. Bruck, P. Muellner, K. Roppert, W. Boxleitner, C. Pacher, and N. Finger, “Design of silicon and polymer photonic waveguide structures for sensing applications,” \JournalTitleProc. SPIE. 7386, 73862Q (2009).
- [14] K. Qin, S. Hu, S. T. Retterer, I. I. Kravchenko, and S. M. Weiss, “Slow light Mach–Zehnder interferometer as label-free biosensor with scalable sensitivity,” \JournalTitleOpt. Lett. 41, 753–756 (2016).
- [15] B. Y. Kim, J. N. Blake, S. Y. Huang, and H. J. Shaw, “Use of highly elliptical core fibers for two-mode fiber devices,” \JournalTitleOpt. Lett. 12, 729–731 (1987).
- [16] J. Canning and A. L. G. Carter, “Modal interferometer for in situ measurements of induced core index change in optical fibers,” \JournalTitleOpt. Lett. 22, 561–563 (1997).
- [17] T.-J. Chen, “A novel two-mode fiber-optic interferometer based on HE11-TE01 modal interference utilizing a liquid-crystal-clad fiber modal filter,” \JournalTitleOpt. Commun. 261, 43–50 (2006).
- [18] H. Y. Choi, M. J. Kim, and B. H. Lee, “All-fiber Mach-Zehnder type interferometers formed in photonic crystal fiber,” \JournalTitleOpt. Express 15, 5711–5720 (2007).
- [19] E. Schartner, A. Dowler, and H. Ebendorff-Heidepriem, “Fabrication of low-loss, small-core exposed core microstructured optical fibers,” \JournalTitleOpt. Mater. Express 7, 1496–1502 (2017).
- [20] R. Kostecki, H. Ebendorff-Heidepriem, S. Afshar V., G. McAdam, C. Davis, and T. M. Monro, “Novel polymer functionalization method for exposed-core optical fiber,” \JournalTitleOpt. Mater. Express 4, 1515–1525 (2014).
- [21] H. Li, J. Lousteau, W. N. MacPherson, X. Jiang, H. T. Bookey, J. S. Barton, A. Jha, and A. K. Kar, “Thermal sensitivity of tellurite and germanate optical fibers,” \JournalTitleOpt. Express 15, 8857–8863 (2007).
- [22] A. Bachhuka, S. Heng, K. Vasilev, R. Kostecki, A. Abell, and H. Ebendorff-Heidepriem, “Surface functionalization of exposed core glass optical fiber for metal ion sensing,” \JournalTitleSensors 19, 1829 (2019).
- [23] I. S. Maksymov, L. F. Marsal, M. A. Ustyantsev, and J. Pallares, “Band structure calculation in two-dimensional Kerr-nonlinear photonic crystals,” \JournalTitleOpt. Commun. 248, 469–477 (2005).
- [24] F. Tani, F. Köttig, D. Novoa, R. Keding, and P. S. J. Russell, “Effect of anti-crossings with cladding resonances on ultrafast nonlinear dynamics in gas-filled photonic crystal fibers,” \JournalTitlePhotonics Res. 6, 84–88 (2018).
- [25] A. W. Snyder and J. Love, Optical Waveguide Theory (Springer Science & Business Media, Berlin, 1983).
- [26] C.-C. Chou and N.-H. Sun, “Analysis of leaky-mode losses for optical fibers,” \JournalTitleJ. Opt. Soc. Am. B 25, 545–554 (2008).