11email: krisztina.g@gmail.com 22institutetext: Konkoly Observatory, MTA Research Centre for Astronomy and Earth Sciences, Konkoly Thege Miklós út 15-17 1121 Budapest, Hungary 33institutetext: Department of Physics and Astronomy, George Mason University, 4400 University Drive, MSN 3F3, Fairfax, VA 22030, USA 44institutetext: Department of Physics and Astronomy, James Madison University, Harrisonburg VA 22807, USA
Very long baseline interferometry observation of the triple AGN candidate J08491114
Abstract
Context. In the hierarchical structure formation model, galaxies grow through various merging events. Numerical simulations indicate that the mergers can enhance the activity of the central supermassive black holes in the galaxies.
Aims. Pfeifle et al. (2019a) identified a system of three interacting galaxies, J08491114, and provided multiwavelength evidence of all three galaxies containing active galactic nuclei. The system has substantial radio emission, and with high-resolution radio interferometric observation we aimed to investigate its origin, whether it is related to star formation or to one or more of the active galactic nuclei in the system.
Methods. We performed high-resolution continuum observation of J08491114 with the European Very Long Baseline Interferometry Network at GHz.
Results. We detected one compact radio emitting source at the position of the easternmost nucleus. Its high brightness temperature and radio power indicate that the radio emission originates from a radio-emitting active galactic nucleus. Additionally, we found that significant amount of flux density is contained in milliarcsec-scale feature related to the active nucleus.
Key Words.:
galaxies: active – galaxies: Seyfert – galaxies: individual: J084911141 Introduction
According to currently accepted cosmological and structure formation model, galaxies grow through frequent mergers (e.g., Volonteri et al. 2003). During these events, the supermassive black holes (SMBHs) residing in the merging galaxies shrink to the central region of kpc losing energy by dynamical friction. There, a bound SMBH pair may form, which eventually will be able to emit gravitational waves before their final coalescence (Begelman et al. 1980). Detection of an SMBH is relatively straightforward if it is actively accreting matter from its surrounding as in an active galactic nucleus (AGN). According to numerical simulations (e.g. Capelo et al. 2015; Blecha et al. 2018), the simultaneous activity in the nuclei of merging galaxies is expected at a separation of kpc.
Despite various efforts, efficient observational selection of multiple AGN candidates has so far been elusive. Satyapal et al. (2017) proposed a new selection method to find possible dual AGN. They selected galaxies from the Sloan Digital Sky Survey (SDSS) experiencing interactions or mergers according to their optical images. This sample is cross-correlated with the infrared AllWISE catalog111http://wise2.ipac.caltech.edu/docs/release/allwise/ (Cutri et al. 2012) to identify those sources where AGN can be present. They employ a colour cut using the two shortest wavelength observing bands, W1W2 (where W1 and W2 are the m and m observing bands, respectively) to ensure the selection of AGN candidates, a colour-cut that has been shown to be the most effective at finding AGNs in late stage mergers based on hydrodynamic simulations (Blecha et al. 2018). They conducted X-ray follow-up observations of selected sources from this sample, where the separation of the assumed AGN can be resolved spatially by the Chandra X-ray satellite. In their pilot study, four sources from the observed six showed two distinct X-ray components indicating that they possibly host dual AGNs at separations kpc. In a follow-up study, Pfeifle et al. (2019b) found that out of merging galaxy systems had multiple nuclear X-ray sources suggestive of dual AGN.
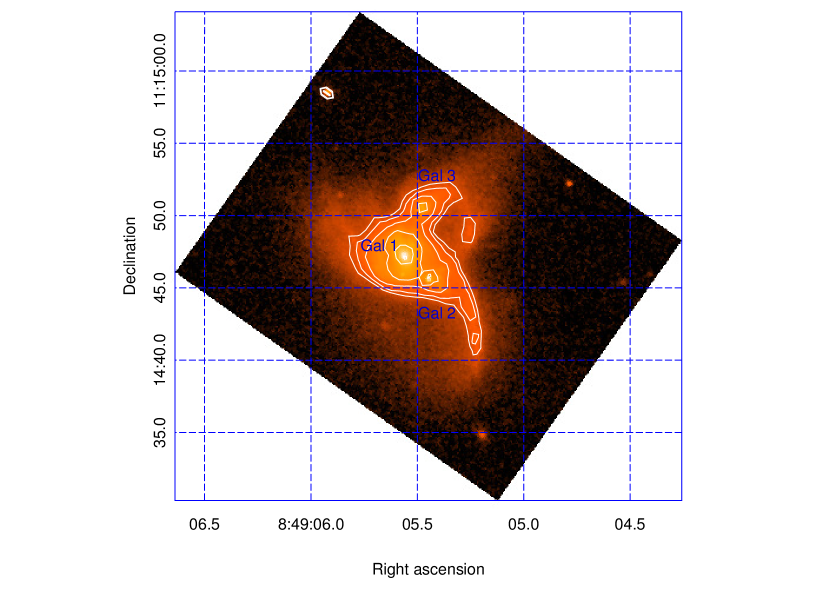
One of those sources, J08491114 is a system of three interacting galaxies within projected separation (Fig. 1), all of them exhibiting nuclear X-ray sources with keV luminosities in excess of the expected star formation and showing optical line ratios consistent with AGN photoionization processes (Pfeifle et al. 2019a, b). In the twelfth data release of the Sloan Digital Sky Survey (SDSS DR12, Alam et al. 2015) Galaxy 1 is listed as SDSS J084905.51111447.2 and Galaxy 3 as SDSS J084905.43111450.9.
Recently, Liu et al. (2019) also reported on the existence of three AGN in J08491114. According to the authors, all three stellar nuclei can be classified as Seyfert 2 galaxies. They detected radio emission features at GHz with the Karl G. Jansky Very Large Array (VLA) at the positions of Galaxy 1 and Galaxy 3 (Fig. 1).
Here, we report on the results of the milliarcsec (mas) scale resolution very long baseline interferometry (VLBI) observation of J08491114 performed by the European VLBI Network (EVN). In the following, we define the radio spectral index, as , where is the flux density and is the observing frequency. We assume a flat CDM cosmological model with , and . At the redshift of J08491114, , mas angular separation corresponds to pc projected linear distance (Wright 2006).
2 Observation and data reduction
| Antenna name | Diameter (m) | Observing time |
|---|---|---|
| Jodrell Bank Mk2 (United Kingdom) | 20:0022:05 | |
| Westerbork Synthesis Radio Telescope (the Netherlands)a𝑎aa𝑎aOne antenna was used. | 20:0022:05 | |
| Effelsberg (Germany) | 20:0020:35 | |
| Medicina (Italy) | 20:0021:40 | |
| Onsala (Sweden) | 20:0022:05 | |
| Tianma (China) | 20:0022:05 | |
| Toruń (Poland) | 20:0022:05 | |
| Hartebeesthoek (South Africa) | 20:0022:05 | |
| Irbene (Latvia) | 20:0022:05 | |
| Sardinia (Italy) | 20:0022:05 |
An exploratory EVN observation of J08491114 was conducted on 2019 Jan 22 (project code: RS09b) at GHz. The names, diameters and observing times of the participating antennas are given in Table 1. At the end, data from all antennas except Medicina and Irbene were used to create the final map of the source. Eight intermediate frequency channels (IFs) each with MHz bandwidth were used in both left and right circular polarization. Each IF was divided to spectral channels. The observation was carried out in e-VLBI mode (Szomoru 2008). The data from the antenna sites were transferred through optical fiber connection to the Joint Institute for VLBI ERIC, Dwingeloo (in the Netherlands), where they were correlated with an integration time of s.
The observation lasted for h, and the on-source integration time was min. The observation was conducted in phase-reference mode (Beasley & Conway 1995), using J08510845 as the phase reference calibrator (target separation: ). An additional phase-reference candidate source, J08501108 (target separation: ) was also included in the observation. For the target source, we used the coordinates from the Faint Images of the Radio Sky at Twenty-centimeters survey (FIRST, Helfand et al. 2015) as phase centre, right ascension , and declination .
For calibration, we followed standard procedures (Diamond 1995) using the NRAO Astronomical Image Processing System (aips, Greisen 2003). The amplitudes of the interferometric visibilities were calibrated using the antenna gain curves and the system temperatures measured at the telescope sites.333Only nominal system temperature values were available for the Jodrell Bank Mk2 and the Toruń antennas. Fringe-fitting was performed for the phase calibrator. The fringe-fitted data of the phase calibrator source were imaged using the difmap software package (Shepherd et al. 1994) following standard hybrid mapping procedure, which included several cycles of cleaning (Högbom 1974), phase-only self-calibration and finally amplitude self-calibration. The antenna-based gain correction factors determined in difmap were applied to the data in aips444The flux density of the phase calibrator source before and after applying the gain scales was 124 mJy and 108 mJy, respectively.. A new fringe-fit of the calibrator was performed, now taking into account the clean model components describing its brightness distribution, to reduce the small residual phase errors due to its structure. The obtained solutions were applied to the target source J08491114 and to the candidate secondary phase reference source, J08501108. Then both of them were imaged in difmap.
To obtain the lowest noise-level image of J08491114, natural weighting was used and instead of several point-like clean components, a single circular Gaussian brightness distribution model was fitted to the visibility data. The value of the reduced , , indicates an adequate fit to the data. The resulting image of J08491114 is shown in Fig. 2.
Due to the faintness of the target source, no self-calibration was attempted. The imperfect phase correction can result in a coherence loss which can lead to a flux density loss in the detected source. To estimate the amount of coherence loss, we turned to the candidate phase calibrator source, J08501108. We mapped the dataset obtained after fringe-fitting of J08501108 and the one obtained by phase solution transfer from the phase calibrator. In the latter case, the recovered flux density was % lower compared to fringe-fitting. This is in agreement with typical coherence loss values (e.g., Mosoni et al. 2006).
3 Results
We detected a radio feature slightly extended to the north in J08491114. Using the aips task maxfit, we derived the position of the brightness peak, right ascension , and declination . The positional uncertainty of the phase calibrator source is mas.555Global VLBI solution rfc_2019a catalog, available at the astrogeo.org website, maintained by L. Petrov By far the dominant contribution to the positional uncertainty ( mas) is caused by the angular separation between the target and the phase reference source (e.g., Chatterjee et al. 2004; Rioja et al. 2017). Thus, the derived coordinates are accurate within mas.
The integrated flux density of the fitted Gaussian brightness distribution is mJy. After accounting for the coherence loss, the flux density of the radio feature is mJy. In the following, we use this flux density value. The full width at half maximum (FWHM) size of the Gaussian model component, mas (corresponding to pc projected size), is larger than the smallest resolvable size of this observation ( mas, Kovalev et al. 2005), therefore it can be used to derive the brightness temperature of the mas-scale radio emitting feature:
| (1) |
where is measured in Jy, in mas, is the observing frequency in GHz. The resulting brightness temperature, K, is two orders of magnitude higher than the brightness temperature limit measured above GHz for star forming-galaxies ( K, Condon 1992).
Assuming a flat radio spectrum (), the -GHz radio power is . (Owing to the small redshift of the source, the spectral index assumption does not significantly influence the obtained radio power.) According to Kewley et al. (2000) and Middelberg et al. (2011), the radio power of an AGN core exceeds . Few violent star-forming galaxies are known to have supernova complexes exceeding this value, e.g., Arp 299-A and Arp-220, with a -GHz power of and , respectively (Alexandroff et al. 2012, and references therein). However, the radio power of the detected feature J08491114 surpasses these values as well.
We did not detect any other mas-scale radio feature down to a noise-level of within a region of around the source that covers the cores of all galaxies in the interacting system. According to the EVN sensitivity calculator666http://old.evlbi.org/cgi-bin/EVNcalc, bandwidth smearing and time-average smearing (Wrobel 1995) limit the undistorted field of view of our EVN observation to an area with radii and , respectively. Thus, all three galaxy cores are within the observed field, where the smearing effects would not reduce significantly the response to a point source (the expected flux density loss is ).
4 Discussion
The detected mas-scale radio feature (Fig. 2) is positionally coincident with Galaxy 1 of Pfeifle et al. (2019b). Its high brightness temperature and 1.7-GHz radio power indicate that the radio emission originates from an AGN. Thus, we can confirm there is a radio-emitting AGN in Galaxy 1.
Using the fundamental plane of black hole activity (Gültekin et al. 2019), the black hole mass can be estimated from the keV X-ray (), and the -GHz radio luminosity. Pfeifle et al. (2019a) gave for the core of Galaxy 1 using a combination of Chandra observations conducted in 2013 and 2016. To estimate the -GHz luminosity of the mas-scale radio core, we use the spectral index range found by Giroletti & Panessa (2009), , for the mas-scale cores of faint Seyfert galaxies. The obtained black hole mass estimates range between (for ) and (for ). Pfeifle et al. (2019a) reported the detection of broad Pa emission lines in Galaxies 1 and 3. According to the relationship between the emission line and the black hole mass (Landt et al. 2013), the measured value implies a black hole mass of for Galaxy 1. Since the internal scatter of both relationships are dex, and because of the non-simultaneous X-ray and radio observations the estimate from the fundamental plane can also be affected by brightness variability, we can regard the obtained black hole masses as not incompatible. These estimates all indicate that the measured X-ray, radio and Pa emission line characteristics can be explained by an SMBH residing in the core of Galaxy 1.
The recovered flux density in our EVN observation, mJy is much less than the one measured at a close frequency, GHz within the FIRST survey (Helfand et al. 2015), mJy. While it could also be related to source variability, it is most likely that the missing mJy flux density is in more extended structure for which our EVN observation is not sensitive. The largest recoverable feature in an interferometric observation is defined by the shortest baseline in the array (Wrobel 1995). In our case, this is the EffelsbergWesterbork baseline with km. The corresponding largest recoverable size at GHz is mas, thus significant radio emission may be contained in features extending above this limit.
The low resolution of FIRST () does not allow us to relate the radio emission to any of the three interacting galaxies. The 1.4-GHz radio power corresponding to the flux density not detected by our EVN observation ( mJy) is . If we assume that this is caused only by star formation in the galaxies, it implies a summed star formation rate of (Hopkins et al. 2003). Izotov et al. (2014), who used multi-wavelength data to derive the spectral energy distribution and the star formation rate for a large sample of galaxies, obtained a star formation rate of for the galaxy group J08491114. Pfeifle et al. (2019a) estimated an upper limit for the star formation rate assuming no AGN contribution in the system. The summed value for the three galaxies is . These numbers indicate that star formation alone cannot be responsible for this mJy flux density, and AGN-related processes must dominate the -GHz radio emission. The rms noise level of our map implies that there is no other compact radio-emitting AGN with -GHz radio power larger than in a region encompassing the two other galaxies. However, the existence of an extremely low-power radio AGN cannot be ruled out. Even so, most of the AGN-related emission must be in large, at least hundred mas-scale lobe(s).
Liu et al. (2019) report the results of a VLA A configuration observation of J08491114 at GHz. They detected radio emission at the position of Galaxy 1 with a flux density of mJy and peak intensity of , and at the position of Galaxy 3 with a flux density of mJy and peak intensity of . Assuming for the compact, mas-scale core for the AGN in Galaxy 1, and subtracting mJy from the flux density measured at GHz, the emission at arcsec scales is expected to be mJy. Then the spectral index of the arcsec-scale structure between and GHz can be estimated, . This value is close to the average spectral index, derived for a sample of Seyfert galaxies using VLA observations by Ho & Peng (2001). Thus, the radio flux densities measured at high and low resolutions and at and GHz can be explained with a compact core and extended emission region related to radio-emitting AGN. However, whether the radio emission detected at the position of Galaxy 3 by Liu et al. (2019) is related to the AGN in that Seyfert galaxy, or if it is an extended jet-like feature of the radio AGN in Galaxy 1 cannot be ascertained. More sensitive VLBI (to reveal the faint radio-emitting AGN in Galaxy 3 if it exists) and/or intermediate resolution multi-frequency radio interferometric observations (to map the structure and spectral shape of the radio emission between Galaxy 1 and 3) could answer this question.
5 Summary
We conducted -GHz high-resolution VLBI observation of the merging triple galaxy system, J08491114, which shows convincing multi-wavelength evidence for a triple AGN system (Pfeifle et al. 2019a, b; Liu et al. 2019). We detected a high brightness temperature, compact radio feature in Galaxy 1, thus we can confirm the existence of a radio AGN there. Compared to lower resolution radio data, a significant amount of flux density remained undetected in our EVN observation. The amount of star formation derived for the system from independent methods cannot be responsible for most of this flux density. Thus, AGN-related emission, probably from mas-scale lobe-like feature(s) must contribute to it. Whether the large-scale emission is related to the EVN-detected compact AGN in Galaxy 1 or to a very low luminosity and thus by us undetected AGN in another nucleus is not clear. Nevertheless, the latter scenario is suggested by the -GHz radio observation of Liu et al. (2019) which showed arcsec-scale radio emission at the position of Galaxy 3.
Acknowledgements.
K.É.G. was supported by the János Bolyai Research Scholarship of the Hungarian Academy of Sciences and by the Ministry of Human Capacities within the framework of the ÚNKP (New National Excellence Program). The European VLBI Network is a joint facility of independent European, African, Asian, and North American radio astronomy institutes. Scientific results from data presented in this publication are derived from the following EVN project code: RS09b. e-VLBI research infrastructure in Europe is supported by the European Union’s Seventh Framework Programme (FP7/2007-2013) under grant agreement number RI-261525 NEXPReS. This publication has received funding from the European Union’s Horizon 2020 research and innovation programme under grant agreement No. 730562 [RadioNet].References
- Alam et al. (2015) Alam, S., Albareti, F. D., Allende Prieto, C., et al. 2015, ApJS, 219, 12
- Alexandroff et al. (2012) Alexandroff, R., Overzier, R. A., Paragi, Z., et al. 2012, MNRAS, 423, 1325
- Beasley & Conway (1995) Beasley, A. J. & Conway, J. E. 1995, in Astronomical Society of the Pacific Conference Series, Vol. 82, Very Long Baseline Interferometry and the VLBA, ed. J. A. Zensus, P. J. Diamond, & P. J. Napier, 327
- Begelman et al. (1980) Begelman, M. C., Blandford, R. D., & Rees, M. J. 1980, Nature, 287, 307
- Blecha et al. (2018) Blecha, L., Snyder, G. F., Satyapal, S., & Ellison, S. L. 2018, MNRAS, 478, 3056
- Capelo et al. (2015) Capelo, P. R., Volonteri, M., Dotti, M., et al. 2015, MNRAS, 447, 2123
- Chatterjee et al. (2004) Chatterjee, S., Cordes, J. M., Vlemmings, W. H. T., et al. 2004, ApJ, 604, 339
- Condon (1992) Condon, J. J. 1992, ARA&A, 30, 575
- Cutri et al. (2012) Cutri, R. M. et al. 2012, VizieR Online Data Catalog, II/311
- Diamond (1995) Diamond, P. J. 1995, in Astronomical Society of the Pacific Conference Series, Vol. 82, Very Long Baseline Interferometry and the VLBA, ed. J. A. Zensus, P. J. Diamond, & P. J. Napier, 227
- Giroletti & Panessa (2009) Giroletti, M. & Panessa, F. 2009, ApJ, 706, L260
- Greisen (2003) Greisen, E. W. 2003, in Astrophysics and Space Science Library, Vol. 285, Information Handling in Astronomy - Historical Vistas, ed. A. Heck, 109
- Gültekin et al. (2019) Gültekin, K., King, A. L., Cackett, E. M., et al. 2019, ApJ, 871, 80
- Helfand et al. (2015) Helfand, D. J., White, R. L., & Becker, R. H. 2015, ApJ, 801, 26
- Ho & Peng (2001) Ho, L. C. & Peng, C. Y. 2001, ApJ, 555, 650
- Högbom (1974) Högbom, J. A. 1974, A&AS, 15, 417
- Hopkins et al. (2003) Hopkins, A. M., Miller, C. J., Nichol, R. C., et al. 2003, ApJ, 599, 971
- Izotov et al. (2014) Izotov, Y. I., Guseva, N. G., Fricke, K. J., & Henkel, C. 2014, A&A, 561, A33
- Kewley et al. (2000) Kewley, L. J., Heisler, C. A., Dopita, M. A., et al. 2000, ApJ, 530, 704
- Kovalev et al. (2005) Kovalev, Y. Y., Kellermann, K. I., Lister, M. L., et al. 2005, AJ, 130, 2473
- Landt et al. (2013) Landt, H., Ward, M. J., Peterson, B. M., et al. 2013, MNRAS, 432, 113
- Liu et al. (2019) Liu, X., Hou, M., Li, Z., et al. 2019, arXiv e-prints, arXiv:1907.10639
- Middelberg et al. (2011) Middelberg, E., Norris, R. P., Hales, C. A., et al. 2011, A&A, 526, A8
- Mosoni et al. (2006) Mosoni, L., Frey, S., Gurvits, L. I., et al. 2006, A&A, 445, 413
- Pfeifle et al. (2019a) Pfeifle, R. W., Satyapal, S., Manzano-King, C., et al. 2019a, ApJ in press, arXiv:1908.01732
- Pfeifle et al. (2019b) Pfeifle, R. W., Satyapal, S., Secrest, N. J., et al. 2019b, ApJ, 875, 117
- Rioja et al. (2017) Rioja, M. J., Dodson, R., Orosz, G., Imai, H., & Frey, S. 2017, AJ, 153, 105
- Satyapal et al. (2017) Satyapal, S., Secrest, N. J., Ricci, C., et al. 2017, ApJ, 848, 126
- Shepherd et al. (1994) Shepherd, M. C., Pearson, T. J., & Taylor, G. B. 1994, BAAS, 26, 987
- Szomoru (2008) Szomoru, A. 2008, in The role of VLBI in the Golden Age for Radio Astronomy, PoS(IX EVN Symposium)040
- Volonteri et al. (2003) Volonteri, M., Haardt, F., & Madau, P. 2003, ApJ, 582, 559
- Wright (2006) Wright, E. L. 2006, PASP, 118, 1711
- Wrobel (1995) Wrobel, J. M. 1995, in Astronomical Society of the Pacific Conference Series, Vol. 82, Very Long Baseline Interferometry and the VLBA, ed. J. A. Zensus, P. J. Diamond, & P. J. Napier, 411