A rapidly declining transient discovered with Subaru/Hyper Suprime-Cam
Abstract
We perform a high-cadence transient survey with Subaru Hyper Suprime-Cam (HSC), which we call the Subaru HSC survey Optimized for Optical Transients (SHOOT). We conduct HSC imaging observations with time intervals of about one hour on two successive nights, and spectroscopic and photometric follow-up observations. A rapidly declining blue transient SHOOT14di at is found in observations on two successive nights with an image subtraction technique. The rate of brightness change is () in the observer (rest) frame and the rest-frame color between and Å is . The nature of the object is investigated by comparing its peak luminosity, decline rate, and color with those of transients and variables previously observed, and those of theoretical models. None of the transients or variables share the same properties as SHOOT14di. Comparisons with theoretical models demonstrate that, while the emission from the cooling envelope of a Type IIb supernova shows a slower decline rate than SHOOT14di, and the explosion of a red supergiant star with a dense circumstellar wind shows a redder color than SHOOT14di, the shock breakout at the stellar surface of the explosion of a red supergiant star with a small explosion energy of erg reproduces the multicolor light curve of SHOOT14di. This discovery shows that a high-cadence, multicolor optical transient survey at intervals of about one hour, and continuous and immediate follow-up observations, is important for studies of normal core-collapse supernovae at high redshifts.
1 INTRODUCTION
Traditional transient surveys have been performed mainly with a cadence of several days in order to catch large numbers of Type Ia supernovae. Searching the transient sky at a shorter timescale has gained attention as a new frontier of astronomy in this decade. In particular, time scales as short as day have been intensively investigated by transient surveys with wide-field cameras, e.g., the Palomar Transient Factory (PTF, Law et al. 2009; Rau et al. 2009) and Zwicky Transient Facility (ZTF, Graham et al. 2019) with a m telescope, the Catalina Real-Time Transient Survey with a m telescope (CRTS, Drake et al. 2009), the Kiso Supernova Survey with a m telescope (KISS, Morokuma et al. 2014), and the High-cadence Transient Survey with a m telescope (HiTS, Förster et al. 2016).
Several phenomena are theoretically proposed to appear in ultraviolet and optical bands at the short time scale of day and will offer new insights, especially on the final stages of the evolution of massive stars. For example, the emission from a shock breakout at the stellar surface (Klein & Chevalier, 1978) and in the dense wind (Chevalier & Irwin, 2011) and subsequent emission from the cooling envelopes (Waxman et al., 2007; Nakar & Sari, 2010) of core-collapse supernovae of red supergiant stars, have characteristic time scales of hr to several days. Studying such transients will reveal the stellar radius and the structure of the circumstellar medium surrounding the progenitor star, and thus the mass loss just before the core collapse.
Ultraviolet observations with the GALEX satellite (Morrissey et al., 2005, 2007) reveal a brightening at the position of Type II plateau supernovae; SNLS-04D2dc (, Schawinski et al. 2008; Gezari et al. 2008), SNLS-06D1jd (, Gezari et al. 2008), and PS1-13arp (, Gezari et al. 2015). The UV brightening of SNLS-04D2dc is well reproduced by the emission of the shock breakout at the stellar surface of a star with a zero-age main sequence mass of , solar metallicity, i.e., , and a canonical explosion energy ergs (Tominaga et al., 2009). Also, a rapid rise detected by the Kepler satellite is also reported for KSN 2011d (, Garnavich et al. 2016) but the detection has been questioned by Rubin & Gal-Yam (2017). Recently, the rising part of the shock breakout is firmly detected for the Type IIb SN 2016gkg by a fortunate amateur astronomer, and exhibits a fast rise rate of mag day-1 (Bersten et al., 2018). A fast rise rate of mag day-1 is also found in a broad-lined stripped-envelope supernova SN2018gep, and is interpreted as a shock breakout in a massive shell of dense circumstellar medium (CSM, Ho et al. 2019).
On the other hand, the UV emission of PS1-13arp is mag brighter than that of SNLS-04D2dc and its rise time and duration are times longer than the radiative diffusion time and the light-crossing time of the shock breakout at the stellar surface (Gezari et al., 2015), and thus the UV burst is interpreted as a shock breakout in a circumstellar wind with high mass loss rate of . The shock breakout in a dense wind is also proposed for the Type IIn SN PTF 09uj (Ofek et al., 2010). Its NUV light curve rises with a timescale of a few days to an absolute magnitude of mag. Its peak brightness and rapid rise have been attributed to the shock breakout in a dense circumstellar wind with a high mass loss rate of .
Furthermore, immediate optical follow-up spectroscopic observations exhibit flash-ionized signatures (Gal-Yam et al., 2014) and reveal that the Type II plateau SN SN 2013fs is surrounded by a dense CSM (Yaron et al. 2017). The signature of dense CSM might appear in the rapid rise in SNe IIP (Morozova et al., 2016), and the variation of the rising timescale might be explained by variations in the dense CSM (Morozova et al., 2017; Moriya et al., 2018). On the other hand, the existence of dense CSM is inconsistent with the UV emission of SNLS-04D2dc. Förster et al. (2018) performed light curve fitting of the SNe II LC discovered by the HiTS with theoretical models (Moriya et al., 2018) and found that 24 of 26 SNe II have a rapid rise that can be explained by dense CSM with a mass loss rate of . These observations imply variations in the final phases of stellar evolution. High-cadence observations are needed to reveal the final stages of these massive stars.
Therefore, we performed a high-cadence transient survey with Hyper Suprime-Cam (HSC, Miyazaki et al. 2006, 2012)111http://www.subarutelescope.org/Observing/Instruments/HSC/index.html with a field of view of . This is the most powerful instrument, with the highest light-collecting power per unit time, currently available to detect rapid transients. We also conducted follow-up observation as part of a Subaru HSC survey Optimized for Optical Transients (SHOOT). In this paper, we focus on a rapidly declining transient named SHOOT14di found in the SHOOT Jul 2014 run; rapidly rising transients from that run are summarized in Tanaka et al. (2016).
| UT | MJD | Epoch | Instrument | Filter | Exposure time | FluxaaCorrected for the Galactic extinction with the color excess of mag. | Flux erroraaCorrected for the Galactic extinction with the color excess of mag. | AB magnitude | Significance | SeeingbbFull width at half maximum. |
|---|---|---|---|---|---|---|---|---|---|---|
| [s] | [Jy] | [Jy] | [mag] | [] | [arcsec] | |||||
| 2014-07-02 | 56840.554 | Day 1 | HSC | 600 | 0.042 | 0.566 | ||||
| 2014-07-02 | 56840.591 | Day 1 | HSC | 600 | 0.041 | 0.485 | ||||
| 2014-07-02 | 56840.610 | Day 1 | HSC | 600 | 0.043 | 0.523 | ||||
| 2014-07-03 | 56841.525 | Day 2 | HSC | 600 | 0.043 | ddCalculated from the error. | 0.665 | |||
| 2014-07-03 | 56841.559 | Day 2 | HSC | 600 | 0.044 | ddCalculated from the error. | 0.581 | |||
| 2014-07-03 | 56841.596 | Day 2 | HSC | 600 | 0.040 | 0.552 | ||||
| 2014-07-03 | 56841.615 | Day 2 | HSC | 600 | 0.057 | ddCalculated from the error. | 0.600 | |||
| 2014-08-05 | 56874.339 | Day 35 | FOCAS | 960 | 0.090 | ddCalculated from the error. | 0.872 | |||
| 2015-05-24 | 57166.513 | Day 327 | HSC | 960 | —ccUsed for the reference image. | —ccUsed for the reference image. | —ccUsed for the reference image. | —ccUsed for the reference image. | 0.950 | |
| 2014-07-02 | 56840.585 | Day 1 | HSC | 1800 | 0.036 | 0.523 | ||||
| 2014-07-03 | 56841.574 | Day 2 | HSC | 2400 | 0.037 | 0.593 | ||||
| 2014-07-02 | 56840.467 | Day 1 | HSC | 600 | 0.052 | 0.799 | ||||
| 2014-07-03 | 56841.445 | Day 2 | HSC | 600 | 0.065 | ddCalculated from the error. | 0.545 | |||
| 2014-08-05 | 56874.326 | Day 35 | FOCAS | 960 | 0.098 | ddCalculated from the error. | 0.950 | |||
| 2015-08-19 | 57253.501 | Day 414 | HSC | 1440 | —ccUsed for the reference image. | —ccUsed for the reference image. | —ccUsed for the reference image. | —ccUsed for the reference image. | 1.410 |
This paper consists of following sections. In Section 2, the observations are described. In Section 3, observational properties of SHOOT14di are summarized. In Sections 4 and 5, these properties of SHOOT14di are compared with those of known transients and variables, and of theoretical models, respectively. In Section 6, we discuss the findings and present our conclusions. In this paper, we adopt the AB magnitude system and the WMAP5 cosmological parameters: , , , and (Komatsu et al., 2009).
| UT | Epoch | Instrument | Filter | Exposure time | CModel FluxaaUncorrected for the Galactic extinction with the color excess of mag. | Flux erroraaUncorrected for the Galactic extinction with the color excess of mag. | SeeingbbFull width at half maximum. |
|---|---|---|---|---|---|---|---|
| [s] | [Jy] | [Jy] | [arcsec] | ||||
| 2015-05-24 | Day 327 | HSC | 960 | 0.473 | 0.028 | 0.950 | |
| 2015-08-19 | Day 414 | HSC | 1440 | 0.743 | 0.038 | 1.410 | |
| 2016-05-07 | Day 676 | S-Cam | 1500 | 0.678 | 0.036 | 1.102 | |
| 2016-05-07 | Day 676 | S-Cam | 1500 | 0.814 | 0.047 | 0.778 | |
| 2016-05-07 | Day 676 | S-Cam | 3600 | 0.902 | 0.230 | 0.809 |
2 Observations and data reduction
2.1 Imaging observations of transients
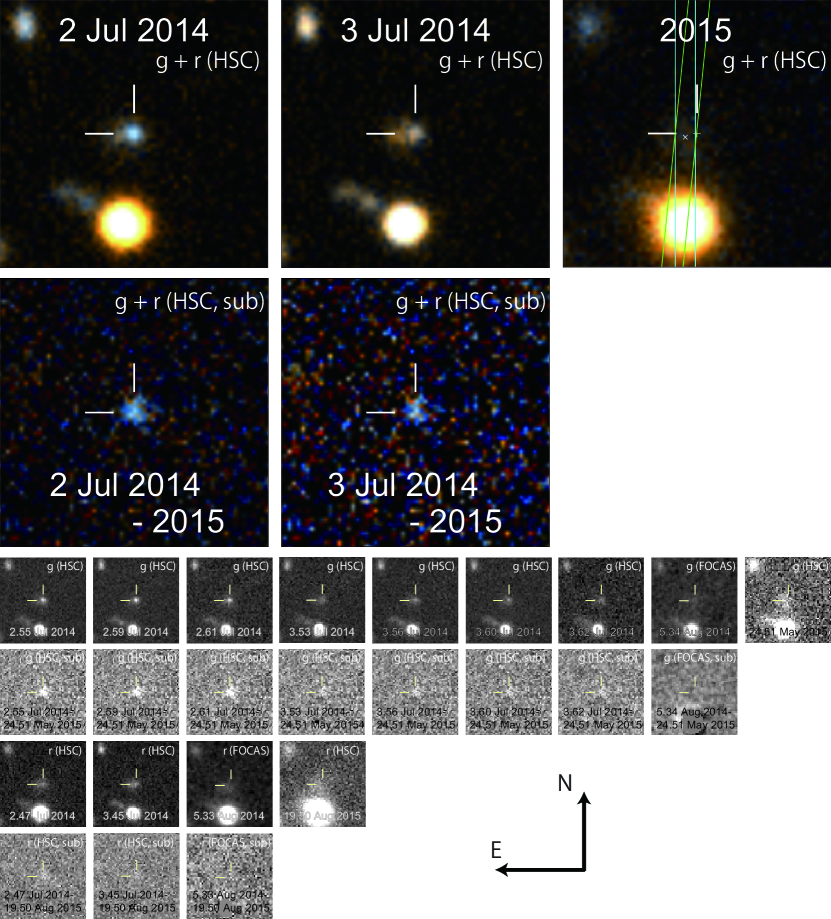
The - and -band imaging observations were carried out on 7 fields with HSC on 2 and 3 Jul 2014 (UT) (Days 1 and 2). In this paper, we focus on a candidate SHOOT14di at , (J2000.0) found in one of our survey fields (Figure 1). The field was observed three times in the band and once in the band on Day 1, and four times in the band and once in the band on Day 2. Each exposure unit on Days 1 and 2 consists of five min frames with ditherings, and the time intervals between the exposure units are about an hour. We also took - and -band images of min exposures with Subaru Faint Object Camera And Spectrograph (FOCAS; Kashikawa et al. 2002) on 5 Aug 2014 (Day 35), a -band image of min exposure with HSC on 24 May 2015 (UT) (Day 327), and an -band image of min exposure with HSC on 19 Aug 2015 (UT) (Day 414). The details of the imaging observations of transients are summarized in Table 1.
For our transient search, the HSC data are reduced using HSC pipeline222A prototype is described in Furusawa et al. (2010). (Bosch et al., 2018) version 3.6.1, which is based on the LSST pipeline (Ivezic et al., 2008; Axelrod et al., 2010). It provides packages for bias subtraction, flat fielding, astrometry, flux calibration, mosaicing, warping, coadding, and image subtraction. The astrometry and photometry are made relative to the Sloan Digital Sky Survey (SDSS) DR8 (Aihara et al., 2011) with a arcsec ( pixel) diameter aperture. We developed a quick image subtraction system with the HSC pipeline and performed realtime transient finding (Tominaga et al., 2014a), in cooperation with an on-site data analysis system (Furusawa et al. 2011, 2018). This enables us to report numerous SN candidates immediately after the observing runs (Tominaga et al., 2014a, b, 2015a, 2015b), and to search for optical counterparts of gravitational waves and fast radio bursts (Utsumi et al., 2018; Tominaga et al., 2018a, b). On the other hand, the image subtractions between the HSC images and the FOCAS images are made with HOTPANTS (Becker, 2015) after warping the HSC images with WCSRemap. For these image subtractions, the difference imaging method of Alard & Lupton (Alard & Lupton, 1998; Alard, 2000) is adopted, which handles point-spread function (PSF) variations and allows successful image subtraction between images with different PSF sizes.
In order to detect candidates with short time variabilities, the first - and -band images obtained on Day 1 are set as reference images for the image subtraction. Objects with more than one detection at significance higher than in the difference images are selected as rapid transient candidates. In other words, the candidates show variability between observations on two successive nights. On the other hand, for the photometry, we adopt images taken on Day 327 and Day 414 as reference images for the and bands, respectively, and subtract the reference images from hourly-stacked and daily-stacked images of Days 1 and 2. We evaluate astrometric accuracy in the difference images by a random injection of artificial point sources to images before warping, coadding, and image subtraction. After warping, coadding, image subraction, and source detection, the positions of artificial sources with mag are recovered to a median accuracy of arcsec. The fluxes are measured with aperture photometry using a arcsec-diameter aperture on the difference images (Figure 2).
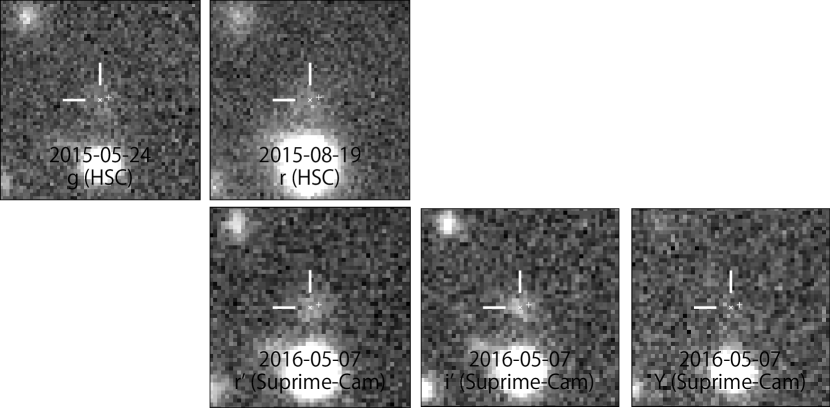
2.2 Imaging observations of the host galaxy
In addition to the -band observation with HSC on Day 327 and the -band observation with HSC on Day 414, we performed -, -, and -band imaging observations with Suprime-Cam (Miyazaki et al., 2002) on 7 May 2016 (UT) (Day 676), in order to derive properties of a host galaxy at , (J2000.0) (Figure 3). For the multi-band photometry of the host galaxy, we adopt HSC pipeline version 4.0.1 to derive consistently composite model (CModel) fluxes with exponential and de Vaucouleurs fits.333http://www.sdss.org/dr12/algorithms/magnitudes/#cmodel The imaging observations and photometry of a host galaxy are summarized in Table 2. As the pixel scales of Suprime-Cam and HSC are different, the multi-band data analysis is separately performed for Suprime-Cam and HSC images. The discrepancy between the -band flux with an HSC image and the -band flux with a Suprime-Cam image is taken into account as a systematic error in the subsequent analysis. The position of host galaxy is also derived from the multi-band analyses (Bosch et al., 2018). The position in each image is measured by an approximate maximum-likelihood algorithm implemented in the HSC pipeline (Bosch et al. 2018, see also Pier et al. 2003). The method gives a median root-mean-square of arcsec at a seeing of arcsec in the SDSS with a pixel scale of arcsec (Pier et al., 2003). We adopt the average position of the host galaxy derived by the multi-band analyses of the HSC images and the Suprime-Cam images. These multi-band analyses give a consistent position of the host galaxy within arcsec.
2.3 Spectroscopic observation
Optical spectroscopic observations were carried out with FOCAS on the 8.2-m Subaru telescope on 5 August 2014 (Day 35) and with the Gemini Multi-Object Spectrograph (GMOS) (Hook et al., 2004) on the 8.1-m Gemini-North telescope on 10 and 11 Jun 2016 (Days 710 and 711).
In the FOCAS observation, we aimed to take a spectrum of the transient and took four -minute exposures. Low-resolution spectra () were obtained in the multi-object slit mode with the -width slit, 300 lines mm-1 blue (300B) grism, and the SY47 order-sort filter, providing wavelength coverage of Å- Å. We adopted the binning mode in spatial and spectral directions, respectively. The obtained spatial and spectral samplings are 0.208 arcsec pixel-1 and Å pixel-1, respectively. A standard star, BD+28d4211, was observed on the same night in the same observing mode and is used for flux calibration. The data are reduced with the IRAF packages (Tody, 1986, 1993) in a standard manner.
In addition, we took four -minute exposures with GMOS to take the host galaxy spectrum on 10 and 11 June, 2016. A medium-resolution spectrum () was obtained in the long slit mode with the -width slit, 831 lines mm-1 (R831_G5302) grism, and the GG455_G0305 order-sort filter, providing the wavelength coverage of Å- Å. We adopted the binning mode and the obtained spatial and spectral samplings are 0.145 arcsec pixel-1 and Å pixel-1, respectively. We stacked the four spectra after removing cosmic rays from each 2-dimensional spectrum. We use a standard star, Feige 34, for flux calibration, based on observations taken on 24 April 2016 in a different configuration, with the same grism and no order-sort filter. The effects on our flux calibration of these different configurations for the target and the standard star are evaluated in the next paragraph. The data are reduced with the Gemini-IRAF reduction software package in a standard manner.
The slit of the GMOS spectrum as well as that of the FOCAS spectrum was aligned with a nearby bright star, SDSS J213304.29+093551.6. The SDSS -band magnitude is according to SDSS DR14. The GMOS spectrum of this star is well matched with an M1-type star. An apparent -band magnitude of the star obtained by convolving the observed spectrum with the SDSS -band response function is 21.16 mag and the difference of the magnitudes is 0.56 mag, corresponding to a factor of 1.67 in brightness. This is attributed to the different order-sorting filters between the target and standard star, slit losses, and atmospheric extinction. As observed line fluxes of the host galaxy measured in §3.2 are likely to be lost as the flux of SDSS J213304.29+093551.6 does, they are multiplied by a factor of 1.67.
3 Observational properties

3.1 SHOOT14di
Figure 1 shows the multicolor images constructed from the - and -band images taken with HSC, the monochromatic - and -band images taken with HSC and FOCAS, and the difference images after the image subtraction. An object with decline between Days 1 and 2 is found in the band at west and north of the host galaxy. The full width at half maximum size of the host galaxy is in the band image taken on Day 2.
The -band fluxes on Days 1 and 2 are and , respectively. The flux measurement with the -band daily-stacked images also gives consistent results. The -band flux declines at a rate of , corresponding to in the observer frame between Days 1 and 2. Here, the error is evaluated with a geometric mean of the flux errors. The -band flux on Day 1 is . On the other hand, nothing is significantly detected in the difference image between the -band images taken on Days 2 and 414, or in the difference image between the FOCAS and HSC images. The upper limits on Day 35 are in the band and in the band (using a arcsec diameter aperture). The fluxes are summarized in Table 1, and the - and -band light curves are shown in Figures 2(a) and 2(b). Here, the Galactic reddening is corrected with a color excess of mag (Schlafly & Finkbeiner, 2011)444http://irsa.ipac.caltech.edu/applications/DUST/ and a fitting function of the Galactic extinction curve (Pei, 1992).
In order to characterize time variability, we introduce a rate of brightness change at a wavelength within an interval in the rest frame. For SHOOT14di at (Section 3.2), day in the observer frame corresponds to day, and the effective rest wavelength is Å for the band. The observations illustrate that of SHOOT14di between Days 1 and 2 is . The rate at Å is also written in terms of magnitude as .

3.2 Host galaxy
The FOCAS spectrum taken on Day 35 does not show any SN features, which is reasonable considering the depth of the spectroscopic observations and the faintness of the transient on that day. We detected an emission line on the faint continuum from the host galaxy at Å. The second spectrum taken with GMOS focused on the wavelength region around this single emission line. Thanks to the higher resolution of the GMOS spectrum, we successfully detected another emission line at Å as shown in Figure 4. These two emission lines correspond to the [O III] doublet at . The HSC and Suprime-Cam broad-band photometry is fitted by a Bayesian photometric-redshift code (Tanaka, 2015) with the redshift fixed to the spectroscopic redshift to infer the stellar mass of the galaxy. Using the Bruzual & Charlot (2003) stellar population synthesis models for the Chabrier initial mass function (Chabrier, 2003), we find that the galaxy is a low-mass galaxy with . The code applies priors on the physical properties of galaxies such as star formation rate, stellar mass, age, and dust extinction, but the inferred stellar mass does not significantly change if we disable all the priors. The typical statistical uncertainty in the stellar mass is 0.2-0.3 dex when the redshift is fixed (Tanaka, 2015). This level of uncertainty does not affect the following discussions.
The combined line flux of the two [O III] emission lines is erg s-1 cm-2. Our detection of the H emission line is marginal. The gaussian-fitted and upper limits of H line flux are erg s-1 cm-2 and erg s-1 cm-2, respectively. The [O II] emission line at this redshift is not detected and only a weak upper limit of erg s-1 cm-2 () can be set. The lower limit of the flux ratio of roughly corresponds to a metallicity of (Nagao et al., 2006). Although [OIII] emission lines are not a good proxy for measuring the star formation rate of a galaxy in general, we use them here to put a constraint on the star formation rate of the host galaxy. We adopt a typical line flux ratio of (Juneau et al., 2014) to convert the [OIII] flux to H flux, which is roughly consistent with our measurements. Given the small stellar mass derived from the photometric-redshift code, we expect the dust extinction to be small or almost zero (Garn & Best, 2010). Then, assuming case B recombination and zero extinction, we obtain an H line luminosity of erg s-1 and star formation rate of 0.03 yr-1 (Kennicutt et al., 1994). Taking into account the extended nature of the host galaxy inferred from the difference between its Kron and PSF magnitude, its absolute flux density could be about three times larger than the current estimate, resulting in the star formation rate of yr-1. A ratio of the faint H emission line luminosity and faint absolute broad-band magnitude roughly follows previous results on H emitting galaxies (Tresse et al., 2002).
4 Comparisons with known transients and variables
4.1 Supernovae, rapid transients, and a kilonova
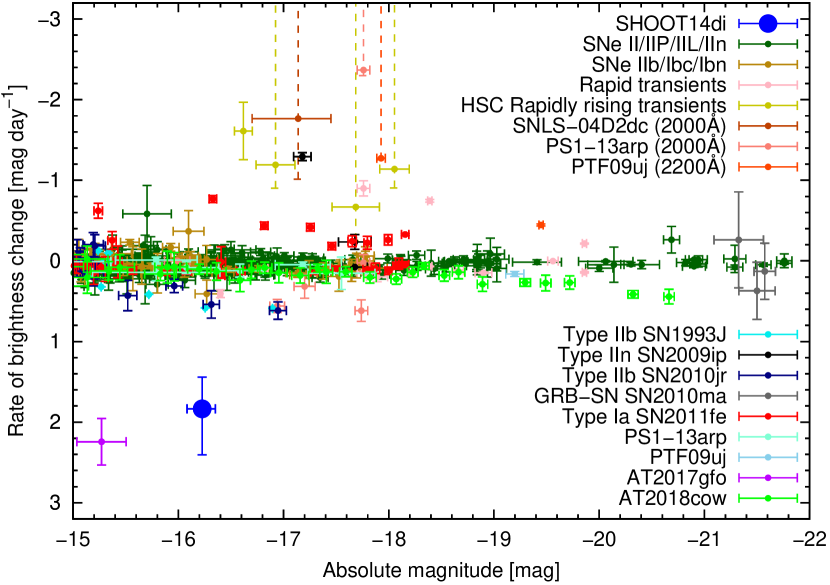
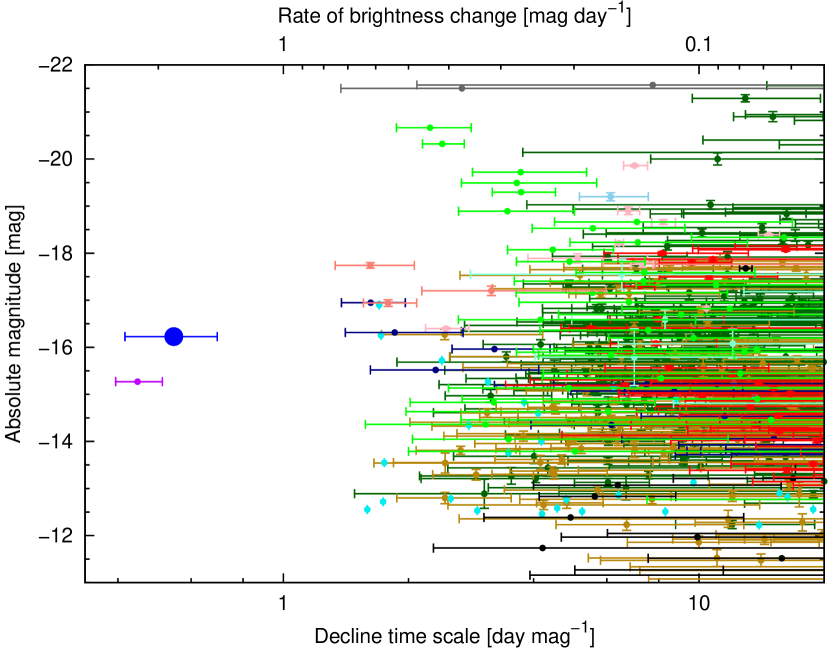
The peak magnitude, time variability, and color of SHOOT14di are compared with SNe, rapid transients recently pointed out by Drout et al. (2014), and a kilonova found in 2017 (Abbott et al., 2017). Figure 5 shows the rate of brightness change at Å as a function of the absolute magnitude (based on the brighter of the two observations used for the rate estimate), while Figure 6 shows the absolute magnitude at Å as a function of the time scale of the variability. Figure 7 is a color-magnitude diagram with an absolute magnitude at Å and a color, , derived with magnitudes at and Å. Figure 8 shows comparisons of light curves at Å with the other transients. The rate and color-magnitude diagram of other SNe and transients is derived from the - and -band light curves of nearby SNe obtained by the Swift Ultraviolet/Optical Telescope (UVOT) (Nugent et al., 2011; Brown et al., 2012; Pritchard et al., 2014), the - and -band light curves of SN 1993J (Richmond et al., 1994, 1996), the - and -band light curves of PTF 09uj after the shock breakout obtained by PTF (Ofek et al., 2010), the - and -band light curves of PS1-13arp after the shock breakout and rapid transients obtained by Pan-STARRS1 (Gezari et al., 2015; Drout et al., 2014), the - and -band light curves of the rapidly rising transients obtained by HSC (Tanaka et al., 2016), -, -, and -band light curves of a fast luminous ultraviolet transient AT2018cow (Prentice et al., 2018; Perley et al., 2019), and -, -, and -band light curves of a kilonova (AT2017gfo) associated with a gravitational wave source GW170817 (Andreoni et al. 2017; Arcavi et al. 2017; Coulter et al. 2017; Cowperthwaite et al. 2017; Díaz et al. 2017; Drout et al. 2017; Evans et al. 2017; Valenti et al. 2017; Kasliwal et al. 2017; Pian et al. 2017; Shappee et al. 2017; Smartt et al. 2017; Utsumi et al. 2017, summarized in Villar et al. 2017). We apply -corrections by interpolating or extrapolating their spectral energy distributions in magnitude. We also calculate the lower limits of the rise rates of SNLS-04D2dc, PTF 09uj, and PS1-13arp with upper limits at day or days before their detection and the rate of brightness change of PTF 09uj and PS1-13arp from their NUV light curves obtained with the GALEX satellite; however, -corrections are not applied to the NUV light curves of SNLS-04D2dc, PTF 09uj, and PS1-13arp because there are no simultaneous observations with high signal-to-noise ratios in other bands.

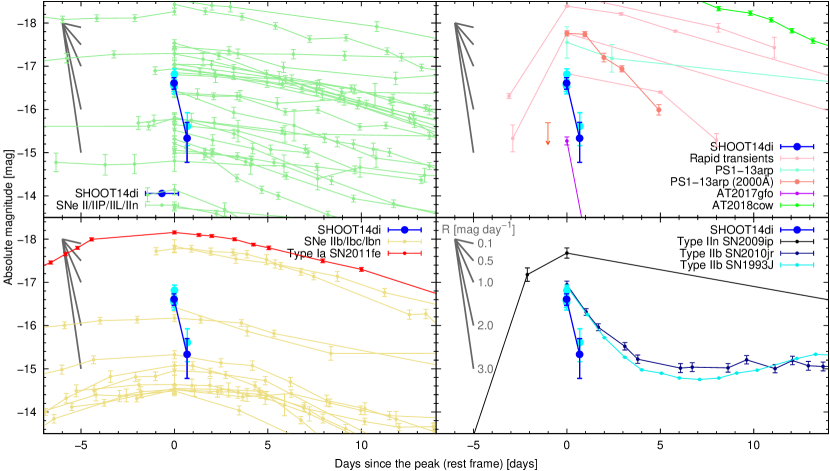
Figures 5, 6, 7, and 8 illustrate following characteristics of SHOOT14di.
-
•
All of SNe and SLSNe decline more slowly than SHOOT14di. The colors of most of them are redder than that of SHOOT14di (). The transient most similar to SHOOT14di is the cooling tail of the shock breakout of Type IIb supernovae. However, its brightness change is half as fast as that of SHOOT14di.
-
•
The colors of the GRB-associated Type Ic SN 2010ma and the shock breakout in the dense circumstellar wind of PTF 09uj are similar to that of SHOOT14di. The absolute rate of brightness change of PTF 09uj at the first NUV detection is consistent with that of SHOOT14di. However, their brightness is brighter than that of SHOOT14di and the rate of brightness change of PTF 09uj is slower than that of SHOOT14di at the same brightness.
-
•
The colors of rapid transients at their peak are as blue as that of SHOOT14di and their brightness is also consistent with SHOOT14di. However, their decline is slow in spite of their rapid rise. Drout et al. (2014) indicate that their decline timescales are days, corresponding to , which is slower than SHOOT14di.
-
•
The lower limit of the temperature of PS1-13arp at its earliest epoch ( K) indicates a blue color of PS1-13arp ( mag), which is consistent with that of SHOOT14di. The color and brightness of PS1-13arp just after the shock breakout are also consistent with that of SHOOT14di, and the absolute rate of brightness change of PS1-13arp at the first NUV detection is consistent with that of SHOOT14di. However, the decline rate of PS1-13arp just after the peak, even in the NUV band, () is slower than that of SHOOT14di in the optical bands.
-
•
The absolute rate of brightness change of SNLS-04D2dc at the first NUV detection is consistent with that of SHOOT14di. Unfortunately, the decline rate of SNLS-04D2dc cannot be well constrained owing to its low signal-to-noise ratios.
-
•
The absolute rate of brightness change and color of rapidly rising transients reported in Tanaka et al. (2016) are similar to those of SHOOT14di. The origin of the rapid rise is suggested to be emission by a cooling envelope or the shock breakout in a dense circumstellar wind, depending on the brightness and the rise rate. Unfortunately, there are no observation of their decline.
-
•
While the color of AT2018cow at its peak is consistent with that of SHOOT14di, AT2018cow is redder than SHOOT14di at the same brightness. The rates of brightness change of AT2018cow are at the peak and at . Both rates are slower than that of SHOOT14di.
-
•
The brightness change of SHOOT14di is as rapid as that of AT2017gfo. However, the peak magnitude and color of SHOOT14di is mag brighter and mag bluer than those of AT2017gfo, respectively.
The discovery of the rapidly-declining
Type I SN 2019bkc/ATLAS19dqr has
recently been reported (Chen et al., 2019). In the observer frame, SN 2019bkc
exhibits slower decline rates, in the -,
-, -, -, and -bands, and a redder color at the peak, than
SHOOT14di. Although the absolute brightness, the rates, and the color in the
rest frame of SN 2019bkc cannot be constrained because it appears to be
hostless, the origin of SN 2019bkc is likely to be different from that
of SHOOT14di.
4.2 Other transients or variables
There are other transients or variables with time scales shorter than SNe and similar transients. In this section, we review their properties and compare them to those of SHOOT14di.
Considering the astrometric accuracy for the positions of artificial sources in the difference images and the position of host galaxy (sections 2.1 and 2.2), SHOOT14di appeared at the outskirt of the host galaxy and thus is unlikely to be an active galactic nucleus or a tidal disruption event. We rule out an asteroid because the displacement between Days 1 and 2 is less than arcsec and no variable, i.e., moving, object is found within arcmin around SHOOT14di on Day 327.
The decline rate of SHOOT14di could be reproduced with the optical flash and afterglow of an on-axis GRB, or the orphan afterglow of an off-axis GRB. However, SHOOT14di is continuously bright over min in the rest frame on Day 1, which is longer than the typical duration of on-axis GRBs, and there were no alerts of GRBs at the location of SHOOT14di on Days 1 and 2. On the other hand, the duration on Day 1 and the decline rate between Days 1 and 2 could be explained by a GRB orphan afterglow peaking at days, depending on the power-law index of light curve decline, where . Here we adopt (e.g., Totani & Panaitescu, 2002; Granot et al., 2002). The early peak of the GRB orphan afterglow and the non-detection of on-axis GRBs require a viewing angle of for the opening angle of , or for . The solid angle required for GRB orphan afterglows by the early peak is similar to that for the on-axis GRBs, and thus their occurrence rates are likely to be comparable. Adopting the cosmic GRB rate (Lien et al., 2014), the expected occurrence number of GRB orphan afterglows with an early peak during the HSC observation on Days 1 and 2 is for GRBs at . The number is much smaller than unity, and thus a serendipitous detection is unlikely. Furthermore, the optical spectrum of the GRB afterglow is proportional to at day (Sari et al., 1998; Granot et al., 2002), and thus the color of the GRB orphan afterglow () is redder than that of SHOOT14di.
Another possible candidate is a chance projection of the flare of a low-mass Galactic star. Since SHOOT14di was detected on Days 1 and 2 and the typical duration of flare is min, two flares with durations of hr and hr are required to explain the decline rate of SHOOT14di. The occurrence rate of flares is in the observed field with the galactic coordinate (, , ) (Kowalski et al., 2009). The Kepler satellite has provided statistical features of the flares of dwarf stars; the number of flares with min is proportional to (Davenport et al., 2014). The expected occurrence number of two flares somewhere in the field during the HSC observing run is . The possibility is further reduced with a condition that these flares take place at the position of the distant galaxy. Therefore, a set of flares unlikely reproduce SHOOT14di.
5 Comparisons with theoretical models
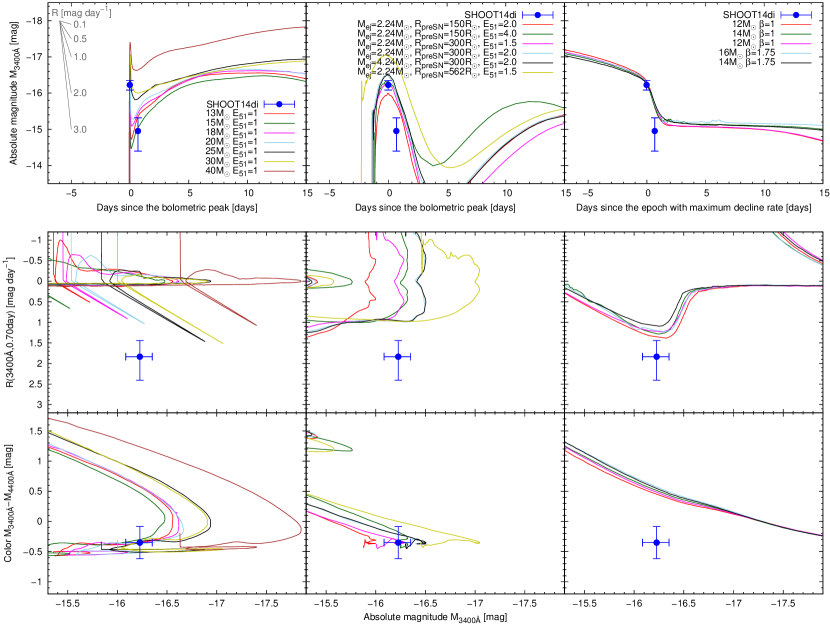
Since there are no known transients or variables that are consistent with the peak luminosity, decline rate, and color of SHOOT14di, we compare these properties of SHOOT14di with published theoretical models suggested for objects with a rapid rise and/or decline; (1) shock breakout at the stellar surface of SN IIP (Tominaga et al., 2011), (2) emission by the cooling envelopes of SN IIb (Tsvetkov et al., 2012), and (3) the explosion of red supergiant star with a dense circumstellar wind (Moriya et al., 2018). All models are calculated with the multigroup radiation hydrodynamics code STELLA (Blinnikov et al., 2006) and the synthetic spectral energy distribution is convolved with the CCD quantum efficiency, transmittance of the dewar window and the Primary Focus Unit, and filter transmission curves of HSC.555http://www.naoj.org/Observing/Instruments/HSC/sensitivity.html

Figure 9 shows comparisons between SHOOT14di and the theoretical models at epochs with absolute magnitudes similar to that of SHOOT14di ( mag) and with similar . The high decline rate with mag is realized in the decline after the shock breakout peak and the cooling envelope peak immediately after the explosion for mechanisms (1) and (2), respectively, while it is achieved in the decline immediately after the forward shock breaks out from a dense wind with a high mass loss rate of for mechanism (3) (top panels of Figure 9).
Middle panels of Figure 9 show as a function of . The rates of brightness change with mag are as high as for mechanisms (1) and (2) and for mechanism (3). These are all slightly slower than that of SHOOT14diṪhe bottom panels of Figure 9 show as a function of . The color and absolute magnitude of SHOOT14di is reproduced with mechanisms (1) and (2), while the color of mechanism (3) is mag redder than SHOOT14di. The large color difference indicates that mechanism (3) is not the origin of SHOOT14di.
The middle panel of Figure 9 demonstrates that the decline rate of mechanism (2) is independent on the explosion energy and the presupernova radius. The rate of brightness change of is consistent with those of SNe IIb observed to date (section 4.1), and slower than that of SHOOT14di, although the decline rate could be higher if relativistic corrections are taken into account (Tolstov et al., 2013). The influence of relativistic corrections requires more detailed radiative transfer modeling from optically thin (transparent) to optically thick (diffusion) regions and should be studied elsewhere.
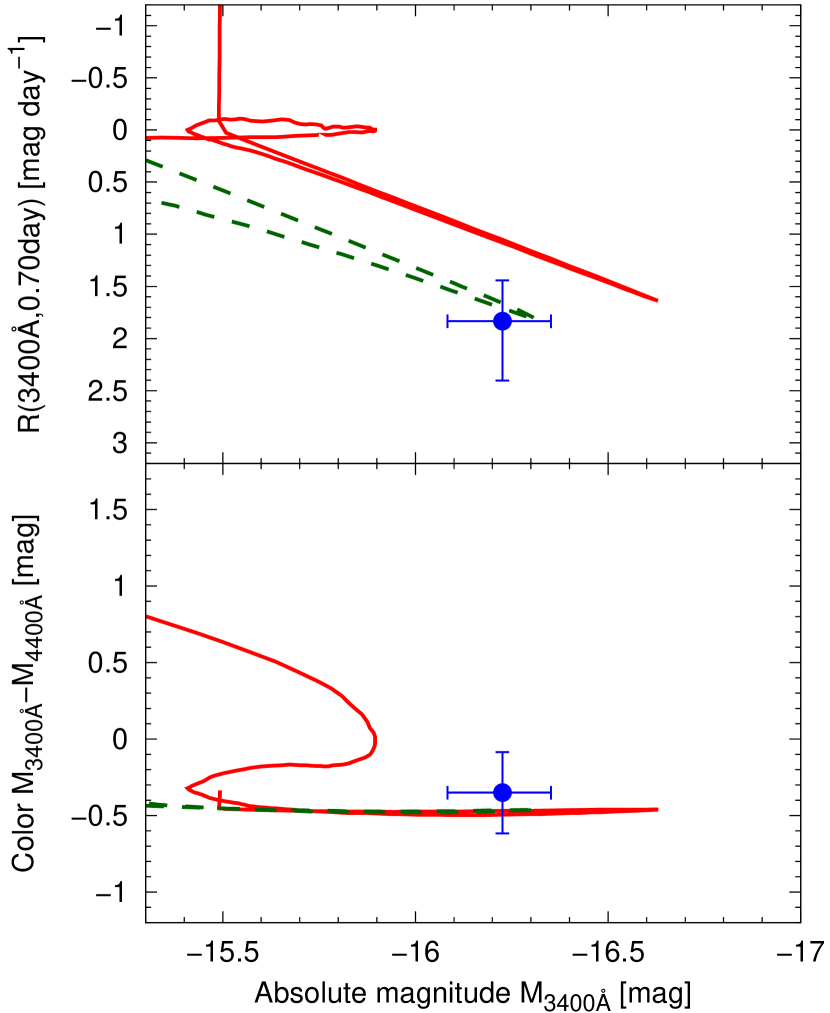
On the other hand, a rate of brightness change as high as appears in explosions of stars with and , corresponding to stellar radii of and , in mechanism (1). The top left panel of Figure 9 demonstrates that the slow decline rate stems from the rapid rising after the decline. As the peak magnitude and the rising after the decline depend on the explosion energy, we additionally calculate properties for models with lower explosion energies. Figure 10 and Figure 11 demonstrate that the peak magnitude, the decline rate, and the color of SHOOT14di are reproduced by mechanism (1) with lower explosion energies of ergs. The low-energy explosions are also consistent with the non-detection of SHOOT14di on Day 35. The absolute plateau brightness of the low-energy explosions is located at the fainter side of the luminosity function of nearby SNe IIP (Richardson et al., 2014). Thus, SHOOT14di is most likely to be a shock breakout at the stellar surface of a low-energy SN IIP explosion.
6 DISCUSSION & CONCLUSIONS
We perform a high-cadence survey with Subaru/HSC and carry out follow-up observations as part of SHOOT. In this paper, we focus on SHOOT14di which rapidly declines in observations over two successive nights.
Spectroscopic follow-up observations of the host galaxy reveal that SHOOT14di takes place at . Based on the photometric observations, we examine the nature of SHOOT14di. SHOOT14di is unlikely to be an active galactic nucleus or a tidal disruption event because it appeared at the outskirt of the host galaxy. The distance of SHOOT14di from the center of the host galaxy ( kpc) is comparable with those of SNLS-04D2dc ( kpc) and PS1-13arp ( kpc). The peak luminosity, decline rate, and color of SHOOT14di are inconsistent with those of SNe at day after the explosions, rapid transients, AT2017gfo, AT2018cow, GRB prompt emission, or a GRB orphan afterglow. Some properties of SHOOT14di are consistent with those of some transients. For example, the decline of AT2017gfo is as fast as that of SHOOT14di and the luminosity and decline rate of SHOOT14di can be reproduced by a GRB orphan afterglow. However, AT2017gfo is fainter and redder than SHOOT14di, and a GRB orphan afterglow is redder than SHOOT14di. Furthermore, their probability of appearing in our survey expected is much smaller than unity (Section 4.2 and Scolnic et al. 2018). A set of flares of a low-mass star, which could reproduce the light curve of SHOOT14di, are unlikely to coincide with a distant galaxy.
Since the observational properties of SHOOT14di are inconsistent with the known transients or variables, we compared the properties against published theoretical models calculated with STELLA; (1) shock breakout at the stellar surface of SN IIP, (2) emission by the cooling envelope of SN IIb, and (3) the explosion of a red supergiant star with a dense circumstellar wind. None of them is fully consistent with SHOOT14di. They have slightly slower rates of brightness change than SHOOT14di at mag. Furthermore, while the color of SHOOT14di is consistent with mechanisms (1) and (2), mechanism (3) gives a color redder by mag than SHOOT14di.
The inconsistency between SHOOT14di and mechanism (1) can be solved with low-energy explosions of a star with . The multicolor light curves and color of SHOOT14di are reproduced by mechanism (1) with the SN IIP explosion of a progenitor star with and ergs. The low-energy explosion model is consistent with the non-detection of SHOOT14di on Day 35. Thus, we suggest that SHOOT14di is the shock breakout at the stellar surface of a low-energy SN IIP explosion.
An event rate of SHOOT14di is roughly estimated by using a method (Schmidt, 1968; Eales, 1993) as done in Tanaka et al. (2016). The event rate is written as , where is a detection efficiency, is the longer of a rest-frame time scale of a transient and a survey duration of each field , is a field of view of HSC, and is a maximum volume per width in which a transient can be detected. Here, we assume because it is difficult to evaluate for our complicated selection criteria. The observed duration of each field in the -band and in each night varies from hr to hr, and thus can be derived from
where is the maximum redshift in which a transient can be detected and is the comoving volume element per unit redshift. Based on the light curve of SHOOT14di, we adopt the following two cases of and absolute magnitude : (1) days and mag and (2) days and mag. Adopting the limiting magnitude of mag in the -band, the resultant are days Gpc3 deg-2 for case (1) and days Gpc3 deg-2 for case (2). Therefore, the event rates are yr-1 Mpc-3 for case (1) and yr-1 Mpc-3 for case (2). These are slightly lower than the core-collapse SN rate of yr-1 Mpc-3 at (Dahlen et al., 2004, 2012; Botticella et al., 2008; Li et al., 2011).
According to Förster et al. (2018), taking into account the bias toward the high detectability of SNe IIP with dense CSM in their observation, one fifth of SNe IIP may exhibit shock breakout at the stellar surface. The rate of SHOOT14di is consistent with the suggestion that SHOOT14di is the shock breakout at the stellar surface of a SNe IIP. This indicates that the rapidly declining transient as SHOOT14di is a proxy for a massive star without dense CSM. The rapidly rising/declining transients are representative of massive stars with various CSM and their rates can constrain the fraction of massive stars with/without dense CSM. While rapidly rising transients have received a lot of attention recently, rapidly declining transients are also important for understanding the fate of massive stars. Although the detection of rapidly declining transients is more difficult than that of rapidly rising transients, it is important to consider a strategy to detect rapidly declining transients.
The absolute magnitude of host galaxy is mag. This is located at the fainter end of the host galaxies of core-collapse supernovae in the local Universe (Arcavi et al., 2010). The stellar mass and specific star formation rate of the host galaxy is located at the smaller and higher ends of host galaxies of core-collapse supernovae in the local Universe, respectively, and the metallicity of the host galaxy is lower than the typical value of host galaxies of SNe IIP (e.g., Graur et al., 2017). SNe IIP in low-mass host galaxies with low metallicity are actually found in the local Universe (e.g., Gutiérrez et al., 2018). While the star formation rate of the host galaxy of SHOOT14di is smaller than those of host galaxies of high- core-collapse supernovae observed so far, its stellar mass and specific star formation rate are located at the lower ends of these distributions (Svensson et al., 2010). These properties of the host galaxy indicate that a core-collapse supernova can occur in it.
If SHOOT14di is the shock breakout at the stellar surface, the main-sequence mass of the best-fit model is larger than constraints obtained for the masses of progenitors of nearby SNe IIP (Smartt, 2009; Dessart et al., 2013; González-Gaitán et al., 2015). However, these observations are limited to the local Universe because of the requirements of presupernova images and late nebular spectra. The main-sequence masses of SNe IIP have never been measured at a redshift as high as . The low-metallicity environment may allow a massive red supergiant star to survive until the SN explosion. Although it needs a careful treatment, due to a possible observational bias that the shock breakout is more easily detected for larger because of larger , high-cadence observations might provide a new clue to investigate the presupernova radius and of SN progenitors outside the local Universe.
The discovery of SHOOT14di and other rapidly rising transients in Tanaka et al. (2016) demonstrates that a high-cadence multicolor optical transient survey with intervals of about one hour is sensitive to high- transients. Unfortunately, the nature of SHOOT14di and other rapidly-rising transients is not well constrained due to the lack of immediate and continuous follow-up observations. Extensive high-cadence multicolor surveys together with immediate and continuous follow-up observations will provide the clue to investigate the high- Universe with short-timescale transients.
References
- Abbott et al. (2017) Abbott, B. P., Abbott, R., Abbott, T. D., et al. 2017, ApJ, 848, L12
- Aihara et al. (2011) Aihara, H., Allende Prieto, C., An, D., et al. 2011, ApJS, 193, 29
- Alard (2000) Alard, C. 2000, A&AS, 144, 363
- Alard & Lupton (1998) Alard, C., & Lupton, R. H. 1998, ApJ, 503, 325
- Andreoni et al. (2017) Andreoni, I., Ackley, K., Cooke, J., et al. 2017, PASA, 34, e069
- Arcavi et al. (2010) Arcavi, I., Gal-Yam, A., Kasliwal, M. M., et al. 2010, ApJ, 721, 777
- Arcavi et al. (2017) Arcavi, I., Hosseinzadeh, G., Howell, D. A., et al. 2017, Nature, 551, 64
- Astropy Collaboration et al. (2018) Astropy Collaboration, Price-Whelan, A. M., Sipőcz, B. M., et al. 2018, AJ, 156, 123
- Axelrod et al. (2010) Axelrod, T., Kantor, J., Lupton, R. H., & Pierfederici, F. 2010, in Society of Photo-Optical Instrumentation Engineers (SPIE) Conference Series, Vol. 7740, Society of Photo-Optical Instrumentation Engineers (SPIE) Conference Series, 15
- Becker (2015) Becker, A. 2015, HOTPANTS: High Order Transform of PSF ANd Template Subtraction, Astrophysics Source Code Library, ascl:1504.004
- Bersten et al. (2018) Bersten, M. C., Folatelli, G., García, F., et al. 2018, Nature, 554, 497
- Bertin & Arnouts (1996) Bertin, E., & Arnouts, S. 1996, A&AS, 117, 393
- Blinnikov et al. (2006) Blinnikov, S. I., Röpke, F. K., Sorokina, E. I., et al. 2006, A&A, 453, 229
- Bosch et al. (2018) Bosch, J., Armstrong, R., Bickerton, S., et al. 2018, PASJ, 70, S5
- Botticella et al. (2008) Botticella, M. T., Riello, M., Cappellaro, E., et al. 2008, A&A, 479, 49
- Brown et al. (2012) Brown, P. J., Dawson, K. S., de Pasquale, M., et al. 2012, ApJ, 753, 22
- Bruzual & Charlot (2003) Bruzual, G., & Charlot, S. 2003, MNRAS, 344, 1000
- Chabrier (2003) Chabrier, G. 2003, PASP, 115, 763
- Chen et al. (2019) Chen, P., Dong, S., Stritzinger, M. D., et al. 2019, arXiv e-prints, arXiv:1905.02205
- Chevalier & Irwin (2011) Chevalier, R. A., & Irwin, C. M. 2011, ApJ, 729, L6
- Coulter et al. (2017) Coulter, D. A., Foley, R. J., Kilpatrick, C. D., et al. 2017, Science, 358, 1556
- Cowperthwaite et al. (2017) Cowperthwaite, P. S., Berger, E., Villar, V. A., et al. 2017, ApJ, 848, L17
- Dahlen et al. (2012) Dahlen, T., Strolger, L.-G., Riess, A. G., et al. 2012, ApJ, 757, 70
- Dahlen et al. (2004) Dahlen, T., Strolger, L., Riess, A. G., et al. 2004, ApJ, 613, 189
- Davenport et al. (2014) Davenport, J. R. A., Hawley, S. L., Hebb, L., et al. 2014, ApJ, 797, 122
- Dessart et al. (2013) Dessart, L., Hillier, D. J., Waldman, R., & Livne, E. 2013, MNRAS, 433, 1745
- Díaz et al. (2017) Díaz, M. C., Macri, L. M., Garcia Lambas, D., et al. 2017, ApJ, 848, L29
- Drake et al. (2009) Drake, A. J., Djorgovski, S. G., Mahabal, A., et al. 2009, ApJ, 696, 870
- Drout et al. (2014) Drout, M. R., Chornock, R., Soderberg, A. M., et al. 2014, ApJ, 794, 23
- Drout et al. (2017) Drout, M. R., Piro, A. L., Shappee, B. J., et al. 2017, Science, 358, 1570
- Eales (1993) Eales, S. 1993, ApJ, 404, 51
- Evans et al. (2017) Evans, P. A., Cenko, S. B., Kennea, J. A., et al. 2017, Science, 358, 1565
- Förster et al. (2016) Förster, F., Maureira, J. C., San Martín, J., et al. 2016, ApJ, 832, 155
- Förster et al. (2018) Förster, F., Moriya, T. J., Maureira, J. C., et al. 2018, Nature Astronomy, doi:10.1038/s41550-018-0563-4
- Furusawa et al. (2010) Furusawa, H., Yasuda, N., Okura, Y., et al. 2010, in Society of Photo-Optical Instrumentation Engineers (SPIE) Conference Series, Vol. 7740, Society of Photo-Optical Instrumentation Engineers (SPIE) Conference Series, 2
- Furusawa et al. (2011) Furusawa, H., Okura, Y., Mineo, S., et al. 2011, PASJ, 63, 585
- Furusawa et al. (2018) Furusawa, H., Koike, M., Takata, T., et al. 2018, PASJ, 70, S3
- Gal-Yam et al. (2014) Gal-Yam, A., Arcavi, I., Ofek, E. O., et al. 2014, Nature, 509, 471
- Garn & Best (2010) Garn, T., & Best, P. N. 2010, MNRAS, 409, 421
- Garnavich et al. (2016) Garnavich, P. M., Tucker, B. E., Rest, A., et al. 2016, ApJ, 820, 23
- Gezari et al. (2008) Gezari, S., Dessart, L., Basa, S., et al. 2008, ApJ, 683, L131
- Gezari et al. (2015) Gezari, S., Jones, D. O., Sanders, N. E., et al. 2015, ApJ, 804, 28
- González-Gaitán et al. (2015) González-Gaitán, S., Tominaga, N., Molina, J., et al. 2015, MNRAS, 451, 2212
- Graham et al. (2019) Graham, M. J., Kulkarni, S. R., Bellm, E. C., et al. 2019, PASP, 131, 078001
- Granot et al. (2002) Granot, J., Panaitescu, A., Kumar, P., & Woosley, S. E. 2002, ApJ, 570, L61
- Graur et al. (2017) Graur, O., Bianco, F. B., Huang, S., et al. 2017, ApJ, 837, 120
- Gutiérrez et al. (2018) Gutiérrez, C. P., Anderson, J. P., Sullivan, M., et al. 2018, MNRAS, 479, 3232
- Ho et al. (2019) Ho, A. Y. Q., Goldstein, D. A., Schulze, S., et al. 2019, arXiv e-prints, arXiv:1904.11009
- Hook et al. (2004) Hook, I. M., Jørgensen, I., Allington-Smith, J. R., et al. 2004, PASP, 116, 425
- Ivezic et al. (2008) Ivezic, Z., Tyson, J. A., Allsman, R., et al. 2008, ArXiv e-prints, arXiv:0805.2366
- Juneau et al. (2014) Juneau, S., Bournaud, F., Charlot, S., et al. 2014, ApJ, 788, 88
- Kashikawa et al. (2002) Kashikawa, N., Aoki, K., Asai, R., et al. 2002, PASJ, 54, 819
- Kasliwal et al. (2017) Kasliwal, M. M., Nakar, E., Singer, L. P., et al. 2017, Science, 358, 1559
- Kennicutt et al. (1994) Kennicutt, Jr., R. C., Tamblyn, P., & Congdon, C. E. 1994, ApJ, 435, 22
- Klein & Chevalier (1978) Klein, R. I., & Chevalier, R. A. 1978, ApJ, 223, L109
- Komatsu et al. (2009) Komatsu, E., Dunkley, J., Nolta, M. R., et al. 2009, ApJS, 180, 330
- Kowalski et al. (2009) Kowalski, A. F., Hawley, S. L., Hilton, E. J., et al. 2009, AJ, 138, 633
- Law et al. (2009) Law, N. M., Kulkarni, S. R., Dekany, R. G., et al. 2009, PASP, 121, 1395
- Li et al. (2011) Li, W., Leaman, J., Chornock, R., et al. 2011, MNRAS, 412, 1441
- Lien et al. (2014) Lien, A., Sakamoto, T., Gehrels, N., et al. 2014, ApJ, 783, 24
- Mink (2002) Mink, D. J. 2002, in Astronomical Society of the Pacific Conference Series, Vol. 281, Astronomical Data Analysis Software and Systems XI, ed. D. A. Bohlender, D. Durand, & T. H. Handley, 169
- Miyazaki et al. (2002) Miyazaki, S., Komiyama, Y., Sekiguchi, M., et al. 2002, PASJ, 54, 833
- Miyazaki et al. (2006) Miyazaki, S., Komiyama, Y., Nakaya, H., et al. 2006, in Presented at the Society of Photo-Optical Instrumentation Engineers (SPIE) Conference, Vol. 6269, Society of Photo-Optical Instrumentation Engineers (SPIE) Conference Series
- Miyazaki et al. (2012) Miyazaki, S., Komiyama, Y., Nakaya, H., et al. 2012, in Society of Photo-Optical Instrumentation Engineers (SPIE) Conference Series, Vol. 8446, Society of Photo-Optical Instrumentation Engineers (SPIE) Conference Series, 0
- Moriya et al. (2018) Moriya, T. J., Förster, F., Yoon, S.-C., Gräfener, G., & Blinnikov, S. I. 2018, MNRAS, 476, 2840
- Morokuma et al. (2014) Morokuma, T., Tominaga, N., Tanaka, M., et al. 2014, PASJ, 66, 114
- Morozova et al. (2016) Morozova, V., Piro, A. L., Renzo, M., & Ott, C. D. 2016, ApJ, 829, 109
- Morozova et al. (2017) Morozova, V., Piro, A. L., & Valenti, S. 2017, ApJ, 838, 28
- Morrissey et al. (2005) Morrissey, P., Schiminovich, D., Barlow, T. A., et al. 2005, ApJ, 619, L7
- Morrissey et al. (2007) Morrissey, P., Conrow, T., Barlow, T. A., et al. 2007, ApJS, 173, 682
- Nagao et al. (2006) Nagao, T., Maiolino, R., & Marconi, A. 2006, A&A, 459, 85
- Nakar & Sari (2010) Nakar, E., & Sari, R. 2010, ApJ, 725, 904
- Nugent et al. (2011) Nugent, P. E., Sullivan, M., Cenko, S. B., et al. 2011, Nature, 480, 344
- Ofek et al. (2010) Ofek, E. O., Rabinak, I., Neill, J. D., et al. 2010, ApJ, 724, 1396
- Pei (1992) Pei, Y. C. 1992, ApJ, 395, 130
- Perley et al. (2019) Perley, D. A., Mazzali, P. A., Yan, L., et al. 2019, MNRAS, 484, 1031
- Pian et al. (2017) Pian, E., D’Avanzo, P., Benetti, S., et al. 2017, Nature, 551, 67
- Pier et al. (2003) Pier, J. R., Munn, J. A., Hindsley, R. B., et al. 2003, AJ, 125, 1559
- Prentice et al. (2018) Prentice, S. J., Maguire, K., Smartt, S. J., et al. 2018, ApJ, 865, L3
- Pritchard et al. (2014) Pritchard, T. A., Roming, P. W. A., Brown, P. J., Bayless, A. J., & Frey, L. H. 2014, ApJ, 787, 157
- Rau et al. (2009) Rau, A., Kulkarni, S. R., Law, N. M., et al. 2009, PASP, 121, 1334
- Richardson et al. (2014) Richardson, D., Jenkins, III, R. L., Wright, J., & Maddox, L. 2014, AJ, 147, 118
- Richmond et al. (1994) Richmond, M. W., Treffers, R. R., Filippenko, A. V., et al. 1994, AJ, 107, 1022
- Richmond et al. (1996) Richmond, M. W., van Dyk, S. D., Ho, W., et al. 1996, AJ, 111, 327
- Rubin & Gal-Yam (2017) Rubin, A., & Gal-Yam, A. 2017, ApJ, 848, 8
- Sari et al. (1998) Sari, R., Piran, T., & Narayan, R. 1998, ApJ, 497, L17
- Schawinski et al. (2008) Schawinski, K., Justham, S., Wolf, C., et al. 2008, Science, 321, 223
- Schlafly & Finkbeiner (2011) Schlafly, E. F., & Finkbeiner, D. P. 2011, ApJ, 737, 103
- Schmidt (1968) Schmidt, M. 1968, ApJ, 151, 393
- Scolnic et al. (2018) Scolnic, D., Kessler, R., Brout, D., et al. 2018, ApJ, 852, L3
- Shappee et al. (2017) Shappee, B. J., Simon, J. D., Drout, M. R., et al. 2017, Science, 358, 1574
- Smartt (2009) Smartt, S. J. 2009, ARA&A, 47, 63
- Smartt et al. (2017) Smartt, S. J., Chen, T.-W., Jerkstrand, A., et al. 2017, Nature, 551, 75
- Svensson et al. (2010) Svensson, K. M., Levan, A. J., Tanvir, N. R., Fruchter, A. S., & Strolger, L.-G. 2010, MNRAS, 405, 57
- Tanaka (2015) Tanaka, M. 2015, ApJ, 801, 20
- Tanaka et al. (2016) Tanaka, M., Tominaga, N., Morokuma, T., et al. 2016, ApJ, 819, 5
- Tody (1986) Tody, D. 1986, in Society of Photo-Optical Instrumentation Engineers (SPIE) Conference Series, Vol. 627, Proc. SPIE, ed. D. L. Crawford, 733
- Tody (1993) Tody, D. 1993, in Astronomical Society of the Pacific Conference Series, Vol. 52, Astronomical Data Analysis Software and Systems II, ed. R. J. Hanisch, R. J. V. Brissenden, & J. Barnes, 173
- Tolstov et al. (2013) Tolstov, A. G., Blinnikov, S. I., & Nadyozhin, D. K. 2013, MNRAS, 429, 3181
- Tominaga et al. (2009) Tominaga, N., Blinnikov, S., Baklanov, P., et al. 2009, ApJ, 705, L10
- Tominaga et al. (2011) Tominaga, N., Morokuma, T., Blinnikov, S. I., et al. 2011, ApJS, 193, 20
- Tominaga et al. (2014a) Tominaga, N., Morokuma, T., Tanaka, M., et al. 2014a, The Astronomer’s Telegram, 6291, 1
- Tominaga et al. (2014b) —. 2014b, The Astronomer’s Telegram, 6763, 1
- Tominaga et al. (2015a) —. 2015a, The Astronomer’s Telegram, 7565, 1
- Tominaga et al. (2015b) —. 2015b, The Astronomer’s Telegram, 7565, 1
- Tominaga et al. (2018a) Tominaga, N., Niino, Y., Totani, T., et al. 2018a, PASJ, 70, 103
- Tominaga et al. (2018b) Tominaga, N., Tanaka, M., Morokuma, T., et al. 2018b, PASJ, 70, 28
- Totani & Panaitescu (2002) Totani, T., & Panaitescu, A. 2002, ApJ, 576, 120
- Tresse et al. (2002) Tresse, L., Maddox, S. J., Le Fèvre, O., & Cuby, J.-G. 2002, MNRAS, 337, 369
- Tsvetkov et al. (2012) Tsvetkov, D. Y., Volkov, I. M., Sorokina, E., et al. 2012, Peremennye Zvezdy, 32, arXiv:1207.2241
- Utsumi et al. (2017) Utsumi, Y., Tanaka, M., Tominaga, N., et al. 2017, PASJ, 69, 101
- Utsumi et al. (2018) Utsumi, Y., Tominaga, N., Tanaka, M., et al. 2018, PASJ, 70, 1
- Valenti et al. (2017) Valenti, S., David, Sand, J., et al. 2017, ApJ, 848, L24
- Villar et al. (2017) Villar, V. A., Guillochon, J., Berger, E., et al. 2017, ApJ, 851, L21
- Waxman et al. (2007) Waxman, E., Mészáros, P., & Campana, S. 2007, ApJ, 667, 351
- Yaron et al. (2017) Yaron, O., Perley, D. A., Gal-Yam, A., et al. 2017, Nature Physics, 13, 510