2016
Stephen M. Blackburn Australian National University steve.blackburn@anu.edu.au
Kathryn S. McKinley Google ksmckinley@google.com
Lexing Xie Australian National University lexing.xie@anu.edu.au
Author Growth Outstrips Publication Growth in Computer Science and Publication Quality Correlates with Collaboration
1 Summary
Although the computer science community successfully harnessed exponential increases in computer performance to drive societal and economic change, the exponential growth in publications is proving harder to accommodate. To gain a deeper understanding of publication growth and inform how the computer science community should handle this growth, we analyzed publication practices from several perspectives: ACM sponsored publications in the ACM Digital Library as a whole; subdisciplines captured by ACM’s Special Interest Groups (SIGs); ten top conferences; institutions; four top U.S. departments; authors; faculty; and PhDs between 1990 and 2012. ACM publishes a large fraction of all computer science research.
We first summarize how we believe our main findings inform (1) expectations on publication growth, (2) how to distinguish research quality from output quantity; and (3) the evaluation of individual researchers. We then further motivate the study of computer science publication practices and describe our methodology and results in detail.
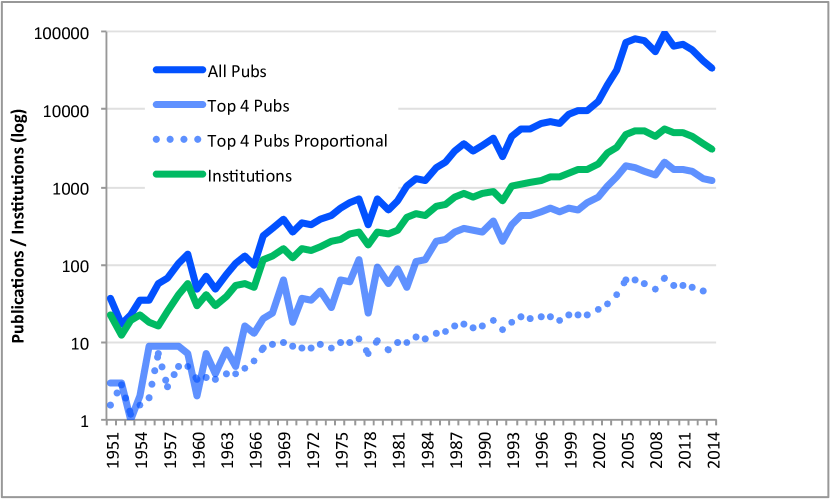
(1) The number of computer science publications and researchers are growing exponentially. Figure 4 shows that computer science publications experienced exponential growth (9.3% per annum), doubling every eight years. Figure 4 shows that the number of computer science authors increased even more than publications. We distinguish established researchers, whose publications span five or more years (), with authors with and , and all authors. Authors grew 10.6% per annum at all experience levels, correlating with post-PhD participation in research publications.
Growth stems from increasing enrollments in research programs and yet there is still unmet demand for computer science graduates and computer science innovations. This growth is critical for continued progress in computing. Publication practices will need to innovate to keep this growth from overwhelming the research publication process while maintaining rigorous peer reviewing standards, giving high quality feedback to authors, and moderating reviewer workloads. For example, communities are experimenting with practices such as tiered reviewing, increasing participation in the reviewing process, and limiting repeated reviewing of rejected submissions to multiple venues. We need these innovations and more to support individual researcher’s careers and scientific progress.
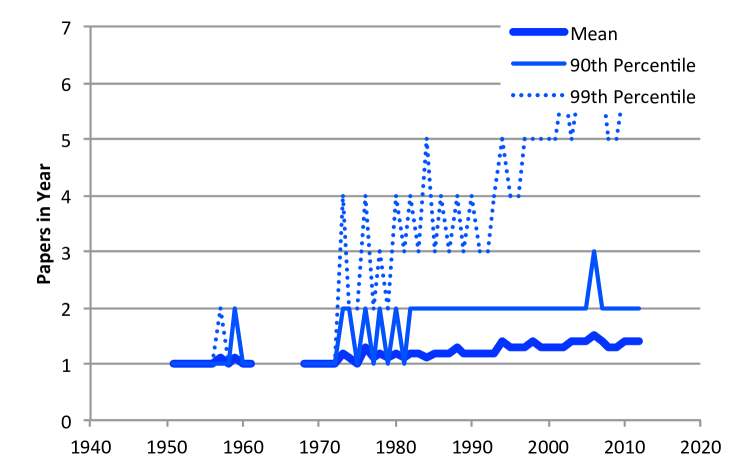
(2) Research quantity and quality are not correlated. As is well recognized, the volume of research output is not and should not be used as a proxy for research quality [9, 15, 18], but nor is high output an indicator of low quality or vice versa. Research output per author has actually declined between 1990 and 2012 as measured by fractional authorship. Figure 8 shows that the weighted publications per author. Each author on a paper accrues a fractional publication as a function of the total number of authors. We plot the 50th (median), 90th, and 99th percentile authors. Figure 8 shows while the raw number of papers for the 99th most prolific authors has grown steadily, the 90th percentile of authors produce one or two papers per year. The most prolific 1% of authors produced just two papers per year when weighted for authorship contribution. Unweighted, this translates to five or more publications, whereas the 90th percentile of authors produce one or two publications per year. Furthermore graduate student growth continues to outpace faculty growth [12]. Because producing successful graduate students requires publishing with them, each faculty member should be publishing more, but they are not. If some perceive that research quality has dropped over time, it is not due to an increase in per-author output.
The top conferences and institutions set research standards explicitly and implicitly, in part because the U.S. computer science professoriate is disproportionately populated by PhDs trained by four U.S. departments, i.e., Berkeley, CMU, MIT, and Stanford [9, 17, 12]. We find that authors in these four departments are equally prolific as compared to all authors, measured both in raw publications and weighted by fractional authorship (Figure 9). We then restrict the comparison to established researchers, where an established researcher at N = 5, means their publications spanned five or more years. Established researchers at these four departments are slightly more prolific than all established researchers — suggesting that high output alone is not an indicator of poor quality research.
(3) Collaboration increases the impact of individual researchers. We find collaboration is highly correlated with quality. In particular, researchers at the top four institutions collaborate more and papers in top conferences have more authors than other venues in the same subdiscipline. Figure 4 shows shows the average number of authors per paper has systematically grown and researchers in the top departments collaborate significantly more than all authors on average (p-value 0.0001). Furthermore, we find that higher rates of collaboration are strongly correlated with quality. We analyze in more detail the ten largest ACM Special Interest Groups (SIGs): SIGCHI, SIGGRAPH, SIGWEB, SIGDA, SIGIR, SIGSOFT, SIGARCH, SIGMOD, SIGPLAN, and SIGMOBILE. We compare the top venue in each subdiscipline (SIG) to collaboration practices for all venues in the SIG. We find more average authors on top venue papers with p-value 0.07 for 8 of 10 SIGs. Only two (SIGIR and SIGARCH) were not significantly higher. Furthermore, we add to the evidence that it is unsound to compare publication practices (e.g., number of publications, citations, and collaborations) of computer scientists in different subdisciplines. For instance in 2012, SIGPLAN published 739 papers with 3.13 average authors per paper, whereas SIGCHI published the most papers at 2562 in 2012 and SIGARCH had the highest average authors at 4.00.
Collaboration complicates the job of hiring and promotion committees, which must evaluate individuals. Since collaboration correlates with quality and collaboration is increasing over time, these committees should expect successful researchers to exhibit a combination of leadership, shared team leadership, and supporting roles in impactful collaborative research. Instead of giving no credit to collaborative research or forcing researchers to divy up credit, committees should consider magnifying the credit to individuals in highly impactful collaborations. Furthermore collaboration is good for training graduate students. They benefit from exposure to more research ideas, research styles, and research area expertise. The whole is sometimes more than the sum of the parts.
We were surprised by several of these findings and it would be interesting to see what has happened since 2012. (We were delayed in disseminating this analysis since several fine venues chose not to publish this paper.) We sincerely thank ACM for providing a complete snapshot of their digital library. We hope these findings spark some new conversations around growth and the value of collaboration.
Our summary analysis is available as supplementary material on arXiv [6].
2 Motivation: Publication Overload
Science makes progress by identifying important problems, developing new approaches, and incrementally improving existing approaches. To handle growth, the computing community has introduced more venues, more papers at the same venues, tiered peer review, year-round conference submissions, and other innovations. However, the community is still under stress. Many researchers have pointed out problems stemming from growth and suggested improvements to the peer reviewing process in a spate of CACM editorials, workshops, and suggestions for best practices [16, 19, 22]. This paper seeks to understand better the source of growth to inform how the community responds to this growth.
Analysis of science as a whole finds that there is exponential growth in authors, publications, venues, and citations over time [23]. These results indicate that as a science matures, it diversifies and specializes, adding more participants and their publications, and science progresses faster. In this paper, we examine computer science trends using computer science author and publication practices from the ACM Digital Library (DL), a large sample of computer science publications, focusing on 1990 to 2012.
For our investigation, we mine ACM DL data on authors, institutions, and venues for papers in ACM proceedings (conferences, symposia, and workshops) [1]. We examine subdiscipline trends based on Special Interest Group (SIG) sponsorship and compare with prior subdiscipline studies [3, 24]. We correlate author trends with faculty and PhD student growth from the Taulbee Surveys of North American PhD-granting institutions [12]. We consider research quantity and quality by examining ten top conferences from the most prolific SIGs and publication practices at Berkeley, CMU, MIT, and Stanford. We choose these institutions because they are well regarded and their PhD students dominate Northern American academic positions in computer science [9, 12, 17].
We address questions such as: How is the field growing? Have authors changed their behaviors? Is there a relationship between the quantity and quality of an individual’s research? Our subdiscipline breakdown by Special Interest Groups (SIGs) is motivated by citation analysis results that indicate citation practices should not be compared across subdisciplines [23]. Our deeper analysis of the citation patterns of ten top conferences exposes further differences in subdiscipline citations practices over time and interactions between fields. We limit our analysis to ten conferences because cleaning the data is time consuming.
2.1 Overview of Findings
This section overviews all our findings on publications, authors, venues, top conferences, top departments, quantity, and quality. Section 3 presents our methodology for using the ACM DL. Section 4.1 presents our analysis of authors and publications in detail. Section 5 examines quantity and quality based on venues, discipline, and departments.
Publications, authors, and venues
We compare growth in publications (Figure 4) and authors (Figures 4, 4, and 4). We distinguish established authors with publications spanning or more years with , and and focus on growth from 1990 to 2012. These results show that the yearly increases in publications of 9.3% per annum are explained by yearly growth in the number of unique authors of 10.6% per annum. Figure 8 shows that authors are actually publishing less when measured in fractional contribution to each paper. Collaboration has increased steadily and thus indvidual authors are publishing slightly more when measured in raw papers (Figure 8). In 2012, the most prolific 1% of authors produced five or more papers per year or 1.8 papers per year weighted by co-authorship, accounting for 3% of all publications.
Exponential growth in the total number of authors and more collaboration explains publication growth.
Individual authors are not publishing more than authors published in the past. Therefore, if the quality of publications is or has changed, the explanation is not simply rooted in author output.
We next examine authors and venues in more detail. Computing research is increasingly a growing international community [10]. The number of institutions producing publications increased at 10.8% per annum from 1990 to 2012, doubling every seven years, with most of this growth from industry and non-U.S. institutions. While the authors from four top U.S. departments continue to produce a disproportionate number of publications compared to their numbers, their overall fraction is dropping. The growth in North American PhD graduates reported in the Taulbee Survey [12] correlates with publication growth. The per annum growth rate of PhDs granted by North American institutions from 2003 to 2014 was 7.0%. A consequent growth in publications is consistent with community standards that require that PhD graduate students publish in order to graduate.
To understand venues and quality, we examined ten conferences that are recognized as extremely high quality. We use sponsoring ACM Special Interest Groups (SIGs) to represent subdisciplines and chose one high quality (top) conference from each of the ten most active SIGs based on the subdisciplines’ judgements. Any quality changes in these venues over the period of our study are orthogonal to our analysis. The median growth in publications was 4.1% per annum and the acceptance rates at these conferences did not change.
While ten of the ACM’s top venues are publishing an increasingly small fraction of all publications, new venues are expanding research topics and scope.
Most growth in the ACM DL was instead due to new subdisciplines and venues. Whereas the number of ACM-sponsored conferences grew by 6.8% per annum, doubling every decade, the number of workshops grew far faster, at 21.3% per annum, doubling every three and a half years. A cursory examination of workshops shows they serve a wide variety of functions. For example, they (a) jump-start topics that evolve into conferences, (b) become part of existing conferences, (c) last a short while, and (d) last for decades. New areas and deeper treatment of some topics are still flourishing and likely to generate future conferences and SIGs. Subdisciplines are experiencing different growth rates. For instance, publications in SIGCHI, SIGSOFT, SIGIR, and SIGCOMM grew by 11% to 13% per annum, substantially faster than average. Some new venues in these SIGs stem from specialization.
More often however, researchers established new SIGs, such as SIGMOBILE, SIGBED, SIGKDD, SIGMM, SIGSAC, SIGWEB, and SIGHPC, and venues that both deepened and broadened research communties. The SIG’s statements of purpose, histories, and conference call for papers reveal these trends. For example, several new SIGs span all aspects of their topics, e.g., the theory, programming systems, runtimes, architectures, and applications of web, mobile, and embedded systems. Many of the newest SIGs expanded the fastest.
Quality
We study the relationship between quality, quantity, and collaboration by comparing the ten top venues to their subdisciplines and four top U.S. computer science research departments (Berkeley, CMU, MIT and Stanford) to the field as a whole. We note that quantifying research publication quality and changes over time across all of computer science is essentially impossible. Even expert reviewers have trouble judging the quality of a given publication. While detecting poor quality research is relatively easily, examining best paper awards retrospectively shows that relative judgements on high quality work have poorer predictive power than author productivity [18].
We find that the top conferences sustained the same paper acceptance rates, while the number of submissions and accepted papers grew at a median rate of 4.1% per annum. The publications in the respective parent SIGs grew faster, at a median rate of 10% per annum, about double the rate of these top tier conferences, reflecting a growing number of venues in each SIG. The number of authors on publications at top venues grew fifty percent faster than publications because authors collaborated more. Compared to the ACM and the sponsoring SIGs, which represent the distinct subdisciplines, the papers at top conferences have more authors.
Publications in eight of ten top conferences have statistically significantly more authors on average than than their subdiscipline and than the ACM as a whole.
One quality judgement the academic community makes is through faculty hiring [9]. Curated Taulbee data [12, 17] shows that PhDs from four top departments disproportionately dominate the professoriate at the top 25 institutions (43 to 59% of all faculty in 2014). Figure 4 shows that four top U.S. computer science departments collaborate more than the rest of the field, averaging 3.9 authors per paper in 2012, compared to 3.4 for the field on the whole. However, their output is the same as the field, with the exception of their established and most prolific 1% authors, which publish slightly more than everyone else. The 90th percentile of researchers at four top departments publish the same modest number of papers (one or two) per year as the rest of the field, although the established 90th percentile at the top four publish slightly more (four or more papers) than other established authors in the field.
Compared to all authors, researchers at four top U.S. departments are similarly prolific, but collaborate more. The most prolific established researchers at the top four departments publish slightly more than other established researchers.
3 Methodology
This section presents our methodology in detail, describing the ACM Digital Library data we use and our analysis process.
We analyze publications and authors in the ACM Digital Library (DL) corpus [1], which incudes every article from conferences, symposium, journals, magazines, workshops, etc. that the ACM published since 1954. We present data from 1954, but focus on recent growth from 1990 to 2012, the last year of complete data when we started this project. The ACM graciously provided us with a download of the entire database of articles in late 2014 which includes metadata such as author names, venue, and date of publication. We restrict our analysis to ACM sponsored proceedings which include conferences, symposia, and workshops. The full list of venues and publications are available from the DL http://librarians.acm.org/digital-library. We classify proceedings by the sponsoring SIG, using DL metadata, and use them to explore subdisciplines. Co-sponsored events accrue to all sponsoring SIGs in the individual SIG analysis, but only once for ACM totals. This corpus represents a large and representative fraction of computing publications, but is not exhaustive. For example, some USENIX conferences, several top security venues, IEEE venues, and many international computer science venues are not included. Many of these publications are in the DL. Because, however, only ACM-sponsored venues are systematically included in the corpus, we limit our analysis to ACM-sponsored venues. These venues do include co-sponsored venues, e.g., co-sponsored with IEEE and others. We limit our top conference analysis to ten because we found classification errors on publication types (see below) that required that we hand-correct and hand-verify the analysis; a time consuming process.
Large data sets such as this one inevitably contain errors. During verification of the ten sampled conferences, we found a number of classification errors, which we fixed in our analysis and reported to the ACM. For instance, many of the conferences including CHI, OOPSLA, and SIGRAPH include posters and/or workshop publications in the main conference proceedings and either do not use the metadata to label them, or incorrectly label them as conference papers. To make things worse, these errors are not systematic across instances of a given conference. Because this type of validation is time consuming, we did not analyze more individual conferences. We urge each SIG to devote resources to checking and correcting their metadata, venues names, and addressing other errors.
We use the ACM’s author identifiers for the analysis, which contain errors due to name aliasing, authors who change their name, and authors who spell their names inconsistently, such as different initials or middle name usage.
To understand author trends over time in more detail, we define an established author as someone (with the same author identifier) who publishes papers spanning calendar years, with = 1 to 10. When = 1, all authors are called ‘established’. When = 2, authors become established in their second year; when = 5, authors are established in the fifth year, i.e., four years after their first publication. We use = 5 by default, but found that our analysis was not very sensitive to the choice of [6]. When restricting analysis to established authors, we remove the impact of authors who only publish once and many students who do not continue to publish after completing their degree. Analysis of established authors focuses on career behavior in academia, industry, and government.
We report publishing institutions per year, which has a systematic over-reporting bias. On occasion author affiliation is missing. More common is that institutions have multiple names, over-reporting the total number of institutions. Author reporting of institution is more inconsistent than names. Institutions vary in the policy that the ACM enforces. We analyzed data for four top U.S. departments, checking for aliases by hand. As one might expect, ACM captures Stanford publications as coming from the corresponding single institution. On the other hand, MIT, CMU, and Berkeley have multiple department and lab institution identifiers in the DL. The DL counts each of these separately. Ambiguity also stems from Universities with multiple campuses. These errors tend to over-report the number of institutions.
To analyze author growth in more detail, we use some Taulbee survey data [12]. Since 1971 this survey has gathered enrollment, production, and employment information of PhDs and faculty in North American (U.S. and Canadian) computer science (CS) and computer engineering (CE) departments, and recently added information systems (IS) departments. Similar data is unfortunately not available from other countries or regions. The Taulbee survey held department rank constant for the top 104 in this period for analysis purposes. We compute tenure-track faculty and PhD production per annum growth rates using data from 2003 and 2014 from 104 reporting and ranked CS and CE departments obtained from Betsy Bizot at the Computing Research Association (CRA) — the data for these years and departments was easily available.
To examine quality, we consider the behavior of authors at four top departments: Berkeley, CMU, MIT, and Stanford. Taulbee ranks these four departments as the top departments. One distributed judgement of quality is faculty hiring, which supports this ranking. Clauset et al. show that the hiring practices over 205 North American computer science departments between May 2011 and March 2012, suggests a ranking of Stanford (1), Berkeley (2), and MIT (3), CMU (7), and Cal Tech (4) [9]. (The size of PhD granting department is not a statistically significant factor in PhD placement [9].) We use the 2003 and 2014 Taulbee data to report current PhD employment as a function of PhD granting institution in the top ranked departments [17] and then compare publication practices at the top four to the wider community. This ranking selects the top four we use in our study.
4 Publication Trends
This section starts with aggregate author and publication trends over time, and then examines departments, institutions, venues, and subdisciplines in more detail.
4.1 Publications and Authors
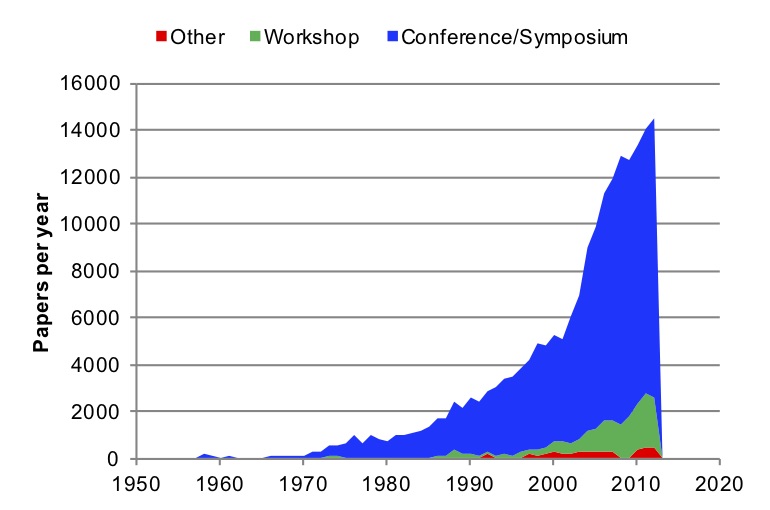
Figure 4 presents the articles newly published in proceedings each year. In the modern computing era between 1990 to 2012, the number of published articles per year grew exponentially from 2,650 to 14,521, a factor of 5.5 (9.3% per annum) — not quite as fast as the doubling of transistors every two or so years delivered by hardware manufacturers. This substantial growth in publications is hardly a surprise.
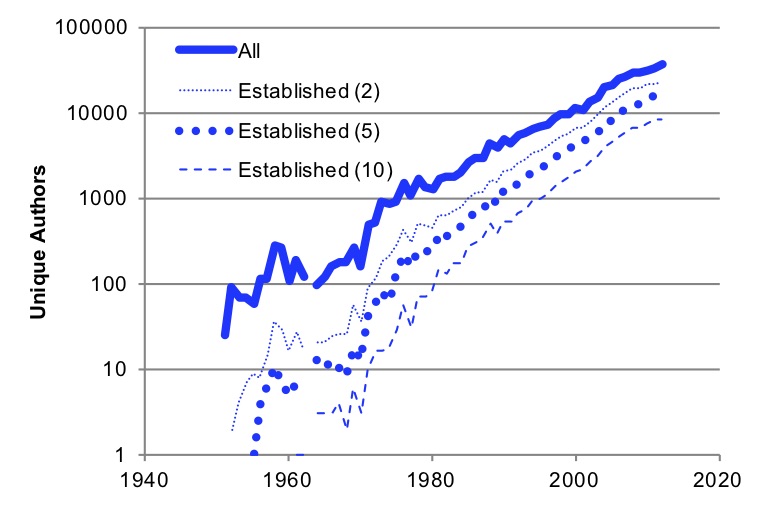
In the same period, the number of unique authors per year grew faster, at 10.6 % per annum from 4,865 authors to 35,725, a factor of 7.3. Figure 4 plots the number of unique authors and established authors by year. In 1990, there were 1253 unique established authors (=5), which grew to 15,232 in 2012, a factor of 12.2. The growth in established authors is interesting when coupled with with the slower rate of U.S. faculty growth (see Section 4.2) and recent findings that document substantial growth in international computer science research [10]. Together they suggest more research participation world-wide coming from industry and government, not just academia.
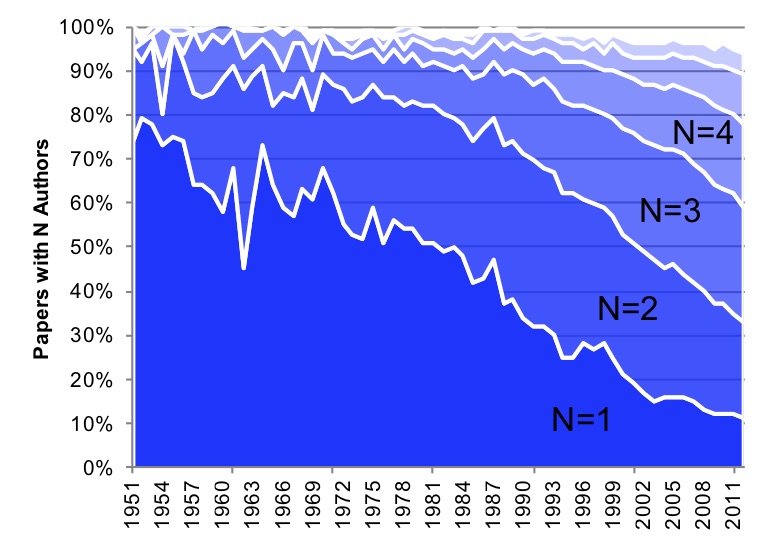
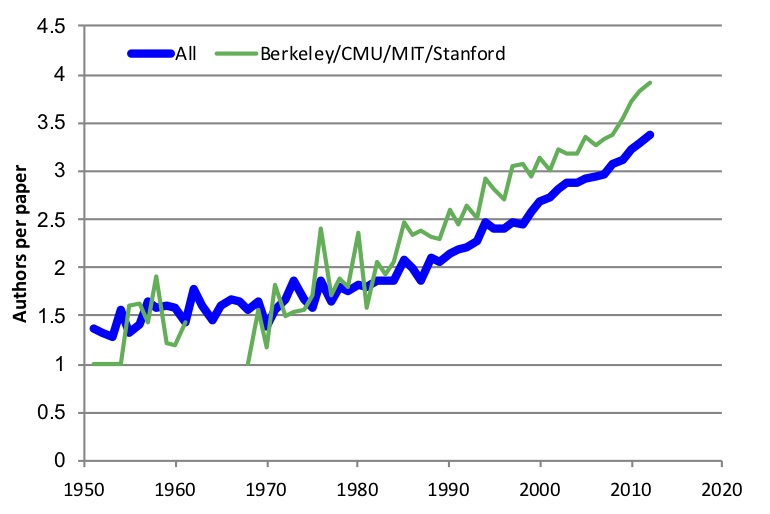
The growth in active authors each year is higher than the growth in publications, but this difference is only in part explained by increases in collaboration. Figure 4 plots the average number of authors per paper, which has risen from 2.1 in 1990 to 3.4 in 2012. Since the mid-eighties, the average number of authors per paper from the top four departments has consistently been higher than for the ACM as a whole. Figure 4 plots a line as a function of year and shades the region for the percentage of publications with one, two, three, four, and five or more authors. The lowest line is one author (). Since the late 1960s, publications increasingly have more authors every year, but as late as 1980, 50% of publications had only one author. In 2012, 23% of publications have four or more authors, whereas in 1990 just 6% did. The proportion of single author papers per year has declined over time from 34% in 1990 to 11% in 2012. Section 5 shows that ten top conferences and researchers from four top U.S. schools have even more authors on average.
Several hypotheses may explain the increase in collaborations. For example, a cultural change may have occurred in which advisors play a larger role in the research process, or their role is acknowledged more, and thus faculty appear on more of their students publications. Increases in collaboration may be due to the type of research. Computer science is increasingly impinging upon and enabling other disciplines. Multidisciplinary research that combines distinct sub-disciplines in computing or other fields, such as computational biology or finance requires more expertise, which is easier to acquire by adding a co-author compared to earning a degree or otherwise gaining sufficient background in another field. Larger more sophisticated and ambitious projects may require more people to build and understand the entire system. For instance, when the DaCapo NSF ITR project built performance evaluation methodologies for managed languages and a Java benchmark suite [5], it required developing new tools; new analysis; new data sets; modifying about 30 active open-source projects; and then evaluating and discarding some candidate benchmarks. The result was a publication with 20 authors. The data shows collaboration is increasingly common.
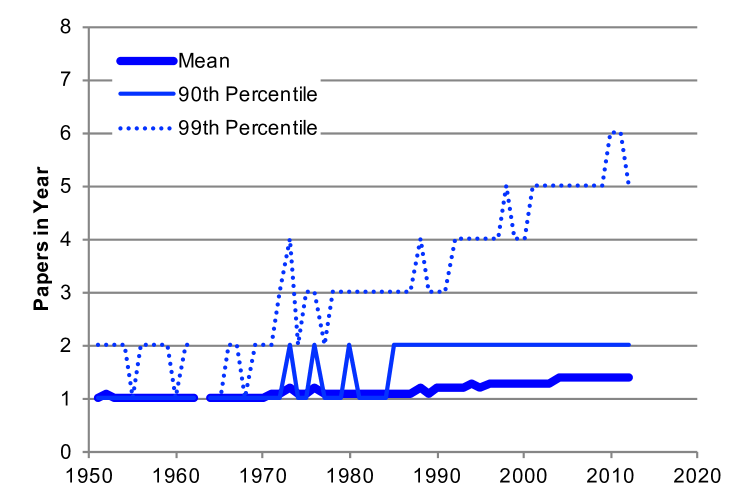
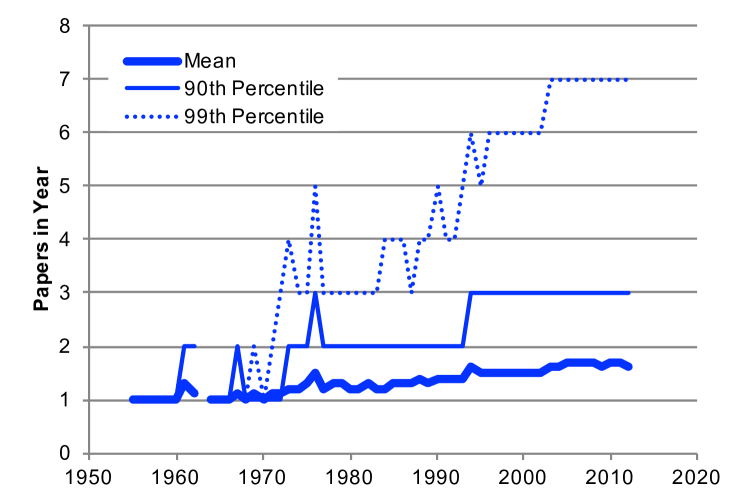
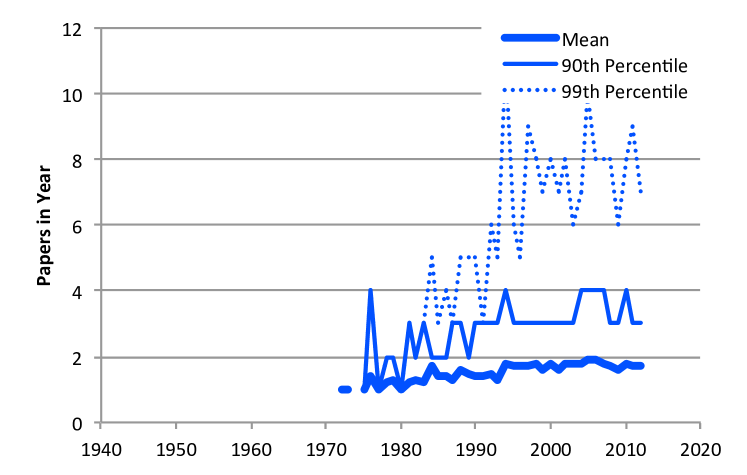
Figures 8 and 8 show the raw mean number of publications per author and per established author per year, as well as the number of publications per author for the 90th and 99th percentiles. Note that these statistics are not computed per individual author year over year. The mean publications per year per author rose from 1.2 in 1990 to 1.4 in 2012, 0.7% per annum.111We report the mean rather than median since publications per author yeild a small integer value with a median value that is invariably 1. The 90th and 99th percentiles report number of papers published by the author at the respective percentile. For the most prolific 1% of authors, raw papers per year has risen from 3 and 4 to 6. Among established authors, the mean publications per year per author grew slowly from 1.4 to 1.7. The 99th percentile most prolific established authors had 5 publications per year in 1990 and now have 7. These publications comprised 1,412 out of 14,521 papers in 2012 (9.7%). Consequently, although eye-catching, these authors have relatively low impact on the field as a whole. Whereas 90% of all authors produce one or two papers each year, 90% of established authors produce one, two, or three papers.
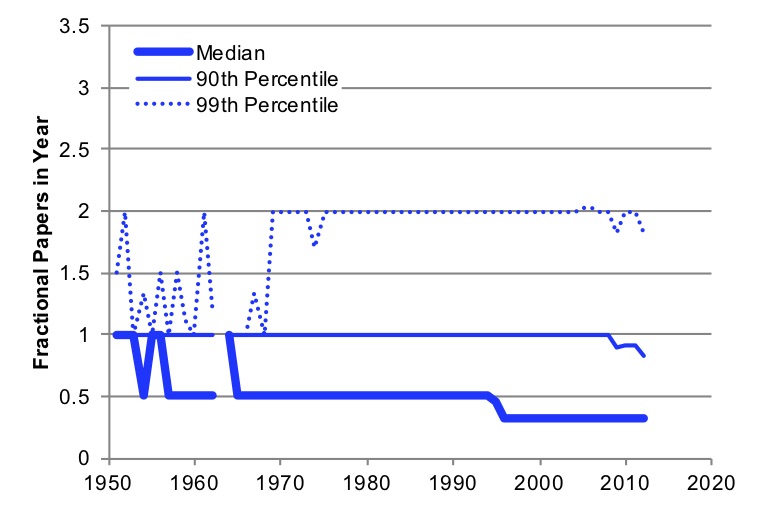
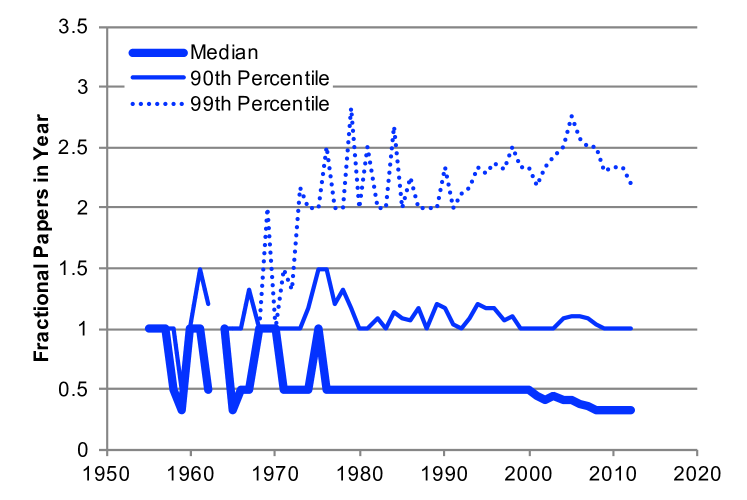
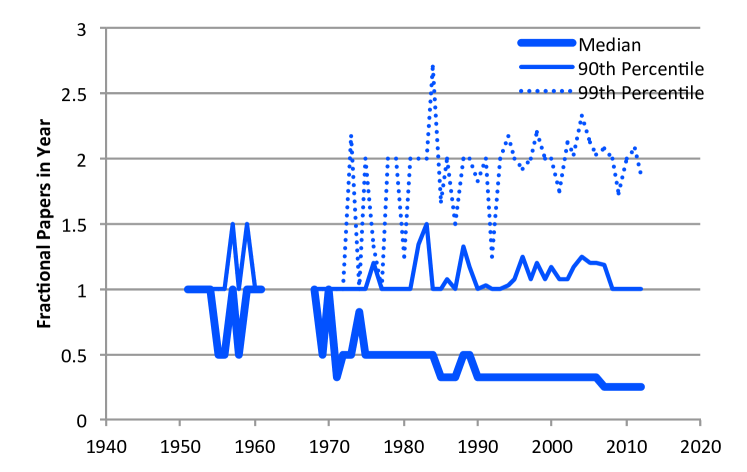
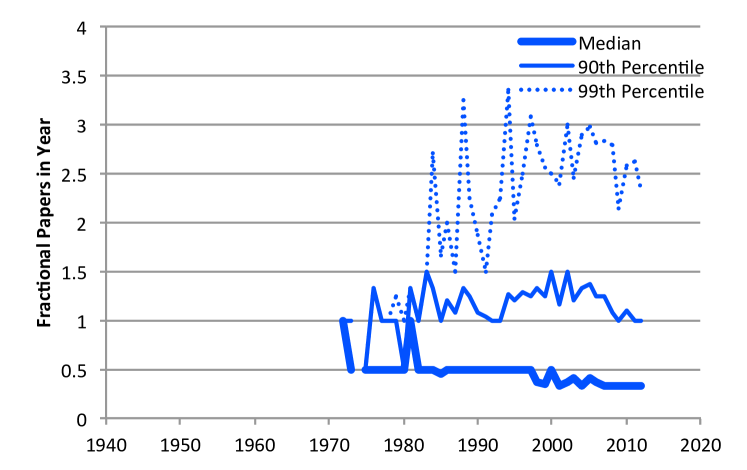
Figures 8 and 8 show the fraction of publications per author and per established author per year, for the median as well as the 90th percentile and 99th percentiles. We compute the fractional publications per author by partitioning the publication equally among the authors and summing for each author each year. Author output has declined since 1990 by this metric. The median author was responsible for 0.5 publications in 1990, and in 2012 is responsible for 0.33 publications.222We report median rather than mean because this indicates the behavior of the ‘typical’ author behaves, whereas the mean is skewed from the median by exceptional few who publish prodigiously. The 90th percentile of all and established authors follows the same trend. The 99th percentile authors dropped from 2 publications to 1.8. The median established author has the same trend, dropping from 0.5 to 0.33 publications per year. The 99th percentile fluctuates more in this period: 2.33 in 2000, to a high of 2.81 in 2005, and a low of 2.25 in 2012. This data taken together with the rising average number of authors per publication shows that author output is relatively constant, even for the most prolific authors, when normalized by author count.
| Rank of | Tenure Track Faculty | PhD Production | ||||
| Institution | 2003 | 2014 | change | 2003 | 2014 | change |
| 4 | 202 | 252 | 25% | 80 | 161 | x 2.0 |
| 10 | 445 | 547 | 23% | 162 | 328 | x 2.0 |
| 15 | 628 | 750 | 20% | 230 | 457 | x 2.0 |
| 25 | 910 | 1039 | 14% | 323 | 612 | x 1.9 |
| reporting 104 | 2714 | 3176 | 17% | 670 | 1404 | x 2.1 |
| per annum 1.4% | per annum 7.0% | |||||
4.2 North American PhD and faculty growth
This section examines the correlation in author growth with PhD and faculty growth. Table 1 presents the growth in North American PhD production per year between 2003 and 2014 and faculty size for 104 ranked departments from the Taulbee data. PhD production increased at 7% per annum, whereas the number of faculty grew by 1.4% per annum. On average, an increase in PhD students per faculty member represents an increase in workload. Comparing with author growth rate (10.6% per annum) and established researcher growth rate, this reveals that much author growth is from authors in student cohort, industry, government, and international institutions, rather than North American faculty [10].
Note that the faculty of top ranked departments grew more than lower ranked departments. Furthermore, overall they produce a disproportionate fraction of North American PhDs — 44% of PhDs graduated from the top 25 ranked schools in 2014, slightly lower than the 48% in 2003. The fraction of PhD students from four top schools has not changed — four schools have disproportionally produced 12% of all U.S. PhDs since at least 2003.
4.3 Institutions
Figure 9 plots the number of unique institutions with one or more publications each year and compares it with growth in papers. We include each institution only once regardless of the number of authors or papers. The ACM directly computed only this data on all publications in the DL, including ones not published by the ACM (without the restrictions described in Section 3). Note that the publications are close to 100,000. We did not use this dataset for the other analysis because many non-ACM venues were not consistently included, as shown by the declines. The number of institutions grew at a rapid pace, 8% per annum from 1990 to 2012. Growth in institutions would likely be lower if the institutional data reporting was more systematic (see Section 3). According to the 2014 Taulbee report [13] (page 2), in 1995 there were 133 U.S. CS departments and in 2014, there were 188, a growth rate of 1.8% per annum. Total CS, CE, and IS departments in the U.S. and Canada grew slightly faster at a rate of 2.7% per annum. Institutional growth thus stems more from increases in international academic participation in computing research, as well as government and industry world-wide, as documented by previous work [10]. Since participant growth outstrips institutional growth, the unique researchers at other institutions must be growing as well.
4.4 Venues
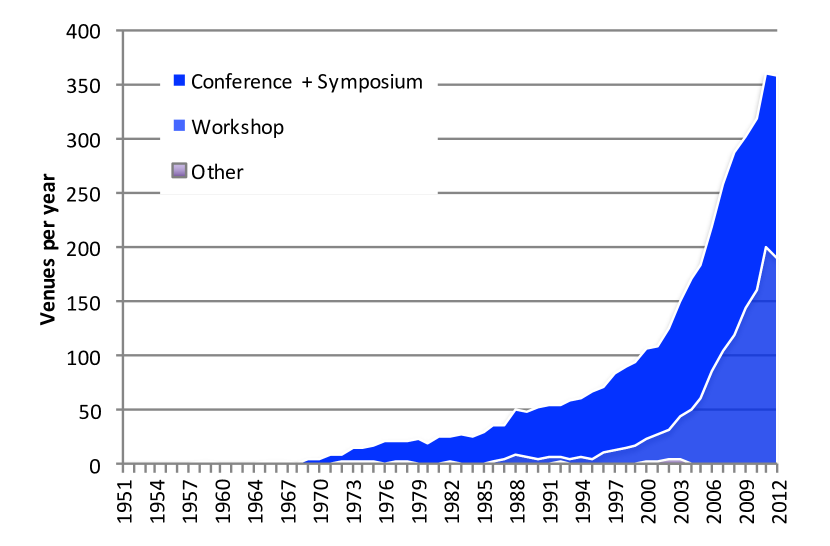
Figure 10 presents the total number of conferences (identified as ‘conference’ and ‘symposium’), workshops, and other proceedings publications published by the ACM. The number of ACM-sponsored conference venues grew at 5.9% per annum from 47 to 167, but has been relatively flat since 2007. On the other hand, the number of workshops grew at 17% per annum, from 6 to 190. If workshop organizers are becoming more likely to include their proceedings in the DL, then the growth rate for workshops would be over-reported. The growth in venues is slightly more than the growth in publications, but well below the growth in authors. Workshops are a predictor of new research directions that subsequently create SIG and conference venues, and thus signal that the field continues to grow.
4.5 Subdiscipline analysis by SIG
This section examines growth by subdisciplines based on the sponsoring ACM Special Interest Group (SIG). Table 2 presents the sponsoring SIG, the number of publications and average number of authors in 2012. Columns four and five present growth rate per annum for publications and authors from the period 1990 to 2012 (except where noted in the last column). We order the table by the number of publications in 2012. If a conference is co-sponsored by multiple SIGs, we credit it to both SIGs in this analysis — 3,102 publications fall into this category. The sum of all the SIG publications (17,623) is thus larger than the last row, which presents all proceedings papers in the ACM DL (14,521) from 1990 to 2012, where each publication is counted only once. The table clearly shows the distinct collaboration patterns among subdisciplines, with systems-oriented SIGS such as SIGCOMM (4.16), SIGARCH, SIGOPS, SIGBE and SIGMOBILE having the highest average authorship, and SIGACT (2.66) having the lowest. This finding is consistent with statistically significant differences found between citation and collaboration networks among disciplines and subdisciplines [7]. In other words, it is unsound to compare scientists in different disciplines and subdisciplines based on collaboration, publication, and citation patterns.
| 2012 | % per annum 1990 - 2012 | ||||
|---|---|---|---|---|---|
| SIG name | Papers | Avg. Authors | Papers | Authors | |
| SIGCHI | 2562 | 3.49 | 15 | 16 | |
| SIGGRAPH | 1149 | 3.07 | 8 | 8 | |
| SIGWEB | 1017 | 3.35 | 17 | 17 | |
| SIGDA | 1002 | 3.73 | 7 | 8 | |
| SIGIR | 1000 | 3.39 | 18 | 18 | |
| SIGSOFT | 917 | 3.22 | 9 | 12 | |
| SIGARCH | 827 | 4.00 | 6 | 8 | |
| SIGMOD | 743 | 3.56 | 11 | 13 | |
| SIGPLAN | 739 | 3.13 | 8 | 9 | |
| SIGMOBILE | 736 | 3.93 | 26 | 27 | 1996-2012 |
| SIGSIM | 692 | 3.04 | 6 | 8 | |
| SIGMM | 569 | 3.54 | 10 | 11 | 1994-2012 |
| SIGAI | 526 | 3.27 | 3 | 5 | |
| SIGAPP | 476 | 3.35 | 5 | 8 | 1992-2012 |
| SIGCOMM | 470 | 4.16 | 13 | 16 | |
| SIGKDD | 431 | 3.51 | 15 | 17 | 1999-2012 |
| SIGBED | 425 | 3.96 | 28 | 29 | 2003-2012 |
| SIGCSE | 395 | 2.82 | 8 | 8 | |
| SIGEVO | 390 | 2.75 | 2 | 2 | 2005-2012 |
| SIGSAC | 377 | 3.38 | 19 | 16 | 1992-2012 |
| SIGACT | 363 | 2.66 | 0 | 1 | |
| SIGOPS | 356 | 3.97 | 7 | 10 | |
| SIGMETRICS | 309 | 3.85 | 10 | 12 | |
| SIGMICRO | 248 | 3.59 | 9 | 11 | |
| SIGSPATIAL | 203 | 3.47 | 19 | 19 | 2005-2012 |
| SIGBio | 122 | 3.88 | -4 | -1 | 1994-2012 |
| SIGHPC | 105 | 5.56 | NA | NA | 2012-2012 |
| SIGACCESS | 78 | 3.31 | 15 | 13 | 2004-2012 |
| SIGSAM | 78 | 2.08 | -1 | 0 | 1990-2011 |
| SIGecom | 73 | 3.04 | 10 | 9 | 1999-2012 |
| SIGITE | 62 | 2.45 | 2 | 5 | 2003-2012 |
| SIGDOC | 57 | 2.42 | 5 | 7 | |
| SIGUCCS | 49 | 1.94 | -2 | 0 | |
| SIGMIS | 36 | 2.53 | -1 | 0 | |
| SIGAda | 22 | 1.91 | -8 | -8 | |
| SIGCAS | 19 | 1.68 | -4 | -5 | 1990-2008 |
| 4 Top Dept. | 1,587 | 3.92 | 8.4 | 7.5 | |
| All of ACM | 14,521 | 3.37 | 9.3 | 10.3 | |
SIGCHI has the most publications and their number has grown at an above-average rate — 15% per annum compared to 9.3% of ACM as a whole. Eight SIGs have very high growth rates: SIGWEB, SIGIR, SIGMOBILE, SIGKDD, SEBED, SIGSA, SIGSPATIAL, and SIGACCESS. While the least prolific SIGs generally have low growth rates, several of the newest SIGs (SIGSPATIAL, SIGACCESS, and SIGecom) are not yet prolific, but they are growing at above average rates (19, 15, and 10% per annum respectively).
Subdiscipline growth in computing has spurred new venues and new special interest groups. The addition of fifteen SIGs and the demise of two in this period, as noted in the table, shows both the dynamism of our field and the growth in subdisciplines. The new venues are not only specializing. Many of the new SIGs seek to both deepen the treatment of a topic and at the same time broaden it. For instance, Victor Bahl and Imrich Chlamtac, researchers who were publishing often in SIGCOMM and IEEE INFOCOM, started SIGMOBILE in 1996 to deepen the treatment of wireless networking as a distinct discipline and to establish a broader community studying mobility of systems, users, data, and computing [2]. SIGMOBILE help establish the community and clearly remains an important research venue. Publications in SIGMOBILE grew at the second most rapid rate of all the SIGs at 26% per annum and participants grew at 27% per annum. Only SIGBED grew faster, at 28% (publications) and 29% (authors) per annum. SIGBED is a similar example of a SIG that was created to cover all aspects of a topic, in this case, embedded computing. Whereas SIGHPC was formed to recognize an existing community, most new SIGs, e.g., MOBISYS and SIGBED, built new communities. These SIGs are breaking down some of the traditional subdiscipline boundaries between theory, compilers, hardware, networking, and applications. New SIGs are defining communities with shared research interests, often beyond traditional subdiscipline boundaries.
| 1990 - 2012 | ||||||||||
| % per annum change % | 2012 | % accept % | ||||||||
| papers | authors | avg authors | double | 2012 | 1990 - 2012 | |||||
| Conference | conf. | SIG | conf. | SIG | conf. | SIG | blind? | rate | change | |
| CHI | 8.2 | 11.0 | 9.9 | 12.4 | 3.7 | 3.5 | 0.007 | yes | 23 | 0.000 |
| SIGGRAPH* | 3.6 | 8.5 | 6.0 | 9.2 | 3.6 | 3.1 | 0.002 | no | 19 | 0.000 |
| WSDM | 27.6 | 18.5 | 25.2 | 19.6 | 3.6 | 3.4 | 0.000 | no | 21 | 0.015 |
| DAC | 2.6 | 7.3 | 4.3 | 8.5 | 3.9 | 3.7 | 0.069 | yes | 23 | -0.008 |
| SIGIR | 6.2 | 13.3 | 8.8 | 14.1 | 3.6 | 3.4 | 0.342 | yes | 20 | -0.004 |
| ICSE | 5.8 | 12.0 | 7.7 | 12.8 | 3.6 | 3.2 | 0.058 | no | 21 | -0.004 |
| ISCA | 1.3 | 5.3 | 2.9 | 7.4 | 4.1 | 4.0 | 0.824 | yes | 18 | 0.001 |
| SIGMOD | 4.5 | 9.7 | 6.6 | 11.6 | 4.2 | 3.6 | 0.049 | yes | 17 | 0.003 |
| PLDI | 2.2 | 7.0 | 5.2 | 8.1 | 3.9 | 3.1 | 0.000 | yes | 19 | -0.001 |
| MOBICOM | 2.7 | 23.7 | 5.7 | 25.0 | 4.7 | 3.9 | 0.008 | yes | 15 | -0.005 |
| Median | 4.1 | 10.4 | 6.3 | 12.9 | 3.8 | 3.5 | -0.001 | |||
| All of ACM | 9.3 | 10.6 | 3.4 | |||||||
4.6 Summary
Most publication growth stems from new conference and workshop venues that deepen and diversify research areas. Individual author output has declined, even for the most prolific authors, when measured in fractional authorship. When measured in raw publications, authors have modestly increased their output over this period, mostly by collaborating more. The very modest increases in raw output for the average author, established authors, and even the most productive authors (all less than 2% per annum) is not the source of the 9.3% per annum growth in total publications. The growth in computer science publications stems from the growth of the field as whole — more researchers working on more topics.
5 Quality
This section examines quality from the perspective of venue and researcher institution. (1) We sample ten top conference venues. These ten conferences differ from the field as a whole: they are growing more slowly and their average paper has more authors than their subdiscipline, as represented by their sponsoring SIG. (2) We examine departmental hiring, PhD production, and the research output of four top ranked departments. These departments hired more faculty and disproportionately produced faculty for other departments. Researchers at these four departments are similarly productive as other researchers, but they collaborate more.
5.1 Venue Quality: Top conferences
This section considers a sample of top ACM conferences and compares their trends with those of their parent SIGs and ACM overall. From each of the ten most prolific SIGs, we chose one of the most prestigious venues based the SIG web page, citation counts, and our personal experience. These conferences are widely considered as very high quality and their high citation rates show that they significantly influence scientific progress. Table 3 presents for each conference: its publication growth rate and that of its parent SIG; its author growth rate and that of its parent SIG; the average number of authors per paper in 2012 for it and its parent SIG; the student T-test -value comparing the average number of authors per paper in the SIG (minus the conference) and the conference in 2012; whether the submissions are double-blind; the acceptance rate in 2012; and finally, the change in paper acceptance rate for the conference over the period.
Publication growth rates at conferences, except for WSDM, are much lower than their parent SIGs and the ACM as a whole, varying from 8.2% per annum for CHI to 1.3% per annum for ISCA, with most between 2% and 6% per annum, with a median of 4.1%, which is substantially lower than the median 10.4% per annum growth rate for their parent SIGs and 9.3% for the ACM as a whole. Growth in total author numbers is also consistently lower in the conferences (except WSDM) than their parent SIG and ACM as a whole. The conference median growth rate is 6.3% per annum, just half that of the parent SIGS. The SIG authorship pool grew at 12.9%. Similar to the ACM as a whole, average authors at the top conferences grew substantially faster than publications.
In all cases, the average number of authors per paper in the top conference is larger than the average number of authors on all papers sponsored by the SIG. We use the Student T-test to determine whether this difference is statistically significant. We compare the average authors on all publications in the sponsoring SIG minus the conference, with the conference. The table presents the -values. For all conferences except for ISCA and SIGIR, the -value , which means that the higher number of authors per paper is strongly correlated with the highest quality venue.
Finally, conferences have essentially not changed their acceptance rates. These results are consistent with the subjective assessment that the top venues in our field are maintaining very high standards whilst seeing a modest growth in publications and a somewhat larger growth in author participation.
6 Visualizing venue citations
We designed a series of visualizations to analyze citation patterns as a function of venue in more depth. Figures 11 and 12 shows two example ‘flowers’ for PLDI. Flowers for a wide range of conferences are available on the ANU’s Computational Media Lab’s webpage [11]. More motivation and descriptions of these visualizations are in a separate paper [20]. Because ACM citation data is limited to ACM DL venues, these visualizations use data from the Microsoft Academic Graph (MAG) [21]. MAG curates a much larger corpus of computer science venues than ACM and it provides an open-access querying and analysis of all their citation data.
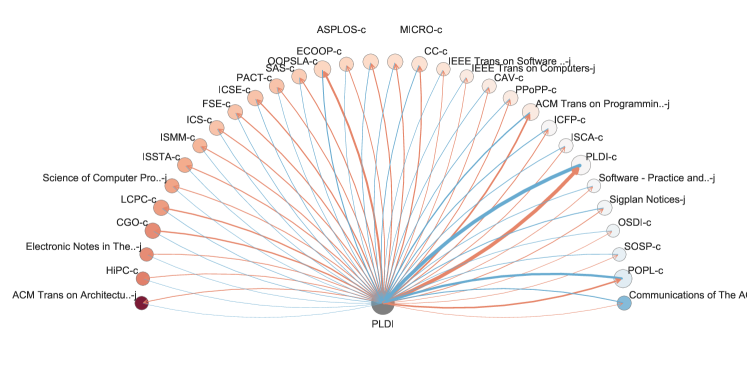
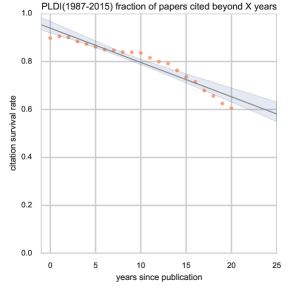
Figure 11 visualizes the amount of incoming and outgoing citations between PLDI and 25 other venues. The plot contains a union of 25 venues that cite PLDI papers the most, or outgoing scientific ideas from PLDI (in red), and top 25 cited by PLDI papers, or incoming scientific ideas (in blue). We place PLDI at bottom center, and place the other venues, including both journals and conferences on a half-circle. Edge width represent the volume of citations in either direction. Nodes are sized by the total volume of citations in either direction, and ordered (from right to left, blue to red) by ascending ratio of outgoing ideas to incoming ideas. In other words, the six blue-ish nodes such as Communications of the ACM are cited more by PLDI than they cite PLDI; and the 25 red-ish nodes cite PLDI more than PLDI cites them.
The incoming/outgoing flow to PLDI itself, by definition, are equal, and of high volume (thick edges). We can see that PLDI, focusing on programming language design and implementation, is influenced by broad-scope computer science journals such as Communications of the ACM and conferences such as Operating System Design and Implementation (OSDI). PLDI in turn influences conference such as ASPLOS (International Conference on Architectural Support for Programming Languages and Operating Systems) and the more specialized ECOOP conference (the European Conference on Object-Oriented Programming).
Figure 12 describes citation survival over time — the fraction of papers (that are at least X years old) that are cited at least once more than X years after being published. We can see that about 90% (at x=0) of PLDI papers are cited at least once, and 60% of papers are still being cited after 20 years. Quantifying the long-term impact of papers and venues has been of interest to the computer science and science communities alike [25]. Citation survival graph is an intuitive visualization tool for this purpose.
Such in-depth analysis of citation statistics for a venue provides a view of scholarly impact that complements the ones based on authors and organizations. These graphs visualize the flow of ideas among communities, quantify the pace of innovation or the last impact of a scientific community, and trace the interaction among different sub-disciplines.
Just as any data sourced from the world-wide web, the data quality on citations is not perfect. While the number of PLDI papers found by the MAG mostly agree with the statistics at the publisher, for some venues there are missing or spurious paper entries. Such data issues can arise from data recording ambiguity at publishers, conference (or journal) venue resolution, publishing of the same or similar papers with varying detail in different venues, and a variety of other sources. While we recommend that the academic community embrace quantitative tools for visualizing and analyzing scientific impact, we caution the reader to take online statistics with a grain of salt, and validate them with well-known community know-how when such knowledge exists.
7 Top Department Behavior
This section further explores the relationship between quality and productivity by examining practices at four top departments. Clauset et al. observe that faculty hiring is an assessment of research and training quality that is widely distributed and fundamentally shapes academic disciplines [9]. Across computer science, business, and history, they find doctoral prestige predicts faculty hiring, reflecting social inequality in academia. For instance, department prestige predicts PhD production, increasing social advantage, and women place worse than men even with a degree from the same program. Clauset et al. identify Stanford (1), Berkeley (2), MIT (3), and CMU (7) as dominant producers of computer science faculty between May 2011 and March 2012. Using Taulbee data for 2003 and 2014 with current PhD granting institutions of the faculty at 104 departments, we select these four departments. We correlate these quality judgements to productivity. We find researchers at four top departments are neither more nor less productive than all authors in the ACM, except for the very most productive established authors at these four institutions.
We find researchers at four top departments are much more collaborative than other researchers with 3.92 average authors per paper in 2012, compared to 3.37 for all of ACM. Using the Student T-test, we compare the average number of authors per paper from all of ACM with papers from top departments in 2012 and obtain a -value . Figure 4 shows the trends over time — researchers at four top have become increasingly more collaborative over time. Deeper bibliometrics analysis shows that collaboration networks are deeply coupled with citation networks and reinforce scientific influence [7].
We illustrate these networks with the Taulbee data, which holds rank constant over time for purposes of longitudinal analysis [12]. Based on faculty hiring, North American computing departments support the Taulbee ranking as shown in Table 4. Each column in the table presents the percentage of faculty that earned their PhD at one of the top 4, 10, 15, and 25 departments and is now on the faculty of the row ranked department.333This Taulbee Survey data was collated by Charles Isbell [17] to demonstrate that if the top-ranked departments produced diverse PhDs, it would have a disproportionate influence on faculty and industry diversity in computing. Hiring reflects this ranking since a disproportionate amount, 43% of tenure-track faculty at the 25 top ranked U.S. departments, earned their PhDs from one of these four departments. Furthermore, 78% of faculty at the top 25 institutions earned their PhDs from a top 25 institution. Combining this data with Table 1, which reports raw number of Faculty and PhD production, we note that these four departments employ 7.9% of all faculty at the reporting 104 departments and produce 11.5% of PhDs. Although this higher PhD production supports overall hiring trends, hiring of top four PhDs into all Northern American faculty positions is much higher than production. Clauset et al. disprove the hypothesis that quantity of PhD production predicts placement [9]. The academic community hiring practices thus judge PhDs from these top four departments as high quality.
Now we correlate U.S. faculty and PhD quality with publication and author growth. In terms of U.S. PhD production, even though total PhD production grew faster at 7% per annum, four top departments continued to disproportionally produce PhDs — 11.5% of PhDs graduate from these departments. Authors in these four departments are growing less than the field as a whole: 9.7% per annum versus 10.3%. Reconsidering Figure 9, they produce disproportionate amounts of research compared to other institutions, but the amount is declining. Figures 16 to 16 show raw papers from these four departments, raw papers from established () top four, weighted papers, and weighted papers from established top four authors. These 252 established researchers produced 1587 publications in 2012, the average top department established researcher has 6.3 papers, putting them in the 99th percentile of all and established authors. Note that the 90th percentile of established top four authors produces four or fewer papers a year, whereas the 90th percentile of all established authors produce three or fewer. At the 99th percentile, authors from top departements produce more than others, but otherwise have similar productivity. As shown in Figure 4, their productivity stems from collaboration — they co-author papers with more authors.
Top departments set quality and production standards in several ways. First, a plurality of all faculty were trained at these four departments. Second, others emulate their behaviors because these researchers are considered among the very best. While most produce at least two papers, the most prolific 10% produce four or more publications per year.
| Rank of | ||||
| Rank of | PhD Granting Institution | |||
| Faculty Institution | 4 | 10 | 15 | 25 |
| 4 | 59 | 67 | 75 | 82 |
| 10 | 49 | 63 | 71 | 79 |
| 15 | 46 | 62 | 72 | 80 |
| 25 | 43 | 59 | 67 | 78 |
8 Related work
We next put these results in the context of two similar subdiscipline studies of publication practices for security and software engineering [3, 24]. Balzarotti analyzes four top system security conferences between 2005 to 2015: Oakland, CCS, USENIX Security, and NDSS [3]. The analysis includes submissions, publications, authors, affiliations, and nationality. The overall findings are consistent with our analysis on publication growth, author growth, established authors, and participating institutions (growth in international authors and collaborations). The per annum author growth rate is 6.5% for these venues, below what we compute for the entire field, but higher than the sample of top conferences in Table 3. The acceptance rates have remained relatively steady around 15%, thus these conferences remain similarly competitive. Another finding of note is that although 600 institutions authored papers in the security publications study, the top 10% of institutions are responsible for 77% of the papers from 2005 to 2015.
For software engineering, Vasilescu et al. [24] study authors, program committees, and publications from 1994 to 2012 for nine ACM and IEEE conferences. Because they hold the venues constant, their study is most similar to our conference data, but with a broader range of venue quality. By following individual authors and program committee members over time, they compare conferences and analyze how the community changes over time. ICSE (the most prestigious venue with the most citations, submissions, and lowest acceptance rate in their set) is increasingly less open — i.e., submissions are less likely to be accepted at ICSE when none of the authors has published in ICSE in one of the previous four years. One interesting note is that ICSE was not double blind in these years, which may be a root cause of this effect. On the other hand, the less prestigious ASE, FASE, and GPCE are more open to new authors — i.e., submissions are neither more or less likely to be accepted if authors published recently in these venues. These ICSE findings complement our results on the increase in collaboration and the higher increase at top venues, such as ICSE. The average paper at ICSE has both more ICSE experience and more authors than other SIGSE venues.
9 Conclusions
Since computer science is a relatively young discipline, many researchers still remember developing or at least reading and understanding, foundational results every year in a broad range of computer science areas. Today researchers struggle to read the significant publications in their area, much less in all of computing. However, computing is continuing to expand and diversify — new SIGs and their venues emerged to explore promising research directions and many encouraged more holistic research. We believe that the community should embrace this growth as an indicator that our field is vibrant.
The field is likely to keep growing. The U.S. Department of Labor Statistics predicts increasing demand for computer scientists [8]. Undergraduate enrollments are booming. Many new education initiatives in primary school (K-12) education are adding computer science and computational education to their curriculums, better preparing and interesting students in computing. These trends presage continued growth in participants, venues, and publications in computing research.
How to best handle high quality publication growth, reviewer overload, and deliver expert comprehensive reviews to submissions remain very important open questions. We believe that there is no reason to abandon proven best scientific practices, such as thorough expert reviewing, just because the field is growing. Our community needs to embrace growth and plan for it, creating more scalable reviewing and publication models. Many communities are now using tiered reviewing with a large group of external reviewers and a smaller set of program committee members to deliver expert reviews and spread reviewer load. The program committee attends in-person PC meetings to make final decisions, where we believe important community values are shared and developed [19, 4]. Another benefit of the computer science conference system is that the program committee changes every year and makes decisions with many witnesses, distributing power and reducing factionalism. Interesting questions for future analysis include (i) tracking submissions, rejections, and final venue quality; (ii) correlations between program committee membership, acceptance rates, and citations; and (iii) differences between ACM journal and conference practices. Our work invites more in depth treatment of these topics, reviewing quality, and conference organization.
Since publication quality is correlated with collaboration, we expect increasingly more researchers and especially pre-tenure faculty will need to produce collaborative research and publications to be successful [14]. Collaboration requires sharing and rotating of research leadership and responsibilities. If PhD students, post doctoral students, or pre-tenure faculty were to abandon supporting research roles with peers or senior faculty, they would miss opportunities to learn from others. Furthermore, departments would miss the rich technical cross-pollination that is sparked by the arrival of new researchers. Hiring and promotion committees should therefore encourage collaboration, rather than giving credit to only one author in a collaboration or worse ignoring highly collaborative impactful research altogether. Another point worth mentioning is that if only the researchers at lower ranked departments were to decrease their output (based on the false claim that quality is correlated with less output) and top departments were to maintain their current effective practices, researchers at lower ranked departments would be further disadvantaged when compared to top department standards.
Acknowledgements
We thank David Hawking, Kuansan Wang, David Walker, Susan Davidson, and Erik Altman for discussions and suggestions on earlier drafts. We thank ACM for all the data, and Bernard Rous at ACM for his help. We thank Betsy Bizot at the Computing Research Association (CRA) for the Taulbee data on faculty and departments. Our summary analysis is available as supplementary material on arXiv [6].
References
- Association for Computing Machinary (retrieved December 2014) [ACM] Association for Computing Machinary (ACM). Digital library, retrieved December 2014. URL http://dl.acm.org.
- Bahl and Chlamtac [retrieved June, 2016] V. Bahl and I. Chlamtac. Sigmobile history, retrieved June, 2016. URL https://www.sigmobile.org/about/history.html/.
- Balzarotti [retrieved October 2015] D. Balzarotti. 10+ years of system security circus, retrieved October 2015. URL http://s3.eurecom.fr/~balzarot/notes/top4/index.html.
- Blackburn [2015] S. M. Blackburn. Welcome from the PLDI Chairs, 2015. URL http://portalparts.acm.org/2740000/2737924/fm/frontmatter.pdf?ip=31.221.80.98&CFID=581468302&CFTOKEN=67350489.
- Blackburn et al. [2006] S. M. Blackburn, R. Garner, C. Hoffman, A. M. Khan, K. S. McKinley, R. Bentzur, A. Diwan, D. Feinberg, D. Frampton, S. Z. Guyer, M. Hirzel, A. Hosking, M. Jump, H. Lee, J. E. B. Moss, A. Phansalkar, D. Stefanović, T. VanDrunen, D. von Dincklage, and B. Wiedermann. The DaCapo benchmarks: Java benchmarking development and analysis. In ACM Object-Oriented Programming Languages, Systems, and Applications (OOPSLA), pages 169–190, Portland, OR, Oct. 2006.
- Blackburn et al. [2019] S. M. Blackburn, K. S. McKinley, and L. Xie. Supplementary materials on arXiv.og for Author Growth Outstrips Publication Growth in Computer Science, and Publication Quality Correlates with Collaboration, 2019.
- Börner et al. [2004] K. Börner, J. T. Maru, and R. L. Goldstone. The simultaneous evolution of author and paper networks. The Proceedings of the National Aacademy of Sciences, 101:5266–5273, 2004.
- Bureau of Labor Statistics (2010) [BLS] Bureau of Labor Statistics (BLS). Employment projections 2010-2020, 2010. URL http://www.bls.gov/emp/.
- Clauset et al. [2015. This supplementary material contains rankings] A. Clauset, S. Arbesman, and D. B. Larremore. Systematic inequality and hierarchy in faculty hiring networks. Science Advances, 1:e1400005:1–6, 2015. This supplementary material contains rankings. URL http://advances.sciencemag.org/content/advances/suppl/2015/02/11/1.1.e1400005.DC1/1400005_SM.pdf.
- Committee on Global Approaches to Advanced Computing [2012] Committee on Global Approaches to Advanced Computing. The New Global Ecosystem in Advanced Computing: Implications for U.S. Competitiveness and National Security. National Academies Press, Washington, D.C., 2012.
- Computational Media Lab [retrieved August, 2019] A. Computational Media Lab. Visualizing citation patterns of computer science conferences, retrieved August, 2019. URL http://cm.cecs.anu.edu.au/post/citation_vis/.
- Computer Research Association (retrieved 2015a) [CRA] Computer Research Association (CRA). Taulbee survey web pages, retrieved 2015a. URL http://cra.org/taulbee.
- Computer Research Association (retrieved 2015b) [CRA] Computer Research Association (CRA). 2014 Taulbee report, retrieved 2015b. URL http://cra.org/wp-content/uploads/2015/06/2014-Taulbee-Survey.pdf.
- Cooke and Hilton, Editors [2015] N. J. Cooke and M. L. Hilton, Editors. Enhancing the Effectiveness of Team Science. National Academies Press, Washington, D.C., 2015.
- Friedman and Schneider [2015] B. Friedman and F. B. Schneider. Incentivizing quality and impact: Evaluating scholarship in hiring, tenure, and promotion, 2015. http://cra.org/resources/best-practice-memos/incentivizing-quality-and-impact-evaluating-scholarship-in-hiring-tenure-and-promotion/.
- Grudin [retrieved 2015] J. Grudin. Publication culture resources, retrieved 2015. URL http://research.microsoft.com/en-us/um/people/jgrudin/CACMviews.pdf.
- Isbell [retrieved 2015] C. Isbell. Elitism in PhD hiring and implications for increasing diversity, retrieved 2015. URL http://research.microsoft.com/en-us/um/redmond/events/fs2015/speaker-slides/july8/Isbell-Charles_elitism.pdf.
- Lee et al. [2003] J. D. Lee, K. J. Vincente, A. Cassano, and A. Shearer. Can scientific impact be judged prospectively? A bibliometric test of Simonton’s model of creative productivity? Scientometrics, 56:1–11, 2003.
- McKinley [retrieved May 2016] K. S. McKinley. More on improving reviewing quality with double-blind reviewing, external review committees, author response, and in person program committee meetings, retrieved May 2016. URL http://www.cs.utexas.edu/users/mckinley/notes/blind-revised-2015.html.
- Shin et al. [2019] M. Shin, A. Soen, B. T. Readshaw, S. M. Blackburn, M. Whitelaw, and L. Xie. Influence flowers of academic entities. In IEEE Conference on Visual Analytics Science and Technology (VAST), 2019.
- Sinha et al. [2015] A. Sinha, Z. Shen, Y. Song, H. Ma, D. Eide, B.-j. P. Hsu, and K. Wang. An overview of Microsoft academic service (MAS) and applications. In Proceedings of the 24th international conference on world wide web, pages 243–246. ACM, 2015.
- Tsafrir and Malkhi [2019] D. Tsafrir and D. Malkhi. Refreshing ATC – USENIX ATC 2019 program co-chairs message. In Usenix Annual Technical Conference (ATC), 2019. URL https://www.usenix.org/sites/default/files/atc19_message.pdf.
- van Rann [2000] A. van Rann. On growth, ageing, and fractal differentiation of science. Scientometrics, 47(2):347–362, 2000.
- Vasilescua et al. [2014] B. Vasilescua, A. Serebrenika, T. Mensc, M. van den Branda, and E. Pekb. How healthy are software engineering conferences? Science of Computer Programming, 89:251–272, 2014.
- Wang et al. [2013] D. Wang, C. Song, and A.-L. Barabási. Quantifying long-term scientific impact. Science, 342(6154):127–132, 2013.