Experimental test of strong pinning and creep in current–voltage characteristicsof type II superconductors
Abstract
Pinning and creep determine the current–voltage characteristic of a type II superconductor and thereby its potential for technological applications. The recent development of strong pinning theory provides us with a tool to assess a superconductor’s electric properties in a quantitative way. Motivated by the observation of typical excess-current characteristics and field-scaling of critical currents, here, we analyze current–voltage characteristics measured on 2H-NbSe2 and -MoGe type II superconductors within the setting provided by strong pinning theory. The experimentally observed shift and rounding of the voltage-onset is consistent with the predictions of strong pinning in the presence of thermal fluctuations. We find the underlying parameters determining pinning and creep and discuss their consistency.
I Introduction
Topological excitations appearing in the ordered phase of many materials have a strong impact on their physical properties. Such excitations interact with material’s defects, what modifies both the structural and dynamical properties of the topological superstructure and of the host material itself. In type-II superconductors, the topological objects appear in the form of vortices due to (current-)induced or applied magnetic fields [1]. While free moving vortices result in a finite resistivity [2], pinning the vortices to material defects [3] helps maintaining the superconductor’s dissipation-free transport of electric current. In the absence of fluctuations, vortex motion only appears upon exceeding the critical current . Thermal fluctuations potentially modify this picture by allowing for a slow, creep-type vortex motion even at subcritical drives that leads to a shift and smoothing of the transition in the critical region. In this paper, we make use of the quantitative results from strong pinning theory [4, 5] in order to unambiguously identify vortex-creep in the critical region of the current–voltage characteristic of two distinct low- materials, 2H-NbSe2, with [6], see Fig. 1, and a-MoGe, with [7], see Fig. 2.
The origins of pinning and creep can be traced back to the seminal papers of Anderson, Kim, and collaborators [3, 8, 9], where Abrikosov vortices pinned onto defects were taken responsible for the properties of current transport in hard superconductors. Besides setting a focus on the Bean critical state [10] and its log-time decay, the shape of the current–voltage characteristic in the critical region was discussed as well, including an interpolation formula describing the transformation of creep-type to flow-type response of vortices that prevail at low and high drives, respectively [8]. Later, much further work has been devoted to studying creep, particularly in the high- superconductors where thermal fluctuations play an important role. On the one hand, relaxation experiments at low drives helped to identify glassy physics characterized by diverging barriers [11], while resistive measurements using sensitive voltmeters served the similar purpose of identifying a non-linear, i.e., glassy response [12]. However, less attention was given to the behavior in the critical region, e.g., the vanishing of barriers near or the smoothing of the characteristic. Not least, this is due to the inadequacy of pinning theories to make quantitative predictions, a deficiency that was overcome only recently, at least for the case of strong pinning [4, 5].
A distinctive feature of strong pinning is its excess-current characteristic, an characteristic that exhibits a linear (flux-flow) response at large drives that is shifted by the critical current [13, 14], in an idealized situation with the flux-flow resistance. Apart from the datasets [6, 7] analyzed in great detail below, such characteristics have been observed in other recent [15] as well as older, even textbook [16] experiments. The analysis and proper understanding of changes in this – characteristic with increasing temperature is the central topic of this work and involves the following goals: i) demonstrate the power and consistency of strong pinning theory in quantitatively explaining experimental data of – characteristics in different materials for different temperatures and magnetic fields . ii) Extract fitting parameters and check for their qualitative consistency with expectations from vortex theory as obtained within the Ginzburg-Landau (GL) phenomenological framework.
In pursuing this program, we have to disentangle two effects of temperature , one being encoded in the parameter that appears in the Ginzburg-Landau (GL) mean-field theory of the superconducting state, the other being the temperature as the driver of thermal fluctuations. While the former lives on the scale , the scale of the latter is given by the fluctuation energy , with the vortex line energy, is the magnetic flux quantum, and , denote the correlation- and screening lengths of the superconductor. A further dependence is due to the presence of the magnetic field (or more precisely, induction) , introducing the distance from the upper critical field-line .
The critical current and the flux-flow resistance , the parameters quantifying the shape of the excess-current characteristic, depend on the temperature and magnetic field via and (or ); approaching the -line in the – phase diagram, decreases, see Fig. 1, and the flux-flow becomes steeper, see Fig. 2, with approaching the normal-state resistance . Although these GL predictions are in rough agreement with experimental data, they do not catch effects of thermal fluctuations that are manifest in the data as well. In particular, within strong pinning theory, the inclusion of fluctuations predicts a further downward shift in the excess current, replacing the critical current by the depinning current , and a rounding of the transition to the ohmic branch of the characteristic [4, 5].
A consistent analysis of creep phenomena then requires to separate these different types of temperature dependence in the experimental data. In our analysis, we achieve this task by rescaling the data to make it collapse onto one curve at asymptotically large drives. The comparison of the temperature-dependent rounding and shift of the collapsed data in the critical region around with the prediction from strong pinning theory then provides clear evidence for vortex creep, see Figs. 3 and 5. In figures 1 and 2, we show the corresponding fits to the original experimental data that demonstrate an impressive agreement. Furthermore, our quantitative theory allows to extract important parameters of vortex physics from the data and check for their internal consistency. Note the difference to the celebrated theory of weak collective pinning [17, 18], where the addition of forces due competing defects poses a formidable task; the latter is straightforward within the strong pinning paradigm where the density of defects is assumed to be small such that pins act individually. As a consequence, results obtained within strong pinning theory can be pushed to provide a numerical accuracy beyond what can be achieved within the framework of weak collective pinning. In particular, strong pinning theory can offer quantitative expressions for critical current densities [19], current–voltage characteristics [13, 14], and thermal creep in the critical regime [4, 5].
In the following, we first introduce and discuss the result for the current–voltage characteristic as obtained from strong pinning theory [4, 5], see Sec. II. In Sec. III, we present the experimental data on the current–voltage characteristics of 2H-NbSe2 and -MoGe and extract the parameters of the characteristic. Sec. IV is devoted to the analysis of creep barriers, where we put forward a new type of analysis that aims at , i.e., the barrier’s dependence on the pinning-force density rather than the usual dependence involving the Lorentz-force density that drives the vortices. In Sec. V, we relate the parameters in the current–voltage characteristic as obtained from the comparison with experimental data to the ‘microscopic’ parameters of strong pinning theory; we summarize our results in Sec. VI and provide some concluding remarks.
II Current–Voltage Characteristic
We discuss the excess-current characteristic in the presence of thermal fluctuations (creep) as derived within the strong pinning paradigm. Within standard vortex physics, the relation between the driving current density and the vortex velocity is obtained from the dissipative equation of motion balancing the effects of the current-induced Lorentz force density driving the vortices, the pinning force density due to the defects, and the viscous force density proportional to the vortex velocity ,
| (1) |
In the absence of thermal creep () and at low velocities, strong pinning theory predicts a nearly constant pinning-force density , the critical force density, over a large regime of velocities [13, 14], in agreement with Coulomb’s law of friction. For small currents, the driving Lorentz force then can be compensated by the pinning force and vortices remain pinned, . A finite vortex velocity only appears at larger drives; as a result, we find the excess-current characteristic with vanishing voltage below the critical current density and a shifted ohmic branch above. This seemingly trivial result owes its validity to the separation of the two velocity scales describing the average motion of the vortex lattice and the velocity of vortices during individual (de-)pinning events (with the pinning force of an individual defect and the separation between vortices); as shown in Refs. [13, 14], the pinning-force density changes with velocity on the scale .
At finite temperature , thermal creep facilitates the escape of vortices from pinning defects; such creep motion is characterized by an energy barrier which relates to the velocity of vortices via
| (2) |
Here, is the thermal velocity scale, related to an attempt frequency for thermal depinning and derived within strong pinning theory in Refs. [4, 5], see also Sec. V. On approaching the thermal velocity scale , vortices traverse the pins sufficiently fast and the barrier slowing down the motion becomes irrelevant. The second central result provided by strong pinning theory is the force-dependence of these very same barriers, which assumes the simple form
| (3) |
This result involves two noteworthy features: first, the relevant force in this simple relation is not the usual driving Lorentz-force density (that would result in a standard relation [18] ) but it is the pinning-force density . Second, the exponent 3/2 is universal for any smooth pinning potential; its origin is found [5] in the thermally induced shift of the (de-)pinning point which relates to the barrier via the scaling . A detailed derivation of is given in Refs. [4, 5], see also Sec. V. The two equations (2) and (3) combine into a velocity and temperature dependence of the pinning force density in the form
| (4) |
Inserting the expression for into the equation of motion Eq. (1) and dividing by , we arrive at a simple formula [4, 5] for the fluctuation-enhanced vortex velocity or current–voltage characteristic,
| (5) |
Here, we have used the definition of the free flux-flow velocity at . The dynamical equation (5) captures the small vortex velocity at subcritical drives , the rounding of the characteristic in the critical region, and the (initial part) of the smooth approach to the ohmic region. As approaches , thermal fluctuations become irrelevant and the characteristic joins the excess-current shape.
The calculation leading to Eq. (5) is based on Kramers’ rate theory [20, 21] assuming an activation barrier . Strong pinning theory tells [4], that the relevant barrier depends on velocity via , see Eq. (2), that restricts the applicability of Eq. (5) to , see Figs. 1 and 2.
We relate the theoretical result (5) to the experimentally accessible current and voltage ( the electric field) using the sample geometry (length and area ) and the definition of the free flux-flow voltage at , ,
| (6) |
This result can be directly compared to the data; it involves the four parameters that are obtained in two steps. At large voltages (or velocities ), creep is irrelevant and the characteristic reduces to the simple exccess-current form , from which and can be directly read off. In a next step, we rescale the data and to bring it to the form of Eq. (5). This rescaling induces a data collapse in the asymptotic region; the deviations appearing in the transition region then are due to creep. It is this deviation from which we can extract the two remaining parameters and through a careful fit to the experimental data in the transition region.
III Experimental Current-Voltage Characteristics
We illustrate the procedure outlined above for fitting the data and extracting the relevant physical parameters for the two low- superconductors 2H-NbSe2 and -MoGe.
III.1 2H-NbSe2
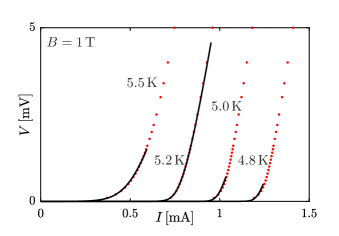
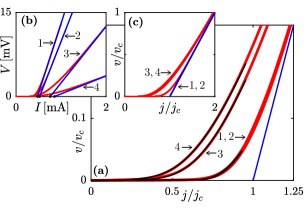
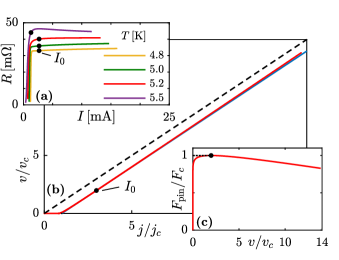
The measurements were performed in a T field directed along the -axis with an in-plane dc current applied through the cross-sectional area , , in a sample of length . The inter-vortex distance is small compared to the sample thickness and hence the standard strong pinning theory for 3D bulk pinning [22] is applicable. Fig. 3 shows the data and fitting to Eq. (5) in the critical region, with the fits restricted to the region where our theory applies.
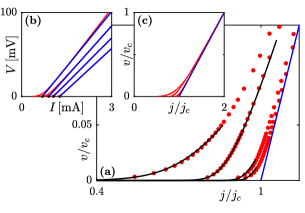
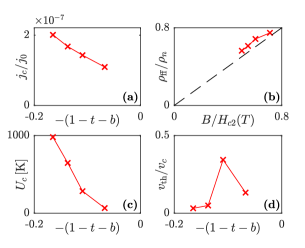
At high velocities , creep is irrelevant and we fit the data to the excess-current characteristic , see blue lines in Fig. 3(b). Analyzing the four curves at , and , we obtain the critical current densities and . These values are far below the () depairing current density , consistent with a small defect density , see Sec. V, and decrease on approaching the -line, , see Fig. 4(a). From the slopes, we obtain the flux-flow resistivities and using the normal state resistivity , we verify the consistency with the Bardeen-Stephen result , see Fig. 4(b). The vortex motion generates the electric field and we obtain the estimates for the free flux-flow velocities .
While the original data include the intrinsic field- and temperature dependences of together with the rounding in the critical region, the rescaled data and in Fig. 3(c) collapse at high velocities to a single line of unit slope; the temperature-dependent rounding and shift of the curves away from the excess-current characteristic in the critical region then can be firmly attributed to thermal creep and serves to find the remaining parameters and .
Let us then focus on the most interesting part of the characteristic, the smooth transition to flux-flow in the critical region around , see Fig. 3(a). In Sec. IV below, we present a protocol for the optimal extraction of these parameters by replotting the current-voltage data in a form that accounts for the creep-type motion in this regime. Inserting the results back into the characteristic (5), we obtain excellent fits to the data; the extracted barrier of order 1000 K rapidly decreases when approaching the -line, , see Fig. 4(c), in agreement with strong pinning theory and further discussion in Sec. V. Finally, the results for the thermal velocity parameter are shown in Fig. 4(d). The discussion in Sec. V predicts an increase of with temperature that is consistent with the experimental findings; the drop near the phase boundary may be due to a collapse of strong pinning . Its numerical value turns out about an order of magnitude larger than expected from strong pinning theory, however, we note that we have least control on this quantity since it assumes the role of an attempt frequency in Kramer’s rate theory, a quantity that is notoriously difficult to calculate.
III.2 a-MoGe
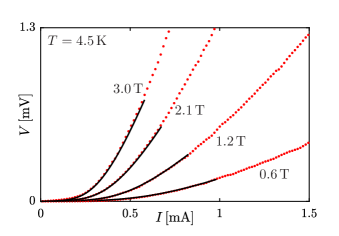
In a similar fashion, we analyse the I-V measurements on a-MoGe films reported in Ref. [7], with data available both at different fields and temperatures. The applied magnetic field in the range (the upper-critical field is ) implies a vortex lattice constant . The current is applied along the direction of the film of length . The thickness iof the film measures and its width is ; while above , the low-field region may crossover to 2D pinning, see further discussion below.
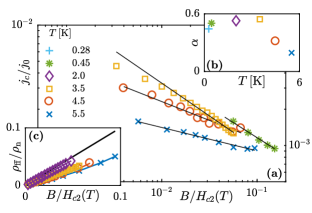
In Fig. 5, we analyze several curves taken at finite temperatures , and . The results of the scaling collapse of this data, providing the parameters and , are shown in Fig. 6. Making use of field-dependent data, we find that the critical current density scales as (Fig. 6(a), with ) with the exponent measured at low temperatures, consistent with theoretical predictions for the strong pinning scenario [19, 14, 23]. The exponent decreases towards at higher temperatures, in agreement with numerical simulations [24] reporting such a behavior with increasing vortex core size. At low fields, a crossover to 2D or 1D strong pinning may occur, see discussion in Sec. V below. The resistivity extracted from the flux-flow regime above remains below the Bardeen-Stephen estimate (see Fig. 6(d), ), that is qualitatively consistent with a more elaborate result of Larkin and Ovchinikov [25]. The flux-flow vortex velocities corresponding to the analyzed data range between and .
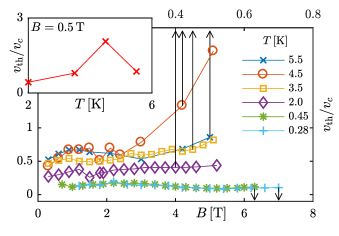
In a second step, we focus on the transition region of the rescaled data of Fig. 5(a). While the curves at higher temperatures are rounded and shifted away from the excess-current characteristic, the data taken at the two lowest temperatures collapse to an almost identical curve after rescaling; note that the reduced temperatures are nearly equal for the two curves, versus for the curves 1 and 2, while the temperature , quantifying thermal fluctuations, increases by a factor . Such a finding implies, that the voltage response of the superconductor does not depend on temperature any more, suggesting that quantum creep [26] may take over at these low temperatures. This hypothesis is further supported by comparing the creep parameter extracted from fitting the data for various temperatures, see Fig. 7(b).
Their variations for temperatures above are consistent with a value , see 7(a). Extrapolating the ratio to the low-temperature region results in values larger then observed, and hence much lower vortex velocities. This suggests that the thermal creep parameter saturates at its quantum analog , see Fig. 7(b); the latter produces a still appreciable (quantum) creep velocity , with .
IV Activation barriers
On a phenomenological level, creep-type vortex motion is a thermal process with vortices escaping from defects by overcoming a drive-dependent activation barrier ; vortex motion then follows an Arrhenius-type formula for the velocity . In comparison, our equation (5) for the current–velocity characteristic describes creep-type motion as well, but follows from a quantitative determination [4, 5] of the pinning force density entering the force-balance equation (1). In the following, we show how these phenomenological and microscopic approaches relate to one another within strong pinning theory.
The interest in the activation barrier is usually focused onto two limits: i) at weak drives , barriers either remain finite or diverge, characterizing a vortex-liquid or a vortex-glass state, respectively [18], and ii) at drives , the barriers are expected to vanish, , with an exponent depending on the pinning model. Strong pinning theory predicts [4, 5] a saturating barrier and a thermally assisted flux-flow response at . In the region near the critical drive relevant in this study, the barriers vanish with an exponent ; this result is universal for any smooth pinning potential. However, strong pinning theory provides us with the further insight that the appropriate variable in the barrier’s scaling law is the pinning-force density rather then the Lorentz-force density , see Eq. (3).
The standard result with the exponent is straightforwardly derived from our microscopic description in the limit where the viscous force in Eq. (1) (or the term in Eq. (5)) can be neglected. In this situation, the characteristic (5) is equivalent to the Arrhenius law with a barrier exponent : indeed, within this approximation, the driving force is balanced by the pinning force and our – characteristic (5) can be cast into an Arrhenius-law with a barrier .
Upon increasing the drive , however, the vortex velocity becomes significant and the viscous term can no longer be neglected. Combining Eq. (3) and the equation of motion (1), we replace to obtain a barrier that depends on both drive and velocity in the form
| (7) | ||||
| (8) |
Using this expression for the barrier, the characteristic given by Eq. (5) can be written as a self-consistent Arrhenius law for the vortex velocity ,
| (9) |
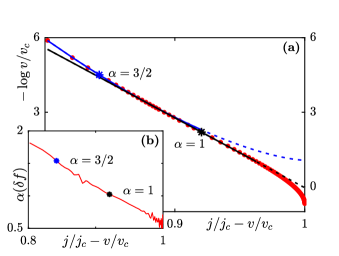
Alternatively, using the data of the scaled – characteristic, the expression (8) provides us with a direct access to the activation barrier . Indeed, plotting versus , we represent versus with the offset . Fig. 8 shows a typical outcome of arranging the data in this new manner. We then can follow two strategies, i) either assume the validity of (8) and use this fitting ansatz to extract the creep parameters and , or ii) interpret the data as directly providing the functional form of , up to a constant.
The parameters and shown in Figs. 4 (c) and (d) and in Fig. 7(a) have been obtained by following the procedure i). In extracting the parameter , we have to select the appropriate portion of the curve: starting at (corresponding to ) in Fig. 8, the barrier initially grows with a concave shape, goes through an inflection point, and then continues in a convex curve at smaller values . The initial concave form for close to originates from the saturation of when the velocity increases beyond the thermal velocity . The creep-dominated region at small velocities corresponds to the convex region in Fig. 8 and it is this region that provides us with the value for the reduced barrier . The ratio derives from the condition , i.e., the offset in at , once the curve has been fitted and extrapolated to .
In a systematic fit, we search for the region that is best described by Eq. (8). We define the rescaled pinning force and take the derivative in order to eliminate the constant shift ; taking the log-derivative, we obtain as shown in the inset Fig. 8(b)). The fit to Eq. (5) then is done around the point for which .
In following the alternative procedure ii) instead, we directly obtain the shape of (up to a constant shift) but miss its analytic form. Furthermore, we have to be careful in interpreting the data as a barrier, as the latter requires the quantity to be large. In an attempt to extract some effective functional form, we can make some more progress by using our findings for the exponent , which, as shown in Fig. 8(b), is not at all a simple constant. For instance, it is possible to find a region at higher currents in Fig. 8(a) where the barrier shape is better characterized by an exponent . Such a linear dependence of the activation barrier reminds about the original assertion by Anderson [3] for the creep barrier as emerging from the competition between the defect’s pinning energy and the Lorentz force energy of flux bundles with volume ; the corresponding creep barrier then can be written in the simple form . In Fig. 8(a), we compare separate fits to the data with (blue line) and (black line). At first sight, the fit for looks rather good, in particular at higher drives. Indeed, the changeover from a convex to a concave form at large pinning forces produces an inflection point with a region where the exponent quite naturally provides a better match to the data. However, this region close to is flow- rather than creep-dominated, with a barrier of order or even smaller than . It then is the region at smaller drives and velocities where creep effects are expected to manifest in a clean and unperturbed manner. At these smaller drives, it is the exponent that provides a consistent description of the experimental data. Going to even smaller drives, our expansion is expected to break down [5] and the shape of depends on the detailed form of the pinning potential.
Finally, we comment on some subtleties in using the high velocity data for the extraction of (via ) and . The strong pinning theory provides a detailed picture of vortex motion on several velocity scales: thermal creep [4, 5] as discussed above affects the vortex response only at velocities below . Beyond , creep effects eventually become irrelevant and the finite temperature creep- and excess-current characteristics merge. This merging in a shifted linear flux-flow characteristic manifests in the data as a saturation of the differential resistance, see Fig. 9(a).
In performing accurate fits, it is important to have experimental data that goes beyond the merger at and reaches some saturation in the differential resistance, as this part of the data allows for inferring the correct critical current density and flux-flow resistivity through linear extrapolation. In an ideal situation, the linear excess-current characteristic above allows for a straightforward extrapolation. In reality, the characteristic is never perfectly linear and the extrapolation has to be done around some chosen point of the characteristic. In order to find the correct point around which to construct the linear extrapolation, we combine the creep dynamics discussed here with the results of the flow-dynamics described in Refs. [13, 14].
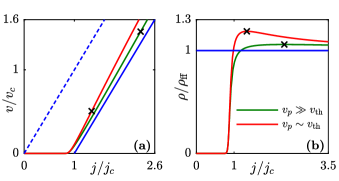
The generic strong pinning situation is characterized by a separation of scales , where is the velocity scale for dissipative vortex motion within the defect potential excerting typical forces . The excess current–voltage curve then is expected to turn back towards free flux-flow (see dashed blue line in Fig. 10(a)) only at velocities larger than . Provided that , one thus expects the differential resistance to rise sharply towards on the scale , then going through a broad maximum within the extended velocity region , and returning from above to the free flux-flow branch and hence to at very large currents , see the sketch (green line) in Fig. 10(b). This behavior is well in line with the behavior of the characteristics in Fig. 9 at the three lower temperatures. For the data measured at (magenta line in Fig. 9(a)) the maximum is sharper and appears at lower drives. This is consistent with the scenario shown in Fig. 10(b), red line, where is of the order of . In this case, the differential resistance overshoots and goes through a more narrow maximum close to .
In choosing the point where the extrapolation to the excess-current characteristic (blue line in Fig. 9(b)) should be done, we should stay below the maximum in (i.e., below the inflection point of the current–voltage characteristic), ideally at the crossing of the differential resistance with the flux-flow resistance . In particular, this educated choice guarantees that the extrapolation never crosses the – characteristic but rather touches the latter in a tangent at . Unfortunately, the flux-flow resistance may not be accurately known, which leaves some arbitraryness in the choice of . For the lowest three temperatures in Fig. 9(a), we have chosen a value near the onset of the flat maximum in and remark that the extracted parameters do not differ significantly for somewhat different choices of . For the highest temperature , we have chosen a value before the maximum (which is expected at values ); again, the precise choice of does not change the extracted pinning parameters in a significant manner. Note that the experimental access to such a high-velocity regime is quite problematic in general due to heating effects that may even destroy the sample; this type of analysis then is restricted to materials with a small ratio .
The above discussion also sheds some more light on the concave region of the barrier plot in Fig. 8 close to . Translating the behavior of the current–voltage and resistance curves in Fig. 10 to the pinning-force density , one notes that the latter exhibits a broad maximum or plateau for the case , while a more narrow maximum around is expected when . Indeed, the maximum in corresponds to the point in Fig. 10(b) and the derivative , small (large) for the case (), determines the curvature of . In Fig. 9(c), we show the pinning-force density (with a broad maximum) extracted from the data at . We then can expand around its maximum and approximate . Inverting and expanding for small provides us with the scaling . The appearance of the concave region in with an exponent is thus the direct consequence of the maximum in at .
V Parameters from strong pinning theory
The interaction of vortex lines with sufficiently strong defects gives rise to bistable solutions for the vortex lattice displacement; the appearance of such bistabilities is the hallmark of the strong pinning regime. The weak- to strong pinning crossover is characterized by the Labusch parameter [27, 22] , comparing the maximum (negative) curvature of the defect pinning potential near its edge with the effective vortex lattice stiffness ; pinning is strong provided that . A second condition on the applicability of strong pinning theory is the independent action of individual pins, requiring that the density of pins is small, . Therefore, strong pinning does not necessarily imply a large critical current density . As the density is increased above (or the field decreased below) this condition, 3D strong pinning goes over into 1D strong pinning of individual vortices [28]. Below, we cite the main results of the 3D strong pinning regime as relevant in the present discussion and show how pertinent strong-pinning parameters such as , , , can be extracted from the comparison of theoretical predictions with experimental data, at least in principle.
Vortices (with a core of size ) remain pinned on a defect over an area , with and the longitudinal (along the vortex motion) and transverse trapping lengths. Assuming each defect to exert a pinning force ( is the pinning potential depth) on the vortex, we find the maximal (or critical) pinning-force density . When approaching the boundary of strong pinning at , the pinning-force density is reduced by a factor and we can make use of the interpolation formula
| (10) |
The numerical can be calculated once the specific shape of the pinning potential is known [4]; for the Lorentzian pinning potential , we find that .
The intrinsic field- and temperature dependence of the critical current follows from the corresponding dependencies of , , and . In the vicinity of the upper-critical field with , the coherence- and London penetration lengths scale as and , respectively, with and . Various pinning models involving metallic and insulating defects or -pinning, have been discussed in Ref. [29]; the pinning potential depth and the pinning strength then depend in various ways on and . It turns out that the dominant contribution to the scaling near the -line appears through the pinning energy and the Labusch parameter with model-dependent exponents and .
Scaling the critical current density with the (zero-temperature) depairing current density (with the thermodynamic critical field), we find that this ratio only involves the effective defect number in the trapping volume and the ratio with the (zero-temperature) condensation energy,
| (11) |
With , we find the typical strong-pinning scaling [19, 14, 23] . Upon decreasing the field below the 3D strong pinning condition , pinning turns one-dimensional (1D) and is expected to saturate to a -independent value. Taking into account a weak -dependence of the transverse trapping [14] changes the field-scaling of the critical current density to with for a Lorentzian-shaped pinning potential. This result has been verified and augmented by numerical simulations [24] showing that the exponent in fact decreases for increasing defect densities or vortex core size.
The result (11) tells, that should decrease on approaching the -line, in agreement with the finding in Fig. 4(a). The scaling with exponents is observed in the data of Fig. 6 (a) and (b).
Next, we discuss the scale of the activation barrier. This turns out proportional to the pinning energy , vanishes on approaching weak pinning , and only weakly depends on for very strong pinning [4]; it is accurately described by the interpolation formula
| (12) |
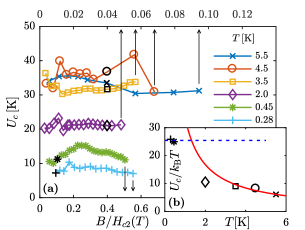
with the numerical for Lorentzian pinning potential. While the values of in Fig. 4(c) decrease rapidly on approaching the -line, the data in Fig. 7 is more consistent with a constant value. Indeed, substantial variations of the barrier with field and temperature are to be observed only sufficiently close to the -line; this is the case for 2H-NbSe2 where . On the other hand, the data on a-MoGe has been obtained further away from the -line, with values of all larger than 0.2.
Comparing Eq. (11) for with the expression (12) for the activation barrier allows us to extract the effective defect number from the experimental data,
| (13) |
Given the values of and , we can use Eq. (13) to find an estimate for the defect parameter ; the data on 2H-NbSe2 provides us with the values at the four different temperatures, all consistent with the assumption of 3D strong pinning. With [30] and assuming a value of order unity for provides the estimate .
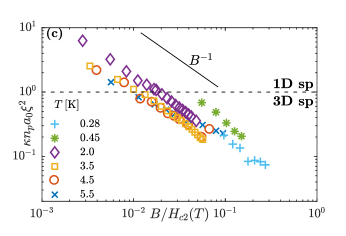
The density parameter extracted from critical currents and activation barriers as derived from the fits on the -MoGe films, see Figs. 6 and 7, is shown as a function of field in Fig. 11. At large fields T, the separation between vortices is smaller than the film thickness , the density parameter is small, and we expect 3D strong pinning. On decreasing the field, two things happen: i) as the distance between vortices (that equals the extent of the distortion along pinned vortices) drops below , vortices are cut and we enter the 2D strong pinning regime that is still well described by our strong pinning theory but with a modified effective elasticity involving only shear. As a result, the Labusch parameter scales as and the critical current density . ii) With increasing density parameter , vortices become individually pinned, either as 1D lines (at high fields with ) or as 0D Pearl vortices (at low fields with ). In this case, the critical current density is expected to flatten and become independent of field . The critical current density in Fig. 6 seems to flatten at the lowest fields (see data at and ) that may indicate a crossover to a field independent 1D or 0D regime. Furthermore, the field scaling with an observed between 0 and unity covers the range of expected behavior, however, without clear attribution to a specific regime. An accurate association with a specific pinning region then seems difficult in the low-field/high-density region, given the competition between the dimensional crossover and the density crossover. Finally, we can use the data to extract an estimate for the defect density: with and of order unity, the defect density itself assumes a value of order .
Last, we turn our interest to the thermal velocity parameter . The theoretical prediction [4]
| (14) |
is based on a simple particle-like ansatz in Kramer’s rate expression [20, 21, 5]; its proper evaluation, both theoretically and from experiment is notoriously difficult as it appears as the prefactor in the thermal activation rate which is dominated by the exponential factor with its activation barrier. Approximating with a typical value , and using Eq. (12), we arrive at the simpler result
| (15) |
where we have suitably factorized the result for later convenience, see below. This result predicts an increase of with temperature (due to the factor ) that is consistent with the findings obtained from fitting the characteristic, see Figs. 4(d) and 12, apart from the datapoint at the highest temperature. This might be explained by a collapse of the factor near the -line that occurs in several of the pinning models discussed in Ref. [29].
Alternatively, the first factor of Eq. (15) can be evaluated using the experimental findings for and values for from Eq. (13) (derived from experimental results for both and ); such an analysis provides a result of order unity for the first factor, about an order of magnitude larger than the values extracted from the characteristic shown in Fig. 4(d). Consistency then would require to be close to unity, i.e., individual pins are marginally strong. Repeating this analysis for -MoGe and using known experimental results for and , we find a small value of order for the first factor in Eq. (15). One then concludes that the Labusch parameter should be large in -MoGe in order to reach consistency with the results in Fig. 12. However, a word of caution is in place here, as both our theoretical knowledge on the preexponential factor as well as our precision to extract a reliable value from Fig. 8 are quite limited at this stage.
VI Summary and conclusion
By applying the quantitative theory of strong pinning to current–voltage measurements, we provided a first quantitative data-driven analysis of vortex creep in the critical region and thus demonstrated the potential of the strong-pinning paradigm for explaining pinning and creep in superconductors. The strong pinning paradigm comes with a number of microscopic assumptions: defects have to be strong, i.e, they must generate bistable pinning states, and their density has to be small such that they act independently.
In return, we obtain specific phenomenological predictions: the critical current density follows a field-scaling with that is different from weak collective pinning theory and pinning persists well-beyond the critical drive that results in a linear excess-current characteristic. The experimental data analyzed in our work satisfies these requirements and provides a coherent picture when submitted to a strong pinning analysis. Studying 2H-NbSe2 and a-MoGe with moderate critical temperature, we demonstrated that high temperature is not a necessary requirement for significant creep effects on the current–voltage characteristic. Indeed, the sensitivity of the characteristic to thermal fluctuations follows from the creep parameter which becomes small near the upper-critical field; temperature- and field variations of then have a large influence on the characteristic and are visible through thermal creep effects.
The barriers extracted from the fits can be compared with experiments on persistent current relaxation quantified by the normalized creep rate [18]. Assuming that the activation barrier vanishes with a characteristic exponent , the creep rate is related to the barrier through [5]. Fitting the data of 2H-NbSe2 for yields the barrier , see Fig. 4, a value that is consistent with the observed creep rate [31] ranging from to .
It is also important to stress that while the prefactor defines the barrier scale due to the defect potential (and is comparable to the defect pinning energy ), the actual barrier relevant for creep is much reduced due to the drive, what renders the creep motion visible in the experiment. For large drives, this barrier eventually drops below the fluctuation energy and Kramer’s rate theory breaks down. This restricts the applicability of our results and thus the reliability of the fits to the region . At large velocities with , dynamical effects become important and experimental data covering such a region far beyond the critical current then show a collapse of the pinning force and an approach towards the free flux-flow, again in agreement with the strong pinning theory.
Following the prediction of strong pinning theory that the activation barrier depends on the pinning-force density rather than the driving current density , we have proposed a new methodology to extract the creep parameters and , the barrier and prefactor in the Arrhenius law for the activated process. In comparison to the standard assumption of a barrier dependence , the strong pinning expression includes the dissipative force as well, ; the two Ansätze coincide in the region of very small velocities or large barriers, where the dissipative term can be ignored, . Analyzing our data, it turns out that this correction is relevant: e.g., for a-MoGe and (Fig. 5), we find that for ; hence, neglecting the viscous term would lead to a shift of the theoretical prediction and hence a significant deviation from the experimental data. Finally, the intriguing saturation of the creep parameter in a-MoGe at low temperatures points to the possibility of performing a direct observation of quantum creep through current–voltage measurements, that could be verified by future experimental and theoretical work.
Acknowledgements.
We thank Kristin Willa, Eli Zeldov, Marcin Konczykowski, and Roland Willa for inspiring discussions. M.B. acknowledges financial support of the Swiss National Science Foundation, Division II. Z.L.X. acknowledges supports by the U.S. Department of Energy, Office of Science, Basic Energy Sciences, Materials Sciences and Engineering and the National Science Foundation under Grant No. DMR-1901843.References
- Abrikosov [1957] A. A. Abrikosov, [Zh. Eksp. Teor. Fiz. 32, 1442 (1957)] JETP 5, 1174 (1957).
- Bardeen and Stephen [1965] J. Bardeen and M. J. Stephen, Physical Review 140, A1197 (1965).
- Anderson [1962] P. W. Anderson, Phys. Rev. Lett. 9, 309 (1962).
- Buchacek et al. [2018] M. Buchacek, R. Willa, V. B. Geshkenbein, and G. Blatter, Phys. Rev. B 98, 094510 (2018).
- Buchacek et al. [2019] M. Buchacek, R. Willa, V. B. Geshkenbein, and G. Blatter, Phys. Rev. B 100, 014501 (2019).
- Xiao et al. [2002] Z. L. Xiao, E. Y. Andrei, Y. Paltiel, E. Zeldov, P. Shuk, and M. Greenblatt, Phys. Rev. B 65, 094511 (2002).
- Roy et al. [2019] I. Roy, S. Dutta, A. N. Roy Choudhury, S. Basistha, I. Maccari, S. Mandal, J. Jesudasan, V. Bagwe, C. Castellani, L. Benfatto, and P. Raychaudhuri, Phys. Rev. Lett. 122, 047001 (2019).
- Anderson and Kim [1964] P. W. Anderson and Y. Kim, Rev. Mod. Phys. 36, 39 (1964).
- Kim et al. [1963] Y. B. Kim, C. F. Hempstead, and A. R. Strnad, Phys. Rev. 131, 2486 (1963).
- Bean [1962] C. P. Bean, Phys. Rev. Lett. 8, 250 (1962).
- Yeshurun et al. [1996] Y. Yeshurun, A. Malozemoff, and A. Shaulov, Rev. Mod. Phys. 68, 911 (1996).
- Safar et al. [1992] H. Safar, P. L. Gammel, D. J. Bishop, D. B. Mitzi, and A. Kapitulnik, Phys. Rev. Lett. 68, 2672 (1992).
- Thomann et al. [2012] A. U. Thomann, V. B. Geshkenbein, and G. Blatter, Phys. Rev. Lett. 108, 217001 (2012).
- Thomann et al. [2017] A. U. Thomann, V. B. Geshkenbein, and G. Blatter, Phys. Rev. B 96, 144516 (2017).
- Sacépé et al. [2019] B. Sacépé, J. Seidemann, F. Gay, K. Davenport, A. Rogachev, M. Ovadia, K. Michaeli, and M. V. Feigel’man, Nature Physics 15, 48 (2019).
- Strnad et al. [1964] A. R. Strnad, C. F. Hempstead, and Y. B. Kim, Phys. Rev. Lett. 13, 794 (1964).
- Larkin and Ovchinnikov [1979] A. I. Larkin and Y. N. Ovchinnikov, Journal of Low Temperature Physics 34, 409 (1979).
- Blatter et al. [1994] G. Blatter, M. V. Feigel’man, V. B. Geshkenbein, A. I. Larkin, and V. M. Vinokur, Rev. Mod. Phys. 66, 1125 (1994).
- Ovchinnikov and Ivlev [1991] Y. N. Ovchinnikov and B. I. Ivlev, Phys. Rev. B 43, 8024 (1991).
- Kramers [1940] H. Kramers, Physica 7, 284 (1940).
- Hänggi et al. [1990] P. Hänggi, P. Talkner, and M. Borkovec, Rev. Mod. Phys. 62, 251 (1990).
- Blatter and Geshkenbein [2008] G. Blatter and V. B. Geshkenbein, “Vortex matter,” in Superconductivity: Conventional and Unconventional Superconductors, edited by K. H. Bennemann and J. B. Ketterson (Springer Berlin Heidelberg, Berlin, Heidelberg, 2008) pp. 495–637.
- Kwok et al. [2016] W.-K. Kwok, U. Welp, A. Glatz, A. E. Koshelev, K. J. Kihlstrom, and G. W. Crabtree, Reports on Progress in Physics 79, 116501 (2016).
- Willa et al. [2017] R. Willa, A. E. Koshelev, I. A. Sadovskyy, and A. Glatz, Superconductor Science and Technology 31, 014001 (2017).
- Larkin and Ovchinnikov [1986] A. I. Larkin and Y. N. Ovchinnikov, in Nonlinear superconductivity (Elsevier Science (Langenberger, D. N. and Larkin, A. I., editors), 1986) p. 493.
- Blatter et al. [1991] G. Blatter, V. B. Geshkenbein, and V. M. Vinokur, Phys. Rev. Lett. 66, 3297 (1991).
- Labusch [1969] R. Labusch, Crystal Lattice Defects 1, 1 (1969).
- Blatter et al. [2004] G. Blatter, V. B. Geshkenbein, and J. A. G. Koopmann, Phys. Rev. Lett. 92, 067009 (2004).
- Willa et al. [2016] R. Willa, V. B. Geshkenbein, and G. Blatter, Phys. Rev. B 93, 064515 (2016).
- Banerjee et al. [1997] S. Banerjee, N. Patil, K. Ghosh, S. Saha, G. Menon, S. Ramakrishnan, A. Grover, P. Mishra, T. Rao, G. Ravikumar, V. Sahni, C. Tomy, G. Balakrishnan, D. Paul, and S. Bhattacharya, Physica B: Condensed Matter 237-238, 315 (1997), proceedings of the Yamada Conference XLV, the International Conference on the Physics of Transition Metals.
- Eley et al. [2018] S. Eley, K. Khilstrom, R. Fotovat, Z. L. Xiao, A. Chen, D. Chen, M. Leroux, U. Welp, and W.-K. Kwok, Scientific Reports 8 (2018), 10.1038/s41598-018-31203-0.