Sum-QE: a BERT-based Summary Quality Estimation Model
Abstract
We propose Sum-QE, a novel Quality Estimation model for summarization based on BERT. The model addresses linguistic quality aspects that are only indirectly captured by content-based approaches to summary evaluation, without involving comparison with human references. Sum-QE achieves very high correlations with human ratings, outperforming simpler models addressing these linguistic aspects. Predictions of the Sum-QE model can be used for system development, and to inform users of the quality of automatically produced summaries and other types of generated text.
1 Introduction
Quality Estimation (QE) is a term used in machine translation (MT) to refer to methods that measure the quality of automatically translated text without relying on human references Bojar et al. (2016, 2017). In this study, we address QE for summarization. Our proposed model, Sum-QE, successfully predicts linguistic qualities of summaries that traditional evaluation metrics fail to capture Lin (2004); Lin and Hovy (2003); Papineni et al. (2002); Nenkova and Passonneau (2004). Sum-QE predictions can be used for system development, to inform users of the quality of automatically produced summaries and other types of generated text, and to select the best among summaries output by multiple systems.
Sum-QE relies on the BERT language representation model Devlin et al. (2019). We use a pre-trained BERT model adding just a task-specific layer, and fine-tune the entire model on the task of predicting linguistic quality scores manually assigned to summaries. The five criteria addressed are given in Figure 1. We provide a thorough evaluation on three publicly available summarization datasets from NIST shared tasks, and compare the performance of our model to a wide variety of baseline methods capturing different aspects of linguistic quality. Sum-QE achieves very high correlations with human ratings, showing the ability of BERT to model linguistic qualities that relate to both text content and form.111Our code is available at https://github.com/nlpaueb/SumQE
2 Related Work
Summarization evaluation metrics like Pyramid Nenkova and Passonneau (2004) and ROUGE Lin and Hovy (2003); Lin (2004) are recall-oriented; they basically measure the content from a model (reference) summary that is preserved in peer (system generated) summaries. Pyramid requires substantial human effort, even in its more recent versions that involve the use of word embeddings (Passonneau et al., 2013) and a lightweight crowdsourcing scheme (Shapira et al., 2019). ROUGE is the most commonly used evaluation metric Nenkova and McKeown (2012); Allahyari et al. (2017); Gambhir and Gupta (2017). Inspired by BLEU Papineni et al. (2002), it relies on common -grams or subsequences between peer and model summaries. Many ROUGE versions are available, but it remains hard to decide which one to use (Graham, 2015). Being recall-based, ROUGE correlates well with Pyramid but poorly with linguistic qualities of summaries. Louis and Nenkova (2013) proposed a regression model for measuring summary quality without references. The scores of their model correlate well with Pyramid and Responsiveness, but text quality is only addressed indirectly.222In the Responsiveness annotation instructions, annotators were asked to assess the linguistic quality of the summary only if it interfered with the expression of information and reduced the amount of conveyed information. See https://duc.nist.gov/duc2005/responsiveness.assessment.instructions
Quality Estimation is well established in MT Callison-Burch et al. (2012); Bojar et al. (2016, 2017); Martins et al. (2017); Specia et al. (2018). QE methods provide a quality indicator for translation output at run-time without relying on human references, typically needed by MT evaluation metrics Papineni et al. (2002); Denkowski and Lavie (2014). QE models for MT make use of large post-edited datasets, and apply machine learning methods to predict post-editing effort scores and quality (good/bad) labels.
We apply QE to summarization, focusing on linguistic qualities that reflect the readability and fluency of the generated texts. Since no post-edited datasets – like the ones used in MT – are available for summarization, we use instead the ratings assigned by human annotators with respect to a set of linguistic quality criteria. Our proposed models achieve high correlation with human judgments, showing that it is possible to estimate summary quality without human references.
3 Datasets
We use datasets from the NIST DUC-05, DUC-06 and DUC-07 shared tasks Dang (2006a, b); Over et al. (2007). Given a question and a cluster of newswire documents, the contestants were asked to generate a 250-word summary answering the question. DUC-05 contains 1,600 summaries (50 questions x 32 systems); in DUC-06, 1,750 summaries are included (50 questions x 35 systems); and DUC-07 has 1,440 summaries (45 questions x 32 systems).
The submitted summaries were manually evaluated in terms of content preservation using the Pyramid score, and according to five linguistic quality criteria (), described in Figure 1, that do not involve comparison with a model summary. Annotators assigned scores on a five-point scale, with 1 and 5 indicating that the summary is bad or good with respect to a specific . The overall score for a contestant with respect to a specific is the average of the manual scores assigned to the summaries generated by the contestant. Note that the DUC-04 shared task involved seven s, but some of them were found to be highly overlapping and were grouped into five in subsequent years Over et al. (2007).333The complete guidelines given to annotators for DUC 2005 and subsequent years can be found at https://duc.nist.gov/duc2005/quality-questions.txt We address these five criteria and use DUC data from 2005 onwards in our experiments.
4 Methods
4.1 The Sum-QE Model
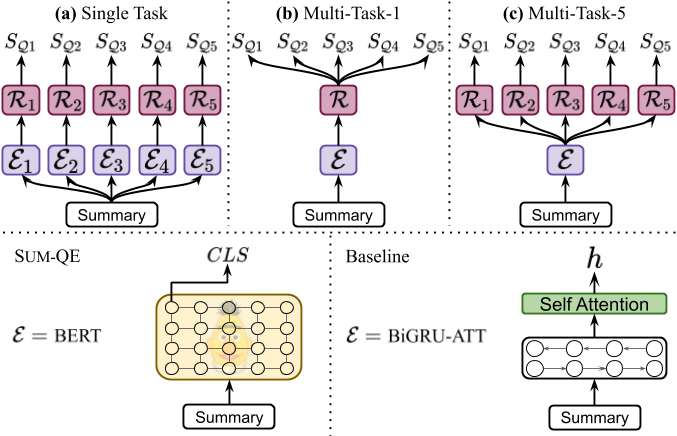
In Sum-QE, each peer summary is converted into a sequence of token embeddings, consumed by an encoder to produce a (dense vector) summary representation . Then, a regressor predicts a quality score as an affine transformation of :
| (1) |
Non-linear regression could also be used, but a linear (affine) already performs well. We use BERT as our main encoder and fine-tune it in three ways, which leads to three versions of Sum-QE.
Single-task (BERT-FT-S-1):
The first version of Sum-QE uses five separate estimators, one per quality score, each having its own encoder (a separate BERT instance generating ) and regressor (a separate linear regression layer on top of the corresponding BERT instance):
| (2) |
Multi-task with one regressor (BERT-FT-M-1):
The second version of Sum-QE uses one estimator to predict all five quality scores at once, from a single encoding of the summary, produced by a single BERT instance. The intuition is that will learn to create richer representations so that (an affine transformation of with 5 outputs) will be able to predict all quality scores:
| (3) |
where is the -th element of the vector returned by .
Multi-task with 5 regressors (BERT-FT-M-5):
The third version of Sum-QE is similar to BERT-FT-M-1, but we now use five different linear (affine) regressors, one per quality score:
| (4) |
Although BERT-FT-M-5 is mathematically equivalent to BERT-FT-M-1, in practice these two versions of Sum-QE produce different results because of implementation details related to how the losses of the regressors (five or one) are combined.
4.2 Baselines
BiGRUs with attention:
This is very similar to Sum-QE but now is a stack of BiGRUs with self-attention Xu et al. (2015), instead of a BERT instance. The final summary representation () is the sum of the resulting context-aware token embeddings () weighted by their self-attention scores (). We again have three flavors: one single-task (BiGRU-ATT-S-1) and two multi-task (BiGRU-ATT-M-1 and BiGRU-ATT-M-5).
ROUGE:
This baseline is the ROUGE version that performs best on each dataset, among the versions considered by Graham (2015). Although ROUGE focuses on surface similarities between peer and reference summaries, we would expect properties like grammaticality, referential clarity and coherence to be captured to some extent by ROUGE versions based on long -grams or longest common subsequences.
Language model (LM):
For a peer summary, a reasonable estimate of (Grammaticality) is the perplexity returned by a pre-trained language model. We experiment with the pre-trained GPT-2 model Radford et al. (2019), and with the probability estimates that BERT can produce for each token when the token is treated as masked (BERT-FR-LM).444Here BERT parameters are frozen (not fine-tuned). We use the pre-trained masked LM model to obtain probability estimates for the tokens, which are then used to calculate the perplexity. Given that the grammaticality of a summary can be corrupted by just a few bad tokens, we compute the perplexity by considering only the worst (lowest LM probability) tokens of the peer summary, where is a tuned hyper-parameter.555Consult the supplementary material for details.
Next sentence prediction:
BERT training relies on two tasks: predicting masked tokens and next sentence prediction. The latter seems to be aligned with the definitions of (Referential Clarity), (Focus) and (Structure & Coherence). Intuitively, when a sentence follows another with high probability, it should involve clear referential expressions and preserve the focus and local coherence of the text.666We also found the three quality scores to be highly correlated. The reader may refer to the supplementary material for correlation heatmaps between the five quality scores. We, therefore, use a pre-trained BERT model (BERT-FR-NS) to calculate the sentence-level perplexity of each summary:
| (5) |
where is the probability that BERT assigns to the sequence of sentences , and is the number of sentences in the peer summary.
| DUC-05 | DUC-06 | DUC-07 | ||||||||
| 1 Grammaticality | best-rouge | 0.213 | 0.128 | 0.033 | -0.049 | -0.044 | 0.331 | 0.387 | 0.283 | 0.506 |
| gpt-2 | 0.678 | 0.511 | 0.637 | 0.391 | 0.280 | 0.593 | 0.780 | 0.586 | 0.675 | |
| bert-fr-lm | 0.437 | 0.319 | 0.025 | 0.524 | 0.354 | 0.667 | 0.598 | 0.453 | 0.566 | |
| bigru-att-s-1 | 0.119 | 0.079 | 0.116 | 0.263 | 0.182 | 0.459 | 0.119 | 0.085 | 0.494 | |
| bigru-att-m-1 | 0.190 | 0.144 | 0.091 | 0.619 | 0.462 | 0.757 | 0.332 | 0.235 | 0.662 | |
| bigru-att-m-5 | 0.156 | 0.160 | 0.040 | 0.613 | 0.466 | 0.771 | 0.315 | 0.215 | 0.584 | |
| bert-ft-s-1 | 0.681 | 0.543 | 0.817 | 0.907 | 0.760 | 0.929 | 0.845 | 0.672 | 0.930 | |
| bert-ft-m-1 | 0.675 | 0.543 | 0.805 | 0.889 | 0.749 | 0.902 | 0.851 | 0.684 | 0.896 | |
| bert-ft-m-5 | 0.712 | 0.564 | 0.802 | 0.883 | 0.732 | 0.925 | 0.840 | 0.680 | 0.902 | |
| 2 Non redundancy | best-rouge | -0.121 | -0.081 | 0.064 | -0.401 | -0.301 | -0.408 | -0.299 | -0.222 | -0.486 |
| bigru-att-s-1 | -0.063 | -0.049 | -0.101 | 0.511 | 0.358 | 0.514 | 0.468 | 0.352 | 0.457 | |
| bigru-att-m-1 | -0.197 | -0.143 | -0.094 | 0.478 | 0.478 | 0.524 | 0.478 | 0.340 | 0.565 | |
| bigru-att-m-5 | -0.226 | -0.167 | -0.124 | 0.414 | 0.304 | 0.399 | 0.283 | 0.201 | 0.238 | |
| bert-ft-s-1 | 0.330 | 0.232 | 0.499 | 0.677 | 0.517 | 0.679 | 0.756 | 0.576 | 0.689 | |
| bert-ft-m-1 | 0.333 | 0.232 | 0.494 | 0.791 | 0.615 | 0.789 | 0.761 | 0.596 | 0.799 | |
| bert-ft-m-5 | 0.377 | 0.310 | 0.471 | 0.632 | 0.460 | 0.674 | 0.754 | 0.572 | 0.740 | |
| 3 Referential clarity | best-rouge | 0.381 | 0.284 | 0.166 | 0.411 | 0.329 | 0.372 | 0.449 | 0.347 | 0.407 |
| bert-fr-ns | 0.185 | 0.130 | -0.138 | 0.462 | 0.315 | 0.494 | 0.478 | 0.322 | 0.085 | |
| bigru-att-s-1 | 0.662 | 0.479 | 0.468 | 0.493 | 0.342 | 0.647 | 0.664 | 0.476 | 0.677 | |
| bigru-att-m-1 | 0.702 | 0.540 | 0.492 | 0.527 | 0.396 | 0.681 | 0.732 | 0.533 | 0.681 | |
| bigru-att-m-5 | 0.694 | 0.519 | 0.492 | 0.579 | 0.427 | 0.719 | 0.659 | 0.472 | 0.655 | |
| bert-ft-s-1 | 0.913 | 0.759 | 0.796 | 0.872 | 0.732 | 0.901 | 0.934 | 0.796 | 0.936 | |
| bert-ft-m-1 | 0.889 | 0.714 | 0.761 | 0.881 | 0.735 | 0.882 | 0.879 | 0.699 | 0.891 | |
| bert-ft-m-5 | 0.810 | 0.617 | 0.732 | 0.860 | 0.718 | 0.919 | 0.889 | 0.723 | 0.895 | |
| 4 Focus | best-rouge | 0.440 | 0.373 | 0.270 | 0.440 | 0.331 | 0.475 | 0.495 | 0.360 | 0.563 |
| bert-fr-ns | 0.458 | 0.337 | -0.106 | 0.522 | 0.354 | 0.508 | 0.547 | 0.364 | 0.089 | |
| bigru-att-s-1 | 0.150 | 0.110 | 0.153 | 0.355 | 0.242 | 0.644 | 0.433 | 0.321 | 0.533 | |
| bigru-att-m-1 | 0.199 | 0.118 | 0.194 | 0.366 | 0.259 | 0.653 | 0.533 | 0.372 | 0.553 | |
| bigru-att-m-5 | 0.154 | 0.097 | 0.160 | 0.493 | 0.371 | 0.691 | 0.645 | 0.462 | 0.657 | |
| bert-ft-s-1 | 0.645 | 0.471 | 0.578 | 0.814 | 0.636 | 0.853 | 0.873 | 0.704 | 0.902 | |
| bert-ft-m-1 | 0.664 | 0.491 | 0.642 | 0.776 | 0.608 | 0.842 | 0.893 | 0.745 | 0.905 | |
| bert-ft-m-5 | 0.791 | 0.621 | 0.739 | 0.875 | 0.710 | 0.911 | 0.818 | 0.636 | 0.867 | |
| 5 Structure & Coherence | best-rouge | 0.391 | 0.300 | 0.039 | 0.080 | 0.056 | 0.023 | 0.370 | 0.292 | 0.293 |
| bert-fr-ns | 0.200 | 0.153 | -0.140 | 0.171 | 0.120 | 0.285 | 0.418 | 0.280 | 0.015 | |
| bigru-att-s-1 | 0.223 | 0.153 | 0.040 | 0.458 | 0.326 | 0.526 | 0.606 | 0.442 | 0.534 | |
| bigru-att-m-1 | 0.404 | 0.264 | 0.067 | 0.479 | 0.350 | 0.599 | 0.664 | 0.499 | 0.576 | |
| bigru-att-m-5 | 0.244 | 0.157 | -0.113 | 0.435 | 0.296 | 0.540 | 0.522 | 0.389 | 0.506 | |
| bert-ft-s-1 | 0.536 | 0.415 | 0.477 | 0.681 | 0.522 | 0.810 | 0.862 | 0.690 | 0.857 | |
| bert-ft-m-1 | 0.566 | 0.419 | 0.512 | 0.684 | 0.515 | 0.726 | 0.864 | 0.690 | 0.803 | |
| bert-ft-m-5 | 0.634 | 0.472 | 0.586 | 0.796 | 0.620 | 0.892 | 0.921 | 0.787 | 0.843 | |
5 Experiments
To evaluate our methods for a particular , we calculate the average of the predicted scores for the summaries of each particular contestant, and the average of the corresponding manual scores assigned to the contestant’s summaries. We measure the correlation between the two (predicted vs. manual) across all contestants using Spearman’s , Kendall’s and Pearson’s .
We train and test the Sum-QE and BiGRU-ATT versions using a 3-fold procedure. In each fold, we train on two datasets (e.g., DUC-05, DUC-06) and test on the third (e.g., DUC-07). We follow the same procedure with the three BiGRU-based models. Hyper-perameters are tuned on a held out subset from the training set of each fold.
6 Results
Table 1 shows Spearman’s , Kendall’s and Pearson’s for all datasets and models. The three fine-tuned BERT versions clearly outperform all other methods. Multi-task versions seem to perform better than single-task ones in most cases. Especially for and , which are highly correlated, the multi-task BERT versions achieve the best overall results. BiGRU-ATT also benefits from multi-task learning.
| DUC-05 | DUC-06 | DUC-07 | |
|---|---|---|---|
| 1 | 3.77 ( 0.42) | 3.58 ( 0.60) | 3.54 ( 0.78) |
| 2 | 4.41 ( 0.20) | 4.23 ( 0.26) | 3.71 ( 0.31) |
| 3 | 2.99 ( 0.50) | 3.11 ( 0.52) | 3.20 ( 0.66) |
| 4 | 3.15 ( 0.41) | 3.60 ( 0.39) | 3.30 ( 0.47) |
| 5 | 2.18 ( 0.46) | 2.39 ( 0.51) | 2.42 ( 0.59) |
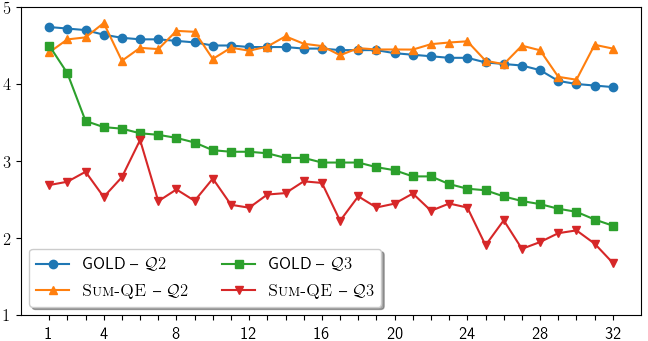
The correlation of Sum-QE with human judgments is high or very high Hinkle et al. (2003) for all s in all datasets, apart from in DUC-05 where it is only moderate. Manual scores for in DUC-05 are the highest among all s and years (between 4 and 5) and with the smallest standard deviation, as shown in Table 2. Differences among systems are thus small in this respect, and although Sum-QE predicts scores in this range, it struggles to put them in the correct order, as illustrated in Figure 3.
BEST-ROUGE has a negative correlation with the ground-truth scores for 2 since it does not account for repetitions. The BiGRU-based models also reach their lowest performance on 2 in DUC-05. A possible reason for the higher relative performance of the BERT-based models, which achieve a moderate positive correlation, is that BiGRU captures long-distance relations less effectively than BERT, which utilizes Transformers Vaswani et al. (2017) and has a larger receptive field. A possible improvement would be a stacked BiGRU, since the states of higher stack layers have a larger receptive field as well.777As we move up the stack, the states are affected directly by their neighbors and indirectly by the neighbors of their neighbors, and so on.
The BERT multi-task versions perform better with highly correlated qualities like and (as illustrated in Figures 2 to 4 in the supplementary material). However, there is not a clear winner among them. Mathematical equivalence does not lead to deterministic results, especially when random initialization and stochastic learning algorithms are involved. An in-depth exploration of this point would involve further investigation, which will be part of future work.
7 Conclusion and Future Work
We propose a novel Quality Estimation model for summarization which does not require human references to estimate the quality of automatically produced summaries. Sum-QE successfully predicts qualitative aspects of summaries that recall-oriented evaluation metrics fail to approximate. Leveraging powerful BERT representations, it achieves high correlations with human scores for most linguistic qualities rated, on three different datasets. Future work involves extending the Sum-QE model to capture content-related aspects, either in combination with existing evaluation metrics (like Pyramid and ROUGE) or, preferably, by identifying important information in the original text and modelling its preservation in the proposed summaries. This would preserve Sum-QE’s independence from human references, a property of central importance in real-life usage scenarios and system development settings.
The datasets used in our experiments come from the NIST DUC shared tasks which comprise newswire articles. We believe that Sum-QE could be easily applied to other domains. A small amount of annotated data would be needed for fine-tuning – especially in domains with specialized vocabulary (e.g., biomedical) – but the model could also be used out of the box. A concrete estimation of performance in this setting will be part of future work. Also, the model could serve to estimate linguistic qualities other than the ones in the DUC dataset with mininum effort.
Finally, Sum-QE could serve to assess the quality of other types of texts, not only summaries. It could thus be applied to other text generation tasks, such as natural language generation and sentence compression.
Acknowledgments
We would like to thank the anonymous reviewers for their helpful feedback on this work. The work has been partly supported by the Research Center of the Athens University of Economics and Business, and by the French National Research Agency under project ANR-16-CE33-0013.
References
- Allahyari et al. (2017) Mehdi Allahyari, Seyedamin Pouriyeh, Mehdi Assefi, Saeid Safaei, Elizabeth D. Trippe, Juan B. Gutierrez, and Krys Kochut. 2017. Text Summarization Techniques: A Brief Survey. Advanced Computer Science and Applications, 8:397–405.
- Bojar et al. (2017) Ondřej Bojar, Rajen Chatterjee, Christian Federmann, Yvette Graham, Barry Haddow, Shujian Huang, Matthias Huck, Philipp Koehn, Qun Liu, Varvara Logacheva, Christof Monz, Matteo Negri, Matt Post, Raphael Rubino, Lucia Specia, and Marco Turchi. 2017. Findings of the 2017 Conference on Machine Translation (WMT17). In Proceedings of the Second Conference on Machine Translation, pages 169–214, Copenhagen, Denmark. Association for Computational Linguistics.
- Bojar et al. (2016) Ondřej Bojar, Rajen Chatterjee, Christian Federmann, Yvette Graham, Barry Haddow, Matthias Huck, Antonio Jimeno Yepes, Philipp Koehn, Varvara Logacheva, Christof Monz, Matteo Negri, Aurelie Neveol, Mariana Neves, Martin Popel, Matt Post, Raphael Rubino, Carolina Scarton, Lucia Specia, Marco Turchi, Karin Verspoor, and Marcos Zampieri. 2016. Findings of the 2016 Conference on Machine Translation. In Proceedings of the First Conference on Machine Translation, pages 131–198, Berlin, Germany. Association for Computational Linguistics.
- Callison-Burch et al. (2012) Chris Callison-Burch, Philipp Koehn, Christof Monz, Matt Post, Radu Soricut, and Lucia Specia. 2012. Findings of the 2012 Workshop on Statistical Machine Translation. In Proceedings of the Seventh Workshop on Statistical Machine Translation, pages 10–51, Montréal, Canada. Association for Computational Linguistics.
- Dang (2006a) Hoa Trang Dang. 2006a. DUC 2005: Evaluation of Question-focused Summarization Systems. In Proceedings of the Workshop on Task-Focused Summarization and Question Answering, SumQA ’06, pages 48–55, Sydney, Australia.
- Dang (2006b) Hoa Trang Dang. 2006b. Overview of DUC 2006. In Proceedings of the Document Understanding Workshop at HLT-NAACL 2006, Brooklyn, NY, USA.
- Denkowski and Lavie (2014) Michael Denkowski and Alon Lavie. 2014. Meteor Universal: Language Specific Translation Evaluation for Any Target Language. In Proceedings of the Ninth Workshop on Statistical Machine Translation, pages 376–380, Baltimore, Maryland, USA. Association for Computational Linguistics.
- Devlin et al. (2019) Jacob Devlin, Ming-Wei Chang, Kenton Lee, and Kristina Toutanova. 2019. BERT: Pre-training of Deep Bidirectional Transformers for Language Understanding. In Proceedings of the 2019 Conference of the North American Chapter of the Association for Computational Linguistics: Human Language Technologies, Volume 1 (Long and Short Papers), pages 4171–4186, Minneapolis, Minnesota. Association for Computational Linguistics.
- Gambhir and Gupta (2017) Mahak Gambhir and Vishal Gupta. 2017. Recent automatic text summarization techniques: a survey. Artificial Intelligence Review, 47(1):1–66.
- Graham (2015) Yvette Graham. 2015. Re-evaluating Automatic Summarization with BLEU and 192 Shades of ROUGE. In Proceedings of the 2015 Conference on Empirical Methods in Natural Language Processing, pages 128–137, Lisbon, Portugal. Association for Computational Linguistics.
- Hinkle et al. (2003) D.E. Hinkle, W. Wiersma, and S.G. Jurs. 2003. Applied Statistics for the Behavioral Sciences, volume 663 of Applied Statistics for the Behavioral Sciences. Houghton Mifflin.
- Lin (2004) Chin-Yew Lin. 2004. ROUGE: A Package for Automatic Evaluation of Summaries. In Workshop on Text Summarization Branches Out, pages 74–81, Barcelona, Spain. Association for Computational Linguistics.
- Lin and Hovy (2003) Chin-Yew Lin and Eduard Hovy. 2003. Automatic Evaluation of Summaries Using N-gram Co-occurrence Statistics. In Proceedings of the 2003 Human Language Technology Conference of the North American Chapter of the Association for Computational Linguistics, pages 150–157, Edmonton, Canada. Association for Computational Linguistics.
- Louis and Nenkova (2013) Annie Louis and Ani Nenkova. 2013. Automatically Assessing Machine Summary Content Without a Gold Standard. Computational Linguistics, 39(2):267–300.
- Martins et al. (2017) André F. T. Martins, Marcin Junczys-Dowmunt, Fabio N. Kepler, Ramón Astudillo, Chris Hokamp, and Roman Grundkiewicz. 2017. Pushing the Limits of Translation Quality Estimation. Transactions of the Association for Computational Linguistics, 5:205–218.
- Nenkova and McKeown (2012) Ani Nenkova and Kathleen McKeown. 2012. A Survey of Text Summarization Techniques. In Charu C. Aggarwal and ChengXiang Zhai, editors, Mining Text Data, pages 43–76. Springer, Boston, MA.
- Nenkova and Passonneau (2004) Ani Nenkova and Rebecca Passonneau. 2004. Evaluating Content Selection in Summarization: The Pyramid Method. In Proceedings of the Human Language Technology Conference of the North American Chapter of the Association for Computational Linguistics: HLT-NAACL 2004, pages 145–152, Boston, Massachusetts, USA. Association for Computational Linguistics.
- Over et al. (2007) Paul Over, Hoa Dang, and Donna Harman. 2007. DUC in Context. Information Processing & Management, 43(6):1506–1520.
- Papineni et al. (2002) Kishore Papineni, Salim Roukos, Todd Ward, and Wei-Jing Zhu. 2002. BLEU: A Method for Automatic Evaluation of Machine Translation. In Proceedings of 40th Annual Meeting of the Association for Computational Linguistics, pages 311–318, Philadelphia, Pennsylvania, USA. Association for Computational Linguistics.
- Passonneau et al. (2013) Rebecca J. Passonneau, Emily Chen, Weiwei Guo, and Dolores Perin. 2013. Automated Pyramid Scoring of Summaries using Distributional Semantics. In Proceedings of the 51st Annual Meeting of the Association for Computational Linguistics (Volume 2: Short Papers), pages 143–147, Sofia, Bulgaria. Association for Computational Linguistics.
- Radford et al. (2019) Alec Radford, Jeff Wu, Rewon Child, David Luan, Dario Amodei, and Ilya Sutskever. 2019. Language Models are Unsupervised Multitask Learners.
- Shapira et al. (2019) Ori Shapira, David Gabay, Yang Gao, Hadar Ronen, Ramakanth Pasunuru, Mohit Bansal, Yael Amsterdamer, and Ido Dagan. 2019. Crowdsourcing Lightweight Pyramids for Manual Summary Evaluation. In Proceedings of the 2019 Conference of the North American Chapter of the Association for Computational Linguistics: Human Language Technologies, Volume 1 (Long and Short Papers), pages 682–687, Minneapolis, Minnesota. Association for Computational Linguistics.
- Specia et al. (2018) Lucia Specia, Frédéric Blain, Varvara Logacheva, Ramón Astudillo, and André F. T. Martins. 2018. Findings of the WMT 2018 Shared Task on Quality Estimation. In Proceedings of the Third Conference on Machine Translation: Shared Task Papers, pages 689–709, Belgium, Brussels. Association for Computational Linguistics.
- Vaswani et al. (2017) Ashish Vaswani, Noam Shazeer, Niki Parmar, Jakob Uszkoreit, Llion Jones, Aidan N Gomez, Łukasz Kaiser, and Illia Polosukhin. 2017. Attention is All you Need. In Advances in Neural Information Processing Systems 30, pages 5998–6008. Curran Associates, Inc.
- Xu et al. (2015) Kelvin Xu, Jimmy Ba, Ryan Kiros, Kyunghyun Cho, Aaron Courville, Ruslan Salakhudinov, Rich Zemel, and Yoshua Bengio. 2015. Show, Attend and Tell: Neural Image Caption Generation with Visual Attention. In Proceedings of the 32nd International Conference on Machine Learning (ICML), pages 2048–2057, Lille, France. PMLR.