Precursors in Short Gamma-ray Bursts as a Possible Probe of Progenitors
Abstract
We extract 18 candidate short gamma-ray bursts (SGRBs) with precursors from 660 SGRBs observed by Fermi and Swift satellites, and carry out a comprehensive analysis on their temporal and spectral features. We obtain the following results: (1) For a large fraction of candidates, the main burst durations are longer than their precursor durations, comparable to their quiescent times from the end of precursors to the beginning of their main bursts. (2) The average flux of precursors tends to increase as their main bursts brighten. (3) As seen from the distributions of hardness ratio and spectral fitting, the precursors are slightly spectrally softer with respect to the main bursts. Moreover, a significant portion of precursors and all main bursts favor a non-thermal spectrum. (4) The precursors might be a probe of the progenitor properties of SGRBs such as the magnetic field strength and the crustal equation of state if they arise from some processes before mergers of binary compact objects rather than post-merger processes.
1 Introduction
Based on the bimodal burst duration distribution (), gamma-ray bursts (GRBs) can be generally classified into long gamma-ray bursts (LGRBs) and short gamma-ray bursts (SGRBs) (Kouveliotou et al., 1993), which are widely thought to be associated with two types of distinguished origins: the core collapse of massive stars (Woosley, 1993; Paczyński, 1998) and the merger of neutron star-neutron star (NS-NS) (Paczynski, 1986; Eichler et al., 1989) or neutron star-black hole (NS-BH) (Paczynski, 1991), respectively. Thus the prompt GRB emissions can statistically probe for the type of GRBs’ progenitors. Besides, many authors investigated qualitatively and quantitatively the GRBs’ progenitors from other observations such as their associated supernovae (e.g., Galama et al., 1998; Hjorth et al., 2003), host galaxies (Bloom et al., 2002; Berger, 2011), afterglows (Klose et al., 2004), and gravitational waves (Abbott et al., 2017). In addition to these methods of probing the progenitor properties, a different method that was suggested is to utilize the earlier less-intense episodes (the so-called “precursors”) (Murakami et al., 1991; Koshut et al., 1995; Lazzati, 2005; Hu et al., 2014; Lan et al., 2018) preceding to the prompt emission episodes (“main bursts”) in GRBs, especially in SGRBs (Troja et al., 2010; Minaev & Pozanenko, 2017; Wang et al., 2018).
Observationally, in LGRBs detected by the BATSE telescope, the precursors earlier than the main bursts with typical several tens of seconds extending up to 200 s have typically a non-thermal power-law spectrum and a feature spectrally softer than the main bursts (Lazzati, 2005). Moreover, a very large fraction of precursors of LGRBs observed by Swift have a shorter duration than their main bursts (Hu et al., 2014). Theoretically, precursors in LGRBs could be associated with relativistic fireballs that were proposed to explain their main bursts (Paczynski, 1986; Mészáros et al., 2001), or with progenitor-linking jet breakout from massive stars (Ramirez-Ruiz et al., 2002; Waxman & Mészáros, 2003; Zhang et al., 2003; Lazzati & Begelman, 2005). But these interpretations cannot completely meet the precursor observations in LGRBs (Lazzati, 2005).
For precursors in SGRBs, Troja et al. (2010) carried out a systematic search in Swift catalog and did not find substantial differences between the precursor and the main burst from the hardness ratio comparison for five SGRBs. Minaev & Pozanenko (2017) also made a comprehensive search for the precursors of SGRBs detected in the SPI-ACS/INTEGRAL experiment and Fermi satellite and found only four candidates. In any case, only a few SGRBs with precursors make it difficult to systematically study the temporal and spectral features of precursors. Therefore, more SGRBs with precursors are still expected to collect.
In this paper, we first carry out a complete search for SGRBs with precursors observed by Swift from 2004 November to 2019 May and Fermi from 2008 June to 2019 May, and extract available candidates by a Bayesian Blocks (BBlocks) technique in §2. We further statistically analyze their temporal and spectral properties, and the possible relations among the quantities that represent the features in §3. Finally we discuss the origin of the precursors in SGRBs and the possibility of the precursors as a probe of the progenitors of SGRBs in §4, and present conclusions in §5. Throughout, the notations in cgs units and a concordance cosmology with parameters , , and are adopted.
2 Data and Analysis
2.1 Sample Selection with Bayesian Blocks Analysis
We have searched for SGRBs from Swift Burst Alert Telescope (BAT)111http://www.swift.ac.uk/archive/obs.php?burst=1 and Fermi Gamma-Ray Burst Monitor (GBM) data222 https://heasarc.gsfc.nasa.gov/W3Browse/fermi/fermigbrst.html. Adopting the burst duration requirement s, we made a gallery of nearly 120 BAT SGRBs and 430 GBM SGRBs. To extend the SGRB sample, we have also collected more than 110 other possible SGRBs from the literature (e.g., Lu et al., 2017). The total number of SGRBs is up to 660. Interestingly, some SGRBs either observed by both Swift BAT and Fermi GBM or observed by both Fermi GBM and Fermi Large Area Telescope (LAT) can provide more information about themselves.
To extract those SGRBs with precursors, we have performed the BBlocks Representations (Scargle et al., 2013) to find the optimal segmentation for the Swift and Fermi time-tagged event (TTE) data. This analysis technique divides a series of events characterized by the photon arrival times into subintervals (blocks) of the perceptibly constant count rate, with change points to define the edges of blocks and determine the signal amplitudes of blocks. Moreover, the false positive rate is given to , which decides the penalization on the likelihood and affects the number of blocks (see Eq. (21) in Scargle et al., 2013). In addition, softwares heasoft (ver. 6.24), calibration database (CALDB), and ScienceTools (v10r0p5) are needed to use for data extraction and handling. As the Swift BAT TTE data are slightly different from those of Fermi in background substraction, the handling processes are somewhat different as follows:
(1) Swift SGRBs: their TTE data need to give the mask weighting for masking out the noisy or defective detectors from the quality map 333https://swift.gsfc.nasa.gov/analysis/threads/batmaskwtthread.html. We extracted the event data with time intervals [-200 s, 50 s] relative to their trigger times, and searched the presence of weak emission signal by the BBlocks technique. In order to inspect the signals within different energy bands, we used the BBlocks for events in 15-50 keV, 50-150 keV, and the whole energy range 15-150 keV.
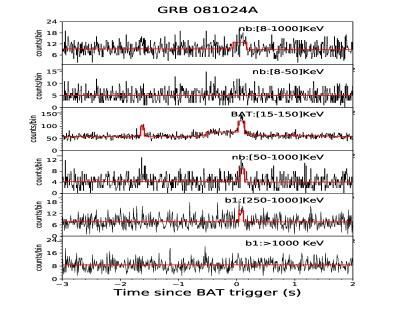
(2) Fermi SGRBs: these data are mainly obtained by the GBM instrument containing NaI sodium iodide (NaI) detectors with energy band 8 keV - 1 MeV and bismuth germanate (BGO) scintillation detectors covering energy range 200 keV - 40 MeV (Meegan et al., 2009). A few events also are observed by LAT instrument with energy range 20 MeV - 300 GeV (Atwood et al., 2009). Similarly, we performed BBlocks for their TTE data in the intervals [-200 s, 50 s] since their GBM triggers. The energy bands are split into 8-50 keV, 50-1000 keV, and 8-1000 keV for the NaI data, while 250-1000 keV and 1000 keV for those of BGO are adopted.
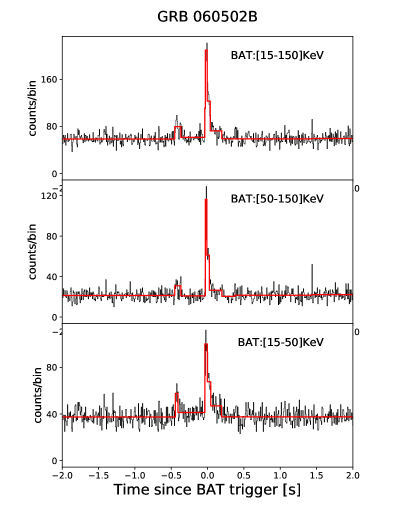
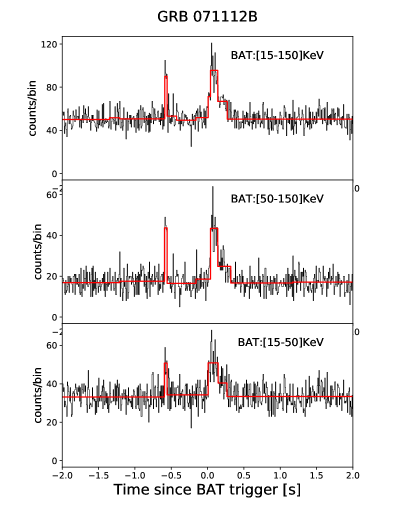
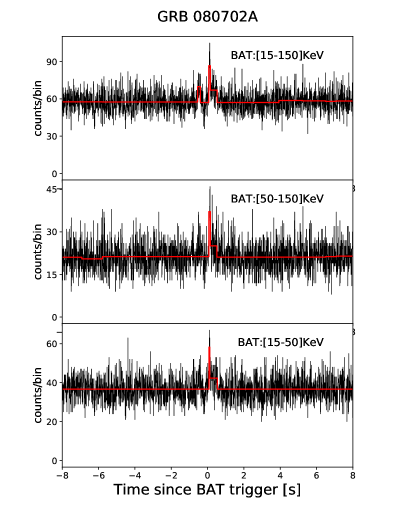
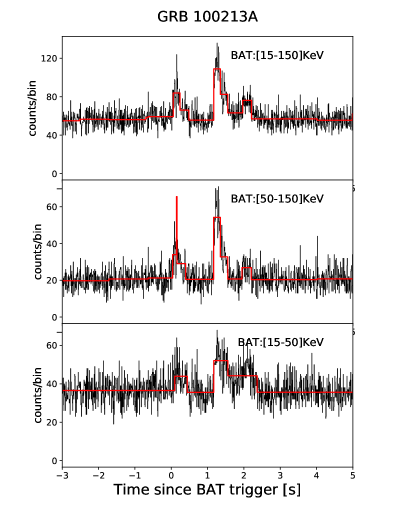
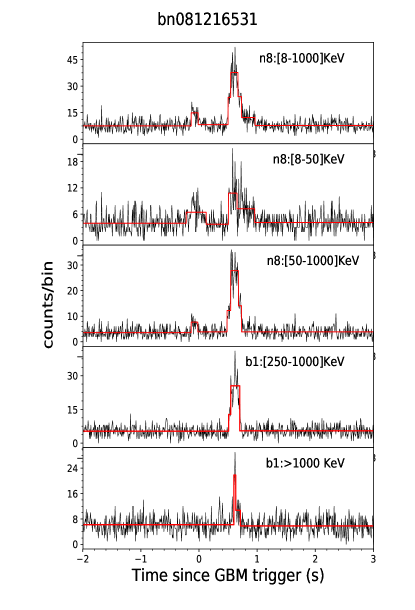
After performing BBlocks, we selected those candidates with precursors should satisfy the following two criteria according to Troja et al. (2010): (a) the peak flux of a prior episode (precursor) is smaller than the posterior episode (main burst); (b) the precursor flux returns to the background level before the start of the main burst. Finally, we sampled 18 candidate SGRBs, in which 5 are collected from only Swift BAT instrument, 7 are observed by only Fermi satellite, and 6 are detected by both Swift and Fermi. The sample has an overlap with Troja et al. (2010) and Minaev & Pozanenko (2017). As shown in Figure 1 and the left panels of Figures 2 and 3, the temporal profiles are plotted in units of counts/bin (bin=8 ms) for different energy bands, with the results by the BBlocks analysis illustrated by the red solid lines. For these lines, the preburst and postburst temporal backgrounds are fitted with the first block and the last block. The time intervals that blocks over the background level occupy are treated as the time intervals of signals, as listed in Columns 3 and 6 of Table 1. Additionally, in each time interval, the amplitudes of blocks minus the background (i.e., the amplitude of the first block or the last block) are treated as the fluxes of signals. As illuminated in the following hardness ratio (HR) and average flux analysis of the precursor and the main burst, we can carry out some calculations according to the amplitudes of blocks in the time intervals of the precursor and the main burst, within different energy bands.
Due to the false positive rate in each precursor, one may expect 1 spurious detection for 18 precursors. In order to examine whether these precursors are real or spurious detections, we also did a cross check with the observations of other spacecrafts. 7 precursors are confidently considered to be real in the whole sample. The precursors in GRBs 090510, 140209A, 160726A, and 180402A were observed simultaneously by Swift and Fermi by our BBlocks analysis. Troja et al. (2010) checked that the precursor of GRB 081024A was also observed by both Swift and Fermi. In addition, the precursors in GRBs 100717372 and 130310840 are detected by Swift, Fermi, Messenger, Agile, and Fermi, KONUS, Suzaku, Messenger, HEND-Odyssey, respectively (Minaev & Pozanenko, 2017). Others in Troja et al. (2010) and Minaev & Pozanenko (2017) such as GRBs 091117 and 071030 cannot be downloaded from the Swift archive listing any more to re-analyze by the BBlocks technique. Several precursors such as in GRB 050724, in the time interval s of GRB 080702A, and in the time interval s of GRB 090510 reported by Troja et al. (2010), cannot be identified by our BBlocks analysis for the following reasons. (1) Data type: Troja et al. (2010) used the RATE column of binned event data with a time bin of 0.128 ms, while we used the COUNTS column of TTE data. (2) Algorithm: a wavelet analysis with a Morlet mother function which has both time and frequency resolution, was adopted in Troja et al. (2010); while the BBlocks is focused on detecting the time-domain shape of signals with no reference to any frequency limitations or behavior. Those precursors identified by a wavelet analysis rather than the BBlocks are likely attributed to the frequency (periodicity) resolution. Nevertheless, we can also see that the precursors in the time interval -0.56-0.25 s of GRB 080702A and in GRBs 060502B and 071112B in Swift before 2010 were not found by Troja et al. (2010).
2.2 Image Analysis
As did in Troja et al. (2010), we also used batcelldetect operating on background-subtracted sky image and partial coding map to perform a source detection for the time interval of precursor at its corresponding GRB position, for all candidate SGRBs observed by Swift. The handling process refers to BAT analysis threads444https://swift.gsfc.nasa.gov/analysis/threads/bat_threads.html. The significance levels of the precursors in the image domain are listed in the last column of Table 1. For a blind source detection considered to be real, it should have a significance threshold of at least across the entire BAT detector area. As we already knew the GRB position, the blind source detection in the image domain is not necessary. Instead, detecting a source at a known position can reduce the number of trials by a factor of , so the values of significance in the last column would be more restrictive than the same values in blind search. Moreover, the precursors such as in GRBs 090510 and 180402A are confidently deemed to be real since they are detected by both Swift and Fermi, though their significance levels in the image domain seem low.
3 Results
3.1 Temporal Properties
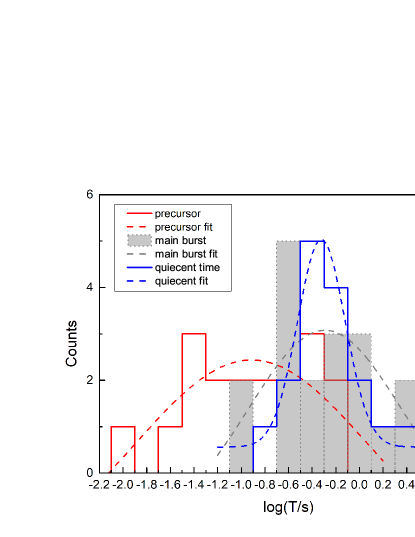
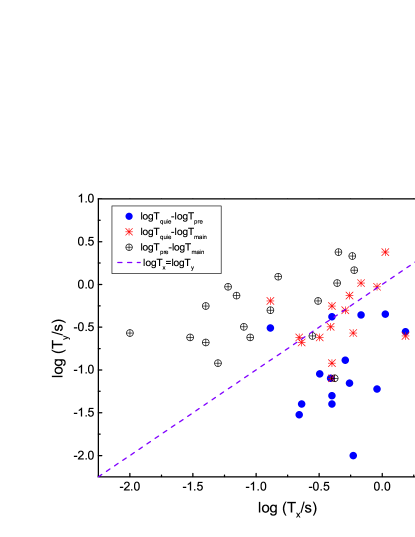
The temporal light curves of 18 candidates with precursor emission are illustrated in Figure 1, and the left panels of Figures 2 and 3, where the red solid block patterns over background show signals. Among them, one faint precursor signal in GRB 130310840 is magnified to show clearly with the inset. Through the BBlocks analysis for the light curves, we defined the time interval that the blocks over background occupy for each episode as its duration (the precursor and the main burst ), and the time interval from the end of the precursor to the beginning of the main burst as the quiescent time . Since the block light curves are separated into different energy bands, we mainly chose the whole band 15-150 keV for BAT light curves and 8-1000 keV for GBM light curves to determine the durations. If the precursor signature does not emerge in the whole energy band light curves such as GRBs 100827455 and 130310840, however, we would choose the other energy band light curve with the strongest precursor emission to make an analysis. The results of the time intervals are reported in Table 1. We further made distributions for these durations by using a Gaussian function. As shown in the left panel of Figure 4, the precursors distribute as log, which is obviously shorter than that of the main bursts log. The quiescent time distribution log, with a relatively small scatter, is comparable to the main burst. For the whole sample, the precursor durations, main burst durations, and quiescent times span the ranges 0.01-0.6 s, 0.08-2.39 s, and 0.13-3.65 s, respectively. More specifically, the precursors in a major fraction of (16/18) cases are shorter than the corresponding main bursts. In contrast, the quiescent times in more than half of (11/18) cases are longer than their corresponding main bursts. Moreover, we also did correlation analysis for the precursor duration, main burst duration, and quiescent time, but found no any significant correlations among them, as seen in the right panel of Figure 4. Furthermore, it is worth noting that there is no quiescent time second in our sample by the BBlocks analysis, compared with the quiescent time up to 100 second in Troja et al. (2010). This could lead to the differences such as in data type and algorithm as aforementioned in the end of §2.1. Otherwise, Minaev & Pozanenko (2017) did not yet found those cases that have a quiescent time second in the SPI-ACS/INTEGRAL experiment via a wavelet analysis. Therefore, it is unclear why our result differs from that of Troja et al. (2010).
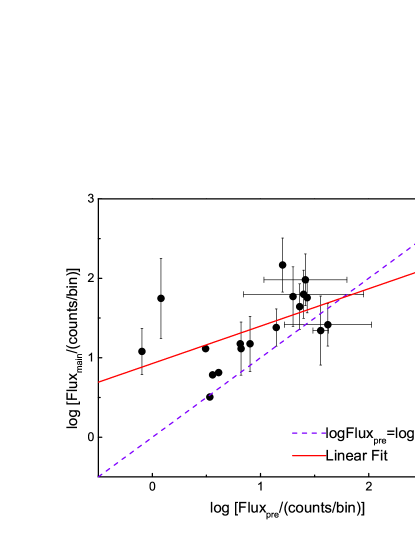
Although we selected the candidate SGRBs with precursors in terms of the peak flux difference between the less-intensive episode and the proper episode, we also calculated the average flux for each episode. The average flux can be estimated as the average amplitude of blocks over background in the time interval of episode, from the BBlock analysis within the energy band 15-150 keV for SGRBs observed by only Swift and by both Swift and Fermi, and within the energy band 8-1000 keV for those observed by only Fermi. The standard deviation of block amplitudes is regarded as the average flux error in each episode. Illustrated in the right panel of Figure 5, the average flux for each precursor is also generally smaller than that of its main burst. Additionally, the average flux of precursors tends to increase as their main bursts brighten, with loglog (Pearson correlation coefficient and chance probability ), suggesting a weak positive relation in average flux between the precursors and the main bursts.
3.2 Spectral Properties
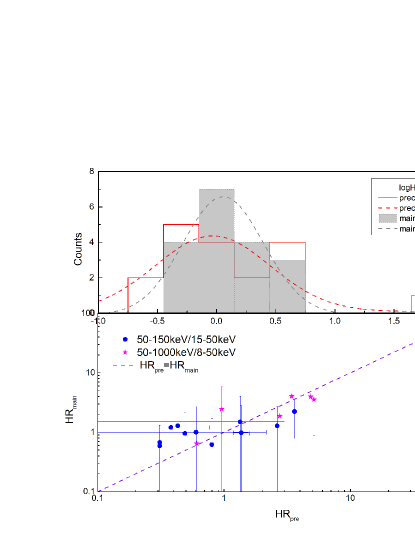
The HR is defined as the ratio of count rate in 50-150 keV over 15-50 keV for SGRBs observed by Swift and by both Swift and Fermi. For SGRBs observed by only Fermi, the HR is defined as the count rate in 50-1000 keV over 8-50 keV. This is an applicable quantity to illuminate the spectral feature especially for faint emission and for narrow Swift BAT spectra which have only a sensitive energy range 15-150 keV. We proceeded a HR calculation for the precursors and main bursts identified by our BBlocks analysis. Apparently, the HR can also be estimated from the average flux ratio (the average amplitude ratio of blocks) in different energy bands shown in Figures 1, 2, and 3, after the background subtraction from the first block and the last block. The HR error is treated as the standard deviations of amplitudes of blocks in two different energy bands. As displayed in the left panel of Figure 5, the HR Gauss distributions are log for the precursors and log for the main bursts, indicating that the main bursts are slightly harder than the precursors. However, we can also see that a half of precursors occupy the region , no matter for candidates observed by only Swift and by both Swift and Fermi or for those observed by only Fermi. Furthermore, there is no any relation in HR between the precursors and the main bursts to be found. These results are basically in agreement with the HR results in Troja et al. (2010).
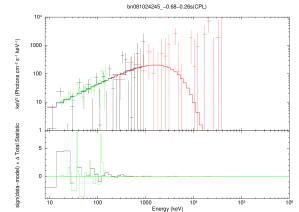
As the Swift BAT has a narrow energy band, its spectra usually can be well fit with only single power-law (PL) model. In contrast, the Fermi GBM and LAT cover a wide energy range in gamma-ray bands and their GRB spectra usually appear one or two breaks and can be well fit with a cutoff power-law model (CPL) (or adding a PL model) (Lu et al., 2017; Lan et al., 2018), read
| (1) |
where , , and are the photon spectral index, the normalization parameter in units of photons/keV/cm2/s at 1 keV, and the cutoff energy in keV, respectively. Thus we did a spectral fitting only for those candidates observed by Fermi and by both Fermi and Swift. Additionally, a blackbody (BB) spectrum function is also used for trial fitting to the spectra in order to search for the thermal component, which is expressed by
| (2) |
where is the temperature in keV. These two models are built in Xspec. We also used the tools gtburst to extract the GBM and LAT-LLE spectrum files, and Xspec to fit the GBM and LAT-LLE spectra, combining the BAT spectra. A PGSTAT statistics method is used for GBM and LAT-LLE spectrum fitting (Cash, 1979), while the default chi-squared (CHI) is invoked for BAT spectrum fitting. The reduced is given to estimate the goodness of fitting results. The comparison for the fitting goodness between CPL and BB model, is made by the Bayesian information criterion (BIC), for which evidence against the model with the higher BIC can be formulated as: a) , not worth more than a bare mention (NM); b) , positive (P); c) , strong (S); d) , very strong (VS). The detail please refer to Lü et al. (2017a).
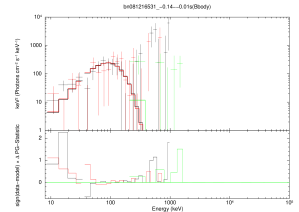
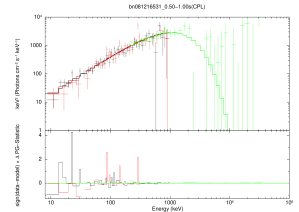
The time-averaged spectra are extracted and analyzed for the precursors and main bursts. As shown in the right columns of Figures 2 and 3, the best fitting results are plotted with a top label indicating the time interval and spectral model. For the SGRBs observed by only Fermi satellite, we used the data of two NaI and one BGO detectors to carry out a spectral fitting. For those observed by both Swift and Fermi, we used the data of BAT, one NaI, and one BGO (and LAT-LLE, if any). Note that GRB 090510 presents a very high energy LAT-LLE emission in main event, its spectral fitting requires a CPL with an extra PL model.
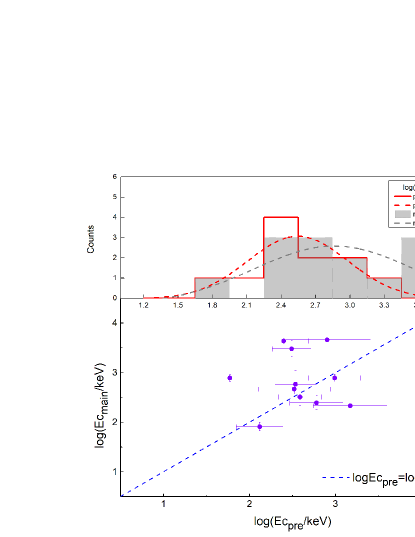
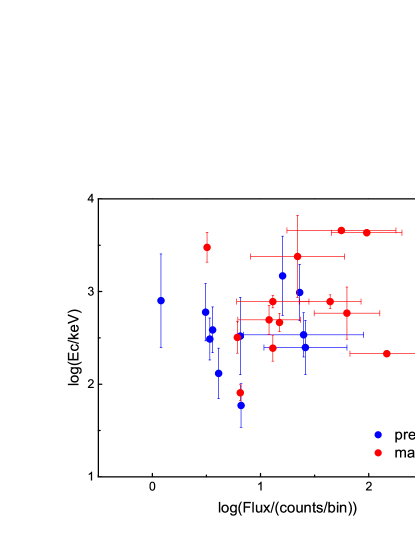
From the BIC analysis, the better fitting model CPL accounts for the spectra of all main bursts of those candidates observed by only Fermi and by both Swift and Fermi. For the precursors, a significant portion are suitable for fitting with also a CPL instead of a BB model, as covered in Table 2. To do a spectral comparison, we employed the cutoff energy to analyze the spectral feature of the precursors and main bursts. As illustrated in the left panel of Figure 6, the cutoff energy Gauss distributions are log for the precursors and log for the main bursts. On the whole, these distributions show that the main bursts are slightly spectrally harder with respect to the precursors. But for about a half of cases, the precursors are spectrally harder than their main bursts, as seen from the cutoff energy of the main bursts as a function of that of the corresponding precursors. In addition, there is no any significant relation for the cutoff energy between the precursors and the main bursts. These results are all consistent with those of HR comparison. Furthermore, we also investigated the potential correlation between the cutoff energy and the average flux for the precursors and main bursts but found no any correlation between them, revealed in the right panel of Figure 6.
4 Discussion
4.1 Precursor: a Cocoon Emission?
The spectral properties of precursors in LGRBs have been investigated by several systematic searches with BATSE (Koshut et al., 1995; Lazzati, 2005), Swift (Burlon et al., 2008; Hu et al., 2014), and Fermi observations (Lan et al., 2018). Some authors showed that the precursors are commonly non-thermal and also spectrally softer than their main bursts (Lazzati, 2005), while some other authors suggested that the spectra of precursors are neither systematically harder nor softer than the main ones (Burlon et al., 2008; Hu et al., 2014). For the sake of a wide energy range of Fermi data, we can also use the cutoff energy to assess the spectral features, besides the HR. The cutoff energy distributions of precursors and main bursts as well as their HR distributions indicate the slightly softer precursors with respect to the main ones. But there are a half of candidates that their precursors are spectrally harder than their corresponding main bursts, from both the comparisons of cutoff energy and HR between precursors and main bursts. Moreover, our results showed that a large portion of precursors have a non-thermal spectrum, analogous to their main bursts.
Theoretically, precursors in both LGRBs and SGRBs are difficult to interpret within the standard fireball scenario because of the requirement that at least the main burst duration is longer than the quiescent time (Lazzati, 2005; Troja et al., 2010), in striking contrast to our results in Figure 4 and Table 1. Other explanations for precursors in LGRBs are associated with the collapsar scenario (Ramirez-Ruiz et al., 2002; Lazzati & Begelman, 2005). Among them, even the seemingly most plausible cocoon emission model might not be suitable for the precursors in our SGRB sample. On one hand, the burst SGRB 170817A produced from the merger of NS-NS is very possibly involved to the off-axis structured jet rather than the jet-cocoon geometry due to the afterglow observations (Troja et al., 2018), the polarization measurements and/or imaging about its source (Mooley et al., 2018; Gill & Granot, 2018), and especially the recent high resolution measurements of the source size and position (Ghirlanda et al., 2019). Hence, the emergence of the cocoon that produces the precursor emission, stemmed from the merger of NS-NS, maybe encounter a challenge. On the other hand, the cocoon emission is widely believed to be associated with a nearly thermal spectrum (Lazzati et al., 2017; Nakar & Piran, 2017; De Colle et al., 2018), cannot account for a large fraction of precursors with a non-thermal spectral feature in our sample.
4.2 Precursor: Magnetospheric Interaction or Tidal Crust Cracking?
If the precursor emission in SGRBs comes from the interactions of inspiral binary compact stars (NS-NS or NS-BH) at the final stage prior to coalescence, such as the magnetospheric interaction (Vietri, 1996; Hansen & Lyutikov, 2001; McWilliams & Levin, 2011; Palenzuela et al., 2013; Wang et al., 2018) or the tidal crust cracking (Troja et al., 2010; Tsang et al., 2012), the precursor might provide a probe for the nature of progenitors of SGRBs. The NS in binary compact stars is usually magnetized strongly, a strong voltage and accelerated charged particles would be induced when the company NS or BH crosses its dipole magnetic field (see a review Fernández & Metzger, 2016). The accelerated particles would produce observable electromagnetic emission in X-ray/-ray bands. Under the magnetosphere inflation condition in which the toroidal magnetic field induced by the current becomes comparable to that of the original poloidal dipole field, we can estimate the maximum energy release as the orbit decays to separation with equation (Contopoulos et al., 1999; Lai, 2012; Fernández & Metzger, 2016),
| (3) |
where and are the surface equatorial dipole field of a magnetized NS and its radius, respectively. In our sample, only GRBs 060502B and 090510 have a redshift measure. Adopting the precursor duration 0.04 s and its average flux integrated over the whole energy range in the CPL fitting model , we can calculate its fluence and thus the total radiation energy erg for GRB 090510. As for GRB 060502B, its precursor average flux 0.15 in the 15 - 150 keV energy band and duration 0.1 s from the BBlocks results, we can calculate its fluence with an assumed Band function (Band et al., 1993) and -correction. We used a PL model to fit the spectrum of precursor in the energy band 15-150 keV and obtained the low-energy photon spectral index and the spectral peak energy keV of spectrum (see an empirical relation in Zhang et al., 2007). Moreover, we assumed a typical high-energy photon spectral index . We can finally estimate its total precursor energy erg. Therefore, assuming the separation up to the point of merger , we can constrain the magnetic field strength of the magnetized NS in progenitor, with an extremely strong magnetar-like magnetic field G for GRB 090510 and a normally strong radio pulsar magnetic field G for GRB 060502B. Further, Fernández & Metzger (2016) also estimated the precursor characteristic duration is approximately 1-10 ms based on the maximum released energy and the Poynting luminosity of the rotating magnetized NS in compact binary, which is basically consistent with the precursor duration distribution in our sample. This supports the magnetospheric interaction origin of precursor in SGRBs.
If the precursor is associated with the tidal crust cracking without resonant excitation of modes, ascribing to the tidal distortion, the duration of tidal grinding prior to the merger would be (Troja et al., 2010)
| (4) |
where , , , and are the NS’s ellipticity, mass, radius, and the binary mass ratio, respectively. Assuming the precursor arises simultaneously when the first crust cracking occurs, the duration can be equal to the sum of the precursor duration and the quiescent time, written by (ignoring the cosmological redshift here)
| (5) |
Supposing the typical values (Owen, 2005), , and , one would obtain the binary mass ratio as large as from the duration distribution s. Obviously, this is unreasonable. Hence, at least the precursors in our sample are unlikely to arise from the tidal crust cracking without resonant excitation of modes. Based on Tsang et al. (2012) instead, the resonant shattering in NS crust might explain our results. From the range of the duration , we can see that NS disfavors the crustal equations of state such as GS and RS (Friedrich & Reinhard, 1986; Steiner & Watts, 2009) for chirp masses of 1.0-4.5 according to Fig. 2 in Tsang et al. (2012).
5 Conclusions
We have performed a comprehensive search for the candidate SGRBs with precursors from nearly 120 Swift and 540 Fermi SGRBs through the BBlocks technique. 18 SGRBs observed by Swift and/or Fermi satellites that satisfy the precursor criteria have been selected. By analyzing their temporal profiles, we determined the durations of their precursors, main bursts, and quiescent times, studied their distributions, and sought the possible relations among them. We used HR to analyzed the spectral feature of the precursors and their main bursts. Moreover, we also adopted CPL, and BB models to fit the spectra of precursors and main bursts, and investigated their spectral properties. Via the BIC method, we further compared the fitting goodness between CPL and BB modelling the spectra of precursors and main bursts. Finally, we explored the origin of precursors in SGRBs and their possible probes for the progenitors. The meaningful results we acquired are as follows:
-
•
The precursor durations have a distribution log, being shorter than the main burst log and the quiescent time log. Besides, the quiescent times are comparable to the main burst durations. For the whole sample, the precursor durations, main burst durations, and quiescent times span the ranges 0.01-0.6 s, 0.08-2.39 s, and 0.13-3.65 s. More specifically, for a major part of cases, their precursor durations are shorter than their main bursts. Moreover, there seem to be no any relations among the quiescent time, the precursor duration, and the main burst duration. Additionally, the average flux of precursors tends to increase as the main bursts brighten, with loglog, suggesting a weak positive relation in the average flux between the precursors and their main bursts.
-
•
The spectral feature HR distributions are log for the precursors and log for the main bursts, indicating the main bursts are slightly harder than the precursors. Nevertheless, we can also see that a half of precursors occupy the region . In addition, the spectral fitting results by CPL and BB models for those candidates observed by Fermi indicate that a large portion of precursors and all main bursts favor a non-thermal spectrum. Another spectral quantity cutoff energy in CPL fitting distribute as log for the precursors and log for the main bursts. This also shows that the main bursts are slightly spectrally harder than the precursors. But for about a half of these candidates, their precursors are spectrally harder than their main bursts. It is consistent with the result of HR comparison.
-
•
If the precursor emerges in the post-merger phase, it might originate from the cocoon emission rather than a fireball becoming optically thin, as the quiescent time is longer than the corresponding main burst duration for more than a half of candidates. Whereas the cocoon emission is usually believed to be related to a thermal spectrum, a significant portion of precursors favoring a non-thermal spectrum in our sample would challenge this interpretation. On the other hand, the emergence of the cocoon resulting from the merger of binary NSs may also encounter a challenge since the jet-cocoon origin of SGRB 170817A could be excluded from the recent observations (Ghirlanda et al., 2019).
-
•
If the precursor occurs prior to the merger, it is likely associated with the magnetospheric interaction or the tidal crust cracking with resonant excitation of modes. In the case of magnetospheric interaction, the precursor can be used to constrain the surface equatorial dipole field of magnetized NS in progenitor. For GRBs 090510 and 060502B with a redshift measure, their magnetized NSs in progenitors reach to a magnetar-like magnetic field G and a radio pulsar magnetic field G, respectively. Under the condition that the precursor is related to the tidal crust cracking with resonant excitation of modes, we can see that NS disfavors the crustal equations of state such as GS and RS from the duration of tidal grinding prior to the merger with only several seconds (Tsang et al., 2012).
Under the condition of lacking the gravitational wave observations, the identification of progenitors (NS-NS or NS-BH) in SGRBs is usually difficult to be done through the electromagnetic observations post merger phase, although some electromagnetic signatures may provide hints about the types of progenitors. One is the X-ray plateau followed by a sharp decay phase in some afterglows of SGRBs, generally believed to be due to a long-lasting magnetar originating from the merger of NS-NS (Troja et al., 2007; Rowlinson et al., 2013; Lü et al., 2015, 2017b; Xue et al., 2019), following the early suggestion (Dai & Lu, 1998a, b; Zhang & Mészáros, 2001; Dai, 2004). The other is the giant X-ray flare in afterglows of a few SGRBs, which is possibly caused by the merger of NS-NS (Dai et al., 2006) or NS-BH (Mu et al., 2018). The precursor in SGRBs, if it is indeed associated with the progenitor and seen to be in difference between NS-NS and NS-BH mergers, could be a new pre-merger probe for the identification of progenitors, with the sample extension of SGRBs with precursor benefiting from more future observations by Fermi and SVOM satellites (Paul et al., 2011). Furthermore, Hansen & Lyutikov (2001) and Wang et al. (2016) pointed out the precursors in SGRBs are likely associated with the radio emissions like fast radio bursts (FRBs), so we collected FRBs from the catalog555http://www.frbcat.org (Petroff et al., 2016) updated to date and found no any position consistency between these FRBs and precursors in these SGRBs.
References
- Abbott et al. (2017) Abbott, B. P., Abbott, R., Abbott, T. D., et al. 2017, Physical Review Letters, 119, 161101
- Atwood et al. (2009) Atwood, W. B., Abdo, A. A., Ackermann, M., et al. 2009, ApJ, 697, 1071
- Band et al. (1993) Band, D., Matteson, J., Ford, L., et al. 1993, ApJ, 413, 281
- Berger (2011) Berger, E. 2011, NewAR, 55, 1
- Bloom et al. (2002) Bloom, J. S., Kulkarni, S. R., & Djorgovski, S. G. 2002, AJ, 123, 1111
- Burlon et al. (2008) Burlon, D., Ghirlanda, G., Ghisellini, G., et al. 2008, ApJ, 685, L19
- Cash (1979) Cash, W. 1979, ApJ, 228, 939
- Contopoulos et al. (1999) Contopoulos, I., Kazanas, D., & Fendt, C. 1999, ApJ, 511, 351
- Dai (2004) Dai, Z. G. 2004, ApJ, 606, 1000
- Dai & Lu (1998a) Dai, Z. G., & Lu, T. 1998a, A&A, 333, L87
- Dai & Lu (1998b) Dai, Z. G., & Lu, T. 1998b, Phys. Rev. Lett., 81, 4301
- Dai et al. (2006) Dai, Z. G., Wang, X. Y., Wu, X. F., & Zhang, B. 2006, Science, 311, 1127
- De Colle et al. (2018) De Colle, F., Lu, W., Kumar, P., Ramirez-Ruiz, E., & Smoot, G. 2018, MNRAS, 478, 4553
- Eichler et al. (1989) Eichler, D., Livio, M., Piran, T., & Schramm, D. N. 1989, Nature, 340, 126
- Fernández & Metzger (2016) Fernández, R., & Metzger, B. D. 2016, Annual Review of Nuclear and Particle Science, 66, 23
- Friedrich & Reinhard (1986) Friedrich, J., & Reinhard, P.-G. 1986, Phys. Rev. C, 33, 335
- Galama et al. (1998) Galama, T. J., Vreeswijk, P. M., van Paradijs, J., et al. 1998, Nature, 395, 670
- Ghirlanda et al. (2019) Ghirlanda, G., Salafia, O. S., Paragi, Z., et al. 2019, Science, 363, 968
- Gill & Granot (2018) Gill, R., & Granot, J. 2018, MNRAS, 478, 4128
- Hansen & Lyutikov (2001) Hansen, B. M. S., & Lyutikov, M. 2001, MNRAS, 322, 695
- Hjorth et al. (2003) Hjorth, J., Sollerman, J., Møller, P., et al. 2003, Nature, 423, 847
- Hu et al. (2014) Hu, Y.-D., Liang, E.-W., Xi, S.-Q., et al. 2014, ApJ, 789, 145
- Klose et al. (2004) Klose, S., Greiner, J., Rau, A., et al. 2004, AJ, 128, 1942
- Koshut et al. (1995) Koshut, T. M., Kouveliotou, C., Paciesas, W. S., et al. 1995, ApJ, 452, 145
- Kouveliotou et al. (1993) Kouveliotou, C., Meegan, C. A., Fishman, G. J., et al. 1993, ApJ, 413, L101
- Lü et al. (2015) Lü, H.-J., Zhang, B., Lei, W.-H., et al. 2015, ApJ, 805, 89
- Lü et al. (2017a) Lü, H.-J., Lü, J., Zhong, S.-Q., et al. 2017a, ApJ, 849, 71
- Lü et al. (2017b) Lü, H.-J., Zhang, H.-M., Zhong, S.-Q., et al. 2017b, ApJ, 835, 181
- Lai (2012) Lai, D. 2012, ApJ, 757, L3
- Lan et al. (2018) Lan, L., Lü, H.-J., Zhong, S.-Q., et al. 2018, ApJ, 862, 155
- Lazzati (2005) Lazzati, D. 2005, MNRAS, 357, 722
- Lazzati & Begelman (2005) Lazzati, D., & Begelman, M. C. 2005, ApJ, 629, 903
- Lazzati et al. (2017) Lazzati, D., Deich, A., Morsony, B. J., & Workman, J. C. 2017, MNRAS, 471, 1652
- Lu et al. (2017) Lu, R.-J., Du, S.-S., Cheng, J.-G., et al. 2017, arXiv:1710.06979
- Mészáros et al. (2001) Mészáros, P., Ramirez-Ruiz, E., & Rees, M. J. 2001, ApJ, 554, 660
- McWilliams & Levin (2011) McWilliams, S. T., & Levin, J. 2011, ApJ, 742, 90
- Meegan et al. (2009) Meegan, C., Lichti, G., Bhat, P. N., et al. 2009, ApJ, 702, 791
- Minaev & Pozanenko (2017) Minaev, P. Y., & Pozanenko, A. S. 2017, Astronomy Letters, 43, 1
- Mooley et al. (2018) Mooley, K. P., Deller, A. T., Gottlieb, O., et al. 2018, Nature, 561, 355
- Mu et al. (2018) Mu, H.-J., Gu, W.-M., Mao, J., et al. 2018, ApJ, 858, 34
- Murakami et al. (1991) Murakami, T., Inoue, H., Nishimura, J., van Paradijs, J., & Fenimore, E. E. 1991, Nature, 350, 592
- Nakar & Piran (2017) Nakar, E., & Piran, T. 2017, ApJ, 834, 28
- Owen (2005) Owen, B. J. 2005, Physical Review Letters, 95, 211101
- Paczynski (1986) Paczynski, B. 1986, ApJ, 308, L43
- Paczynski (1991) Paczynski, B. 1991, AcA, 41, 257
- Paczyński (1998) Paczyński, B. 1998, ApJ, 494, L45
- Palenzuela et al. (2013) Palenzuela, C., Lehner, L., Ponce, M., et al. 2013, Physical Review Letters, 111, 061105
- Paul et al. (2011) Paul, J., Wei, J., Basa, S., & Zhang, S.-N. 2011, Comptes Rendus Physique, 12, 298
- Petroff et al. (2016) Petroff, E., Barr, E. D., Jameson, A., et al. 2016, PASA, 33, e045
- Ramirez-Ruiz et al. (2002) Ramirez-Ruiz, E., Celotti, A., & Rees, M. J. 2002, MNRAS, 337, 1349
- Rowlinson et al. (2013) Rowlinson, A., O’Brien, P. T., Metzger, B. D., Tanvir, N. R., & Levan, A. J. 2013, MNRAS, 430, 1061
- Scargle et al. (2013) Scargle, J. D., Norris, J. P., Jackson, B., & Chiang, J. 2013, ApJ, 764, 167
- Steiner & Watts (2009) Steiner, A. W., & Watts, A. L. 2009, Physical Review Letters, 103, 181101
- Troja et al. (2007) Troja, E., Cusumano, G., O’Brien, P. T., et al. 2007, ApJ, 665, 599
- Troja et al. (2018) Troja, E., Piro, L., Ryan, G., et al. 2018, MNRAS, 478, L18
- Troja et al. (2010) Troja, E., Rosswog, S., & Gehrels, N. 2010, ApJ, 723, 1711
- Tsang et al. (2012) Tsang, D., Read, J. S., Hinderer, T., Piro, A. L., & Bondarescu, R. 2012, Physical Review Letters, 108, 011102
- Vietri (1996) Vietri, M. 1996, ApJ, 471, L95
- von Kienlin et al. (2019) von Kienlin, A., Veres, P., Roberts, O. J., et al. 2019, ApJ, 876, 89
- Wang et al. (2016) Wang, J. S., Yang, Y. P., Wu, X. F., Dai, Z. G., & Wang, F. Y. 2016, ApJ, 822, L7
- Wang et al. (2018) Wang, J.-S., Peng, F.-K., Wu, K., et al. 2018, ApJ, 868, 19
- Waxman & Mészáros (2003) Waxman, E., & Mészáros, P. 2003, ApJ, 584, 390
- Woosley (1993) Woosley, S. E. 1993, ApJ, 405, 273
- Xue et al. (2019) Xue, Y. Q., Zheng, X. C., Li, Y., et al. 2019, Nature, 568, 198
- Zhang et al. (2018) Zhang, B.-B., Zhang, B., Sun, H., et al. 2018, Nature Communications, 9, 447
- Zhang & Mészáros (2001) Zhang, B., & Mészáros, P. 2001, ApJ, 552, L35
- Zhang et al. (2007) Zhang, B., Zhang, B.-B., Liang, E.-W., et al. 2007, ApJ, 655, L25
- Zhang et al. (2003) Zhang, W., Woosley, S. E., & MacFadyen, A. I. 2003, ApJ, 586, 356
| GRBa | z | Presursorb | c | d | Main Burstb | c | d | e | Significancef |
|---|---|---|---|---|---|---|---|---|---|
| (s) | (counts/bin) | (s) | (counts/bin) | (s) | () | ||||
| Swift (catalog ) | |||||||||
| 060502B (catalog ) | 0.287 | -0.45-0.36 | 20 | 0.380.38 | -0.040.20 | 5951 | 1.202.19 | 0.32 | 6.1 |
| 071112B (catalog ) | -0.60-0.59 | 14 | 2.63 | 0.000.27 | 2413 | 1.281.40 | 0.59 | 1.9 | |
| 080702A (catalog ) | -0.56-0.25 | 8 | 0.80 | -0.120.52 | 1512 | 0.621.07 | 0.13 | 3.3 | |
| 100213A (catalog ) | 0.050.49 | 4239 | 0.491.09 | 1.172.21 | 2616 | 0.951.17 | 0.68 | 11.1 | |
| 100702A (catalog ) | -0.27-0.23 | 27 | 0.31 | 0.000.21 | 5725 | 0.670.64 | 0.23 | 4.8 | |
| Swift+Fermi (catalog ) | |||||||||
| 081024A (catalog ) | -1.65-1.59 | 366 | 1.370.19 | -0.680.26 | 2222 | 0.981.80 | 0.91 | 6.7 | |
| 090510 (catalog ) | 0.903 | -0.55-0.51 | 2623 | 1.341.67 | -0.110.45 | 9672 | 1.492.54 | 0.40 | 4.9 |
| 140209A (catalog ) | 0.120.57 | 16 | 0.43 | 1.634.02 | 147115 | 1.282.15 | 1.06 | 13.9 | |
| 160408A (catalog ) | -0.94-0.87 | 0.8 | 0.31 | -0.330.41 | 128 | 0.590.71 | 0.55 | 5.2 | |
| 160726A (catalog ) | 0.290.37 | 2532 | 0.601.55 | 0.761.08 | 6344 | 1.001.71 | 0.39 | 10.2 | |
| 180402A (catalog ) | -0.20-0.17 | 23 | 3.61 | 0.050.29 | 4429 | 2.231.45 | 0.22 | 2.5 | |
| Fermi (catalog ) | |||||||||
| 081216531 (catalog ) | -0.14-0.01 | 6.6 | 0.96 | 0.501.00 | 1310 | 2.453.34 | 0.51 | … | |
| 100717372 (catalog ) | -0.140.01 | 3.4 | 5.15 | 3.334.56 | 3.2 | 3.55 | 3.32 | … | |
| 100827455 (catalog ) | -0.06-0.01 | 6.5 | 4.85 | 0.390.51 | 15 | 3.95 | 0.40 | … | |
| 130310840 (catalog ) | -0.180.40 | 1.2 | 52.59 | 4.056.20 | 5665 | 1.102.61 | 3.65 | … | |
| 160818198 (catalog ) | -0.420.18 | 4.1 | 0.61 | 2.584.05 | 6.5 | 0.640.76 | 2.40 | … | |
| 170709334 (catalog ) | -0.150.27 | 3.1 | 3.44 | 0.670.75 | 13 | 4.02 | 0.40 | … | |
| 170726794 (catalog ) | -0.180.10 | 3.6 | 2.76 | 1.631.88 | 6.1 | 1.87 | 1.53 | … |
| GRB | precursor | main burst | ||||||||||||
|---|---|---|---|---|---|---|---|---|---|---|---|---|---|---|
| Swift+Fermi (catalog ) | (keV) | (keV) | BIC-selected modela | (keV) | (keV) | BIC-selected model | ||||||||
| 081024A (catalog ) | … | … | … | … | … | … | … | 339/294 | 378/295 | -33 | CPL(VS) | |||
| 090510 (catalog ) | 232/342 | 239/343 | -1 | CPL(NM) | 296/369 | 509/370 | -207 | CPL+PL(VS) | ||||||
| 140209A (catalog ) | 300/296 | 337/297 | -31 | CPL(VS) | 434/296 | 2679/297 | -2239 | CPL(VS) | ||||||
| 160408A (catalog ) | … | … | … | … | … | … | … | 327/298 | 405/299 | -27 | CPL(VS) | |||
| 160726A (catalog ) | 276/297 | 309/298 | -27 | CPL(VS) | 269/297 | 461/298 | -186 | CPL(VS) | ||||||
| 180402A (catalog ) | 247/296 | 248/297 | -17 | CPL(VS) | 299/296 | 401/297 | -90 | CPL(VS) | ||||||
| Fermi (catalog ) | ||||||||||||||
| 081216531 (catalog ) | 339/357 | 342/358 | 3 | BB(P) | 407/357 | 664/358 | -251 | CPL(VS) | ||||||
| 100717372 (catalog ) | 361/356 | 367/357 | 0 | CPL(NM) | 360/356 | 448/357 | -82 | CPL(VS) | ||||||
| 100827455 (catalog ) | 329/358 | 339/359 | -4 | CPL(P) | 331/358 | 401/359 | -64 | CPL(VS) | ||||||
| 130310840 (catalog ) | 395/358 | 405/359 | -4 | CPL(P) | 359/283 | 2203/284 | -1838 | CPL(VS) | ||||||
| 160818198 (catalog ) | 390/358 | 422/359 | -26 | CPL(VS) | 411/358 | 559/359 | -142 | CPL(VS) | ||||||
| 170709334 (catalog ) | 373/355 | 385/356 | -6 | CPL(P) | 315/355 | 328/356 | -7 | CPL(P) | ||||||
| 170726794 (catalog ) | 350/356 | 358/357 | -2 | CPL(NM) | 381/356 | 409/357 | -22 | CPL(VS) |
![[Uncaptioned image]](/html/1909.00577/assets/x5.png)
Fig.1—continued.
 |
|
 |
![[Uncaptioned image]](/html/1909.00577/assets/x8.png) |
|
|---|---|
![[Uncaptioned image]](/html/1909.00577/assets/x9.png) |
|
![[Uncaptioned image]](/html/1909.00577/assets/x10.png) |
Fig.2—continued.
![[Uncaptioned image]](/html/1909.00577/assets/x11.png) |
|
|---|---|
![[Uncaptioned image]](/html/1909.00577/assets/x12.png) |
|
![[Uncaptioned image]](/html/1909.00577/assets/x13.png) |
Fig.2—continued.
![[Uncaptioned image]](/html/1909.00577/assets/x14.png) |
|
![[Uncaptioned image]](/html/1909.00577/assets/x15.png) |
Fig.2—continued.
![[Uncaptioned image]](/html/1909.00577/assets/x16.png) |
|
|---|---|
![[Uncaptioned image]](/html/1909.00577/assets/x17.png) |
|
![[Uncaptioned image]](/html/1909.00577/assets/x18.png) |
Fig.2—continued.
![[Uncaptioned image]](/html/1909.00577/assets/x19.png) |
|
|---|---|
![[Uncaptioned image]](/html/1909.00577/assets/x20.png) |
|
![[Uncaptioned image]](/html/1909.00577/assets/x21.png) |
Fig.2—continued.
 |
|
|---|---|
 |
|
 |
![[Uncaptioned image]](/html/1909.00577/assets/x25.png) |
|
|---|---|
![[Uncaptioned image]](/html/1909.00577/assets/x26.png) |
|
![[Uncaptioned image]](/html/1909.00577/assets/x27.png) |
Fig.3—continued.
![[Uncaptioned image]](/html/1909.00577/assets/x28.png) |
|
|---|---|
![[Uncaptioned image]](/html/1909.00577/assets/x29.png) |
|
![[Uncaptioned image]](/html/1909.00577/assets/x30.png) |
Fig.3—continued.
![[Uncaptioned image]](/html/1909.00577/assets/x31.png) |
|
|---|---|
![[Uncaptioned image]](/html/1909.00577/assets/x32.png) |
|
![[Uncaptioned image]](/html/1909.00577/assets/x33.png) |
Fig.3—continued.
![[Uncaptioned image]](/html/1909.00577/assets/x34.png) |
|
|---|---|
![[Uncaptioned image]](/html/1909.00577/assets/x35.png) |
|
![[Uncaptioned image]](/html/1909.00577/assets/x36.png) |
Fig.3—continued.
![[Uncaptioned image]](/html/1909.00577/assets/x37.png) |
|
|---|---|
![[Uncaptioned image]](/html/1909.00577/assets/x38.png) |
|
![[Uncaptioned image]](/html/1909.00577/assets/x39.png) |
Fig.3—continued.
![[Uncaptioned image]](/html/1909.00577/assets/x40.png) |
|
|---|---|
![[Uncaptioned image]](/html/1909.00577/assets/x41.png) |
|
![[Uncaptioned image]](/html/1909.00577/assets/x42.png) |
Fig.3—continued.