Skyrmions and spirals in MnSi under hydrostatic pressure
Abstract
The archetype cubic chiral magnet MnSi is home to some of the most fascinating states in condensed matter such as skyrmions and a non-Fermi liquid behavior in conjunction with a topological Hall effect under hydrostatic pressure. Using small angle neutron scattering, we study the evolution of the helimagnetic, conical and skyrmionic correlations with increasing hydrostatic pressure. We show that the helical propagation vector smoothly reorients from to at intermediate pressures. At higher pressures, above the critical pressure, the long-range helimagnetic order disappears at zero magnetic field. Nevertheless, skyrmion lattices and conical spirals form under magnetic fields, in a part of the phase diagram where a topological Hall effect and a non-Fermi liquid behavior have been reported. These unexpected results shed light on the puzzling behavior of MnSi at high pressures and the mechanisms that destabilize the helimagnetic long-range order at the critical pressure.
I Introduction
A well-known route to discover new and exotic states of matter is by tweaking the magnetic interactions through chemical substitution or hydrostatic pressure. A prominent example is the archetype chiral cubic magnet MnSi that hosts some of the most peculiar states reported in condensed matter physics, such as skyrmion lattices Mühlbauer et al. (2009); Neubauer et al. (2009) and under hydrostatic pressure a non-Fermi liquid (NFL) phase Pfleiderer et al. (2001); Doiron-Leyraud et al. (2003). The NFL phase is characterized by a temperature dependence of the resistivity and emerges for 1.4 GPa without quantum criticality Pfleiderer et al. (2007). In addition, this phase is home to a sizable topological Hall effect (THE) Lee et al. (2009); Ritz et al. (2013a, b), a key characteristic of topological non-trivial magnetic order. For the long-range helimagnetic order at zero field is suppressed and a partial helimagnetic order has been reported Pfleiderer et al. (2004); Pintschovius et al. (2004), the nature of which and its relation to the NFL and THE signals remains an open question.
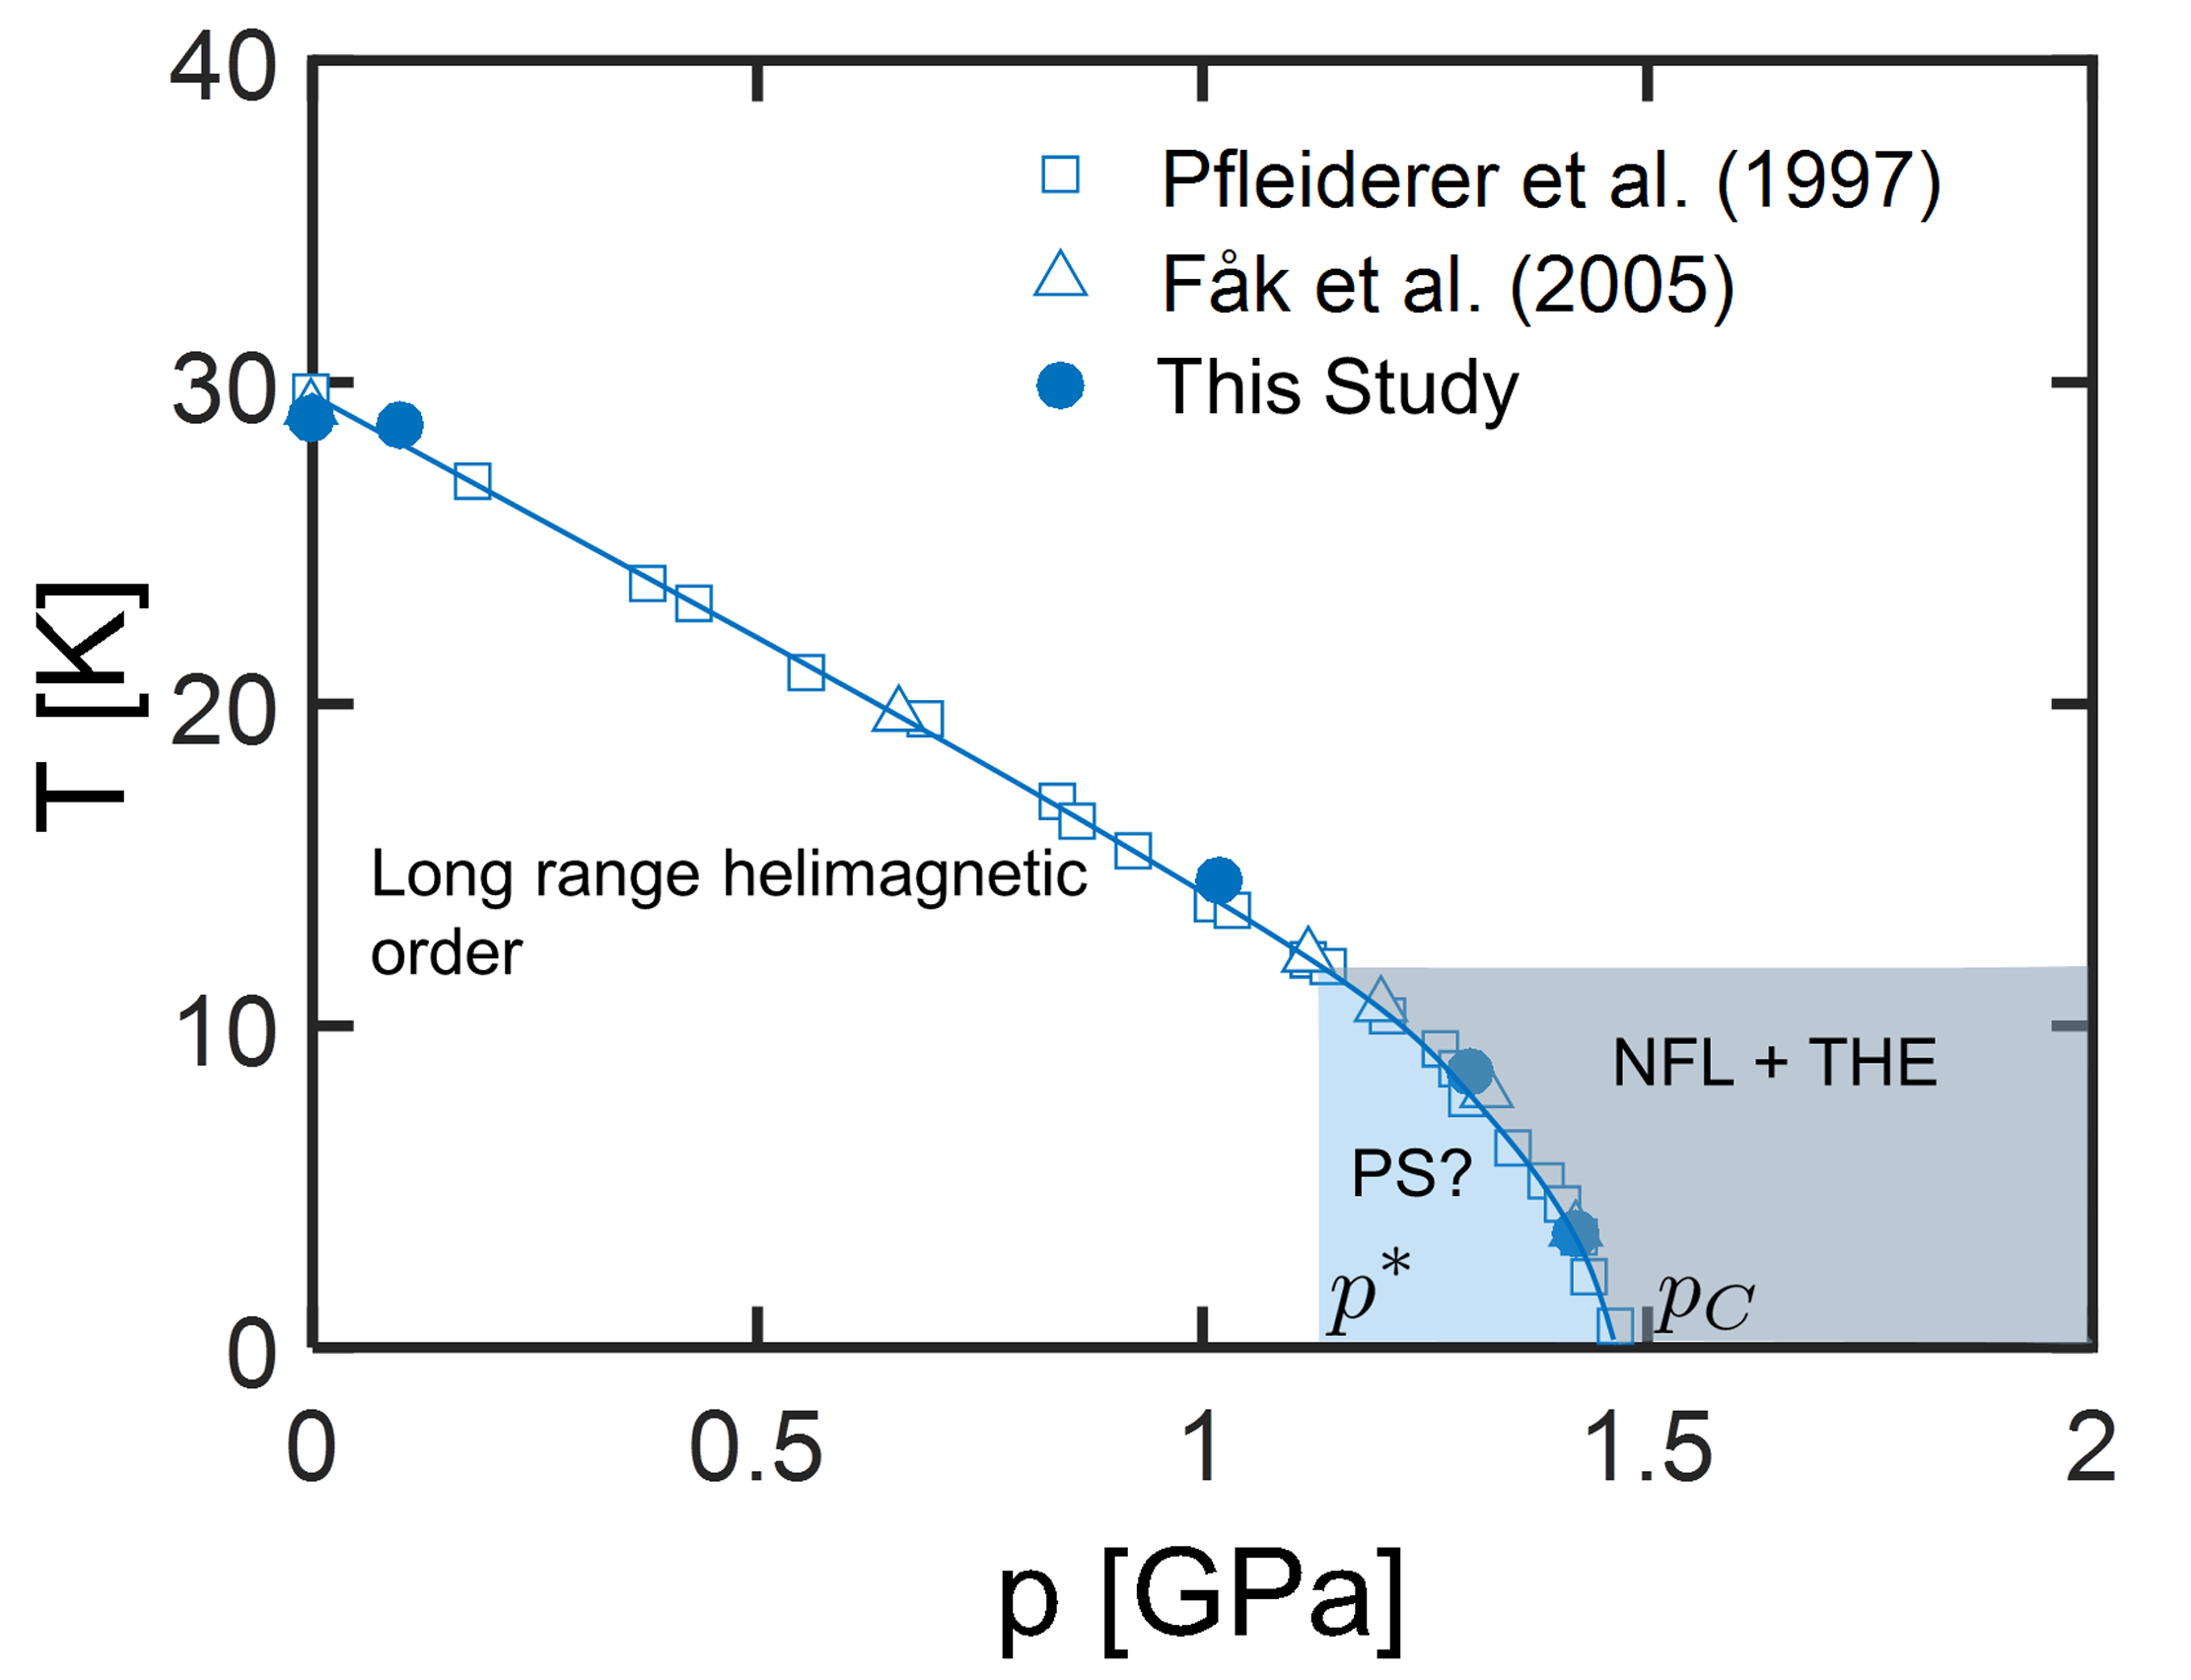
Substantial qualitative changes to the ground state of MnSi already occur at pressures lower than . The NFL and THE behavior for has been reported for 1.2 GPa, as illustrated by Fig. 1. Furthermore, there is controversy about whether the region of the phase diagram between and is characterized by phase separation between helimagnetic and paramagnetic volumes, Yu et al. (2004); Uemura et al. (2007), or not Andreica et al. (2010).
In this paper, we revisit the magnetic phase diagram of MnSi under hydrostatic pressure and elucidate the evolution of the helimagnetic correlations around and . For this reason, we performed small angle neutron scattering (SANS) experiments as a function of pressure and systematically applied the magnetic field both parallel and perpendicular to the incoming neutron beam, designated by its wavevector . In this way, we obtain a complete overview of the helimagnetic, conical and skyrmionic correlations that has not been provided by previous studies.
We find that at zero magnetic field the helical propagation vector reorients around from at low pressures to at high pressures. Furthermore, although the long-range helimagnetic order disappears for , a magnetic field induces long-range skyrmion lattices and conical spirals even for , in a region of the phase diagram governed by NFL and THE behavior. These unexpected results provide a strong indication that at high pressures the magnetic moment depends strongly on the strength of the magnetic field. Hydrostatic pressure would therefore soften the magnetic moment and consequently enhance the itinerant electron character of the magnetism of MnSi, an effect that could play a role in the destabilization of the helimagnetic long-range order at .
II Experimental
The SANS measurements were performed at the time-of-flight instrument Larmor of the ISIS Neutron Source and on a 110 mg single crystal of MnSi. These measurements were complemented by high resolution neutron spin echo (NSE) spectroscopy measurements at the IN15 spectrometer of the Institut Laue-Langevin. In both experiments, the sample was aligned with the [10] crystallographic direction vertical and positioned in the clamp type pressure cell described in Ref. Sadykov et al. (2018). More experimental details are provided in the Supplemental Material SI .
III Results and discussion
III.1 Zero Field
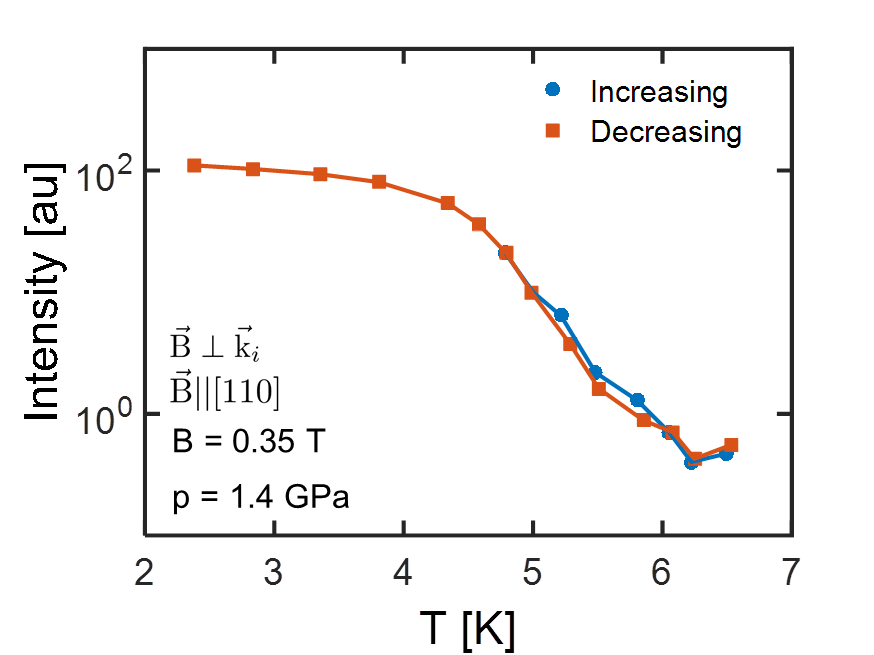
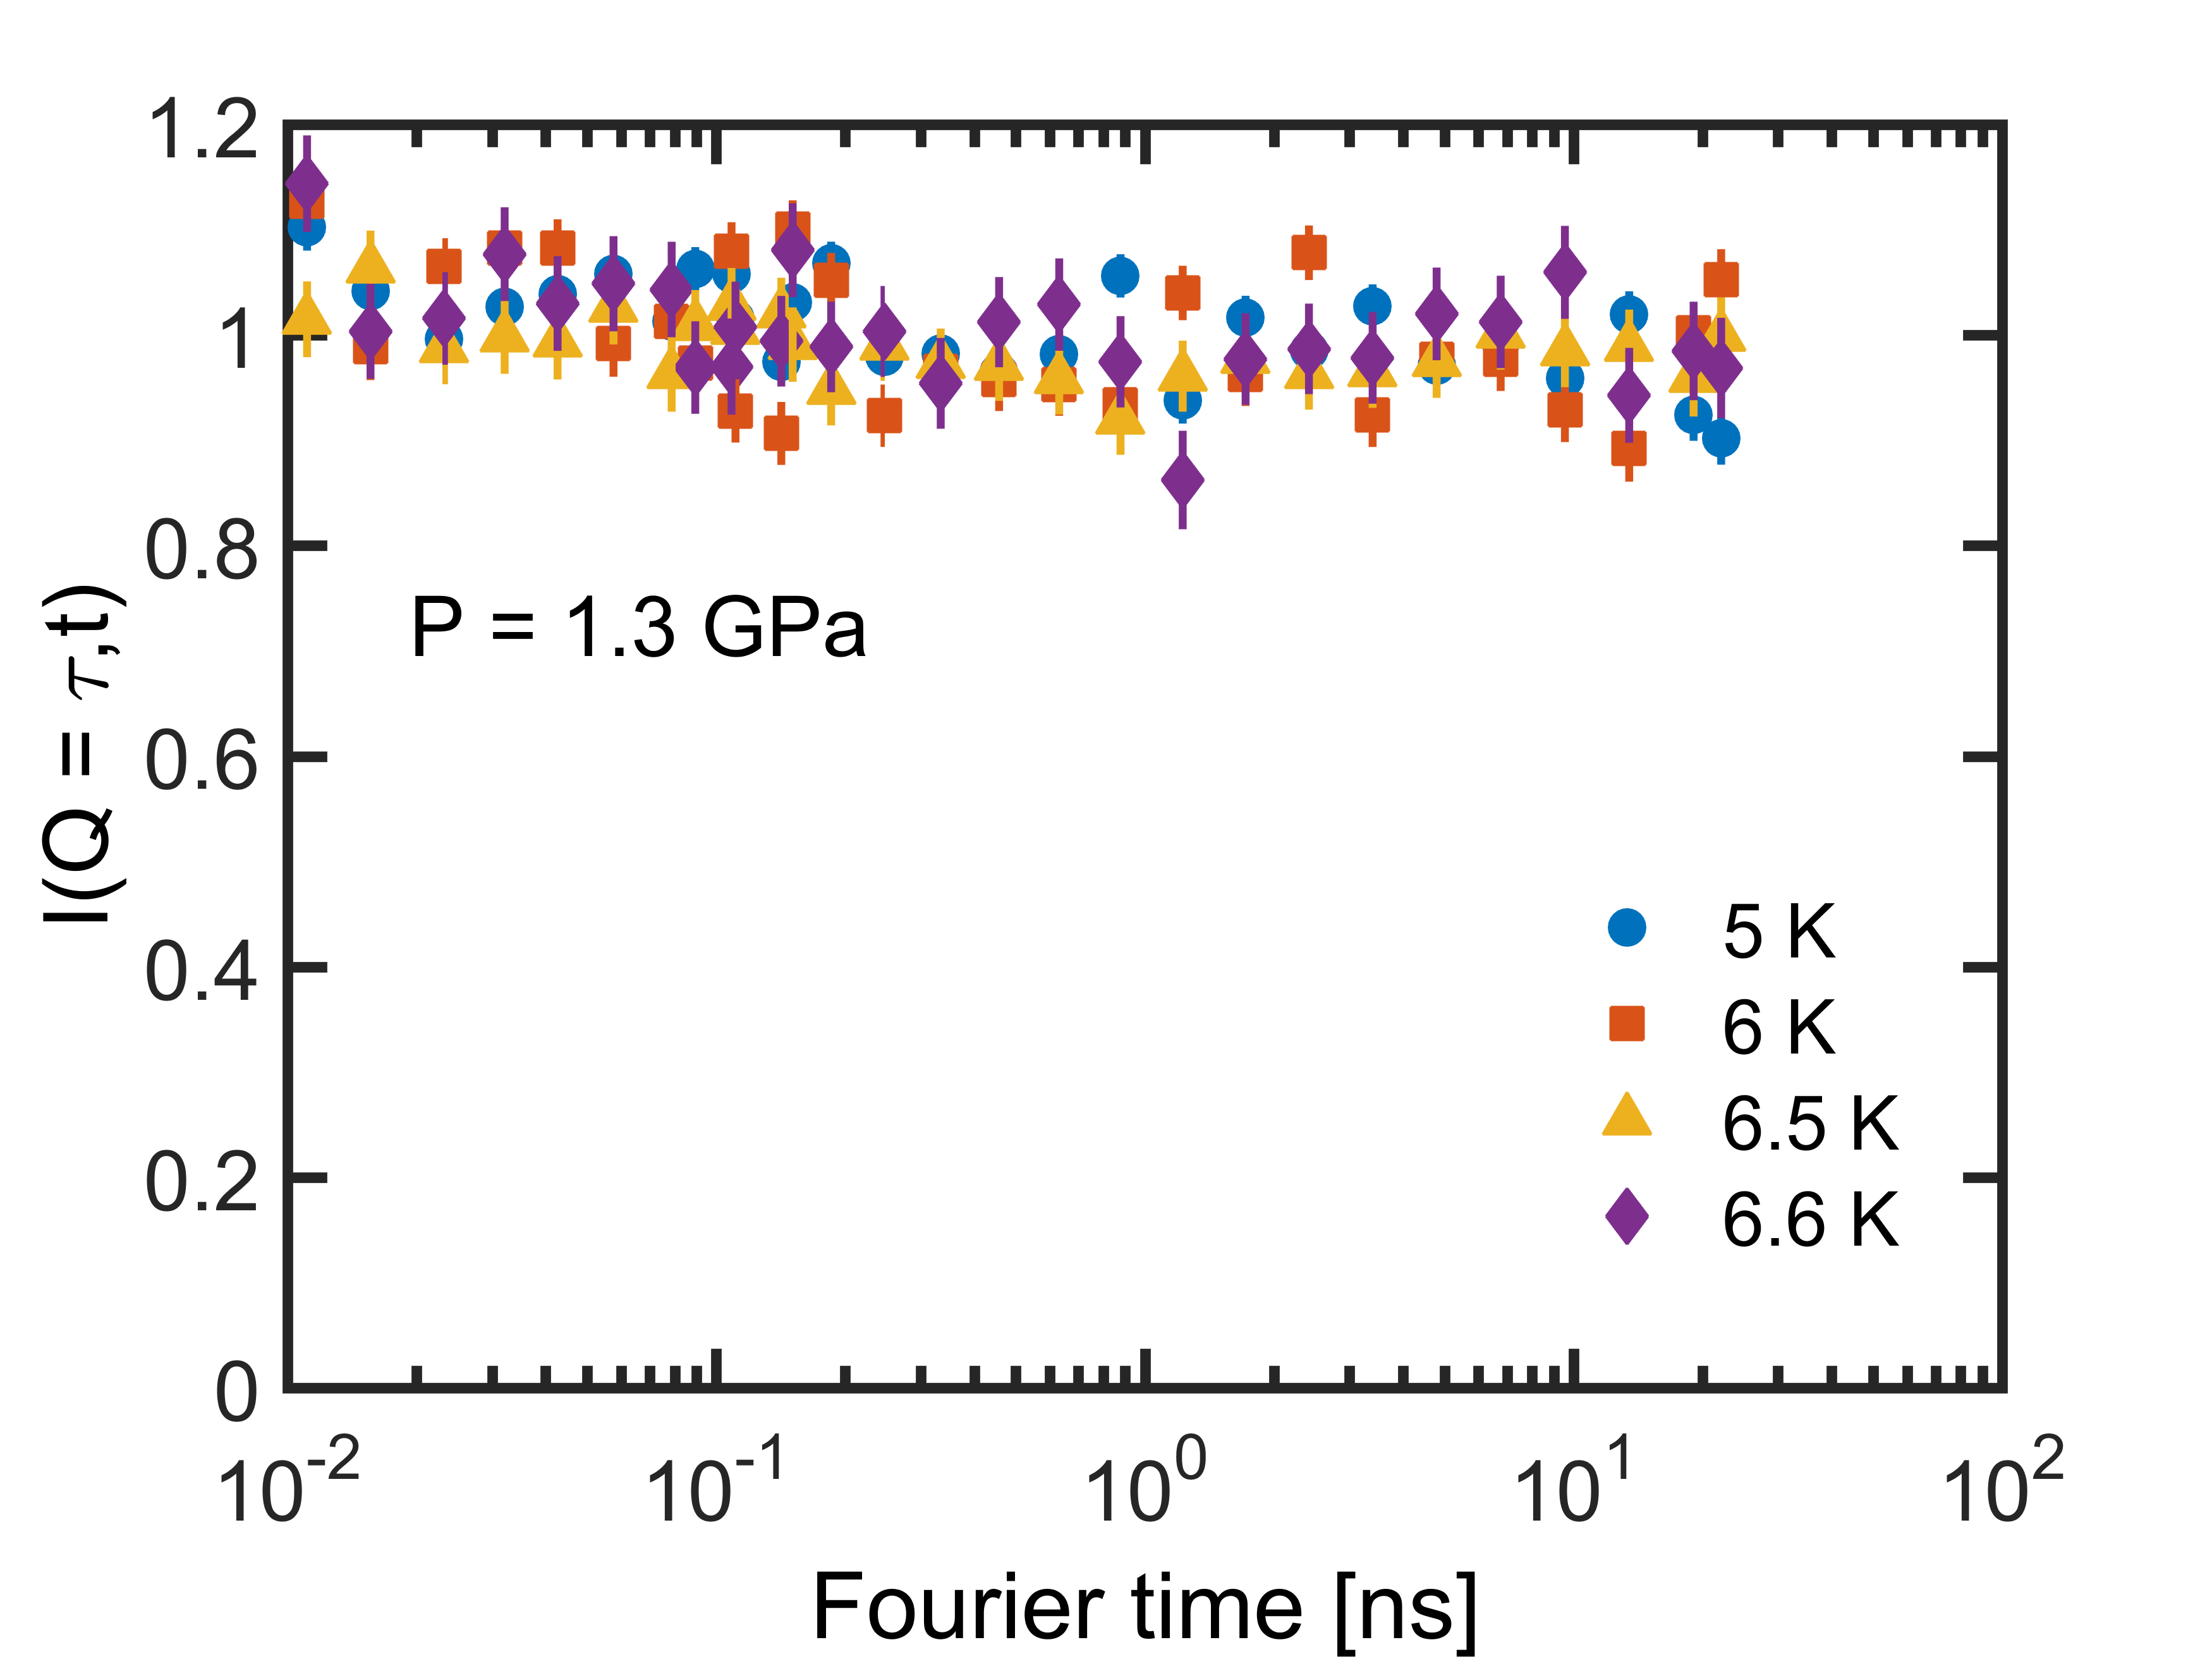
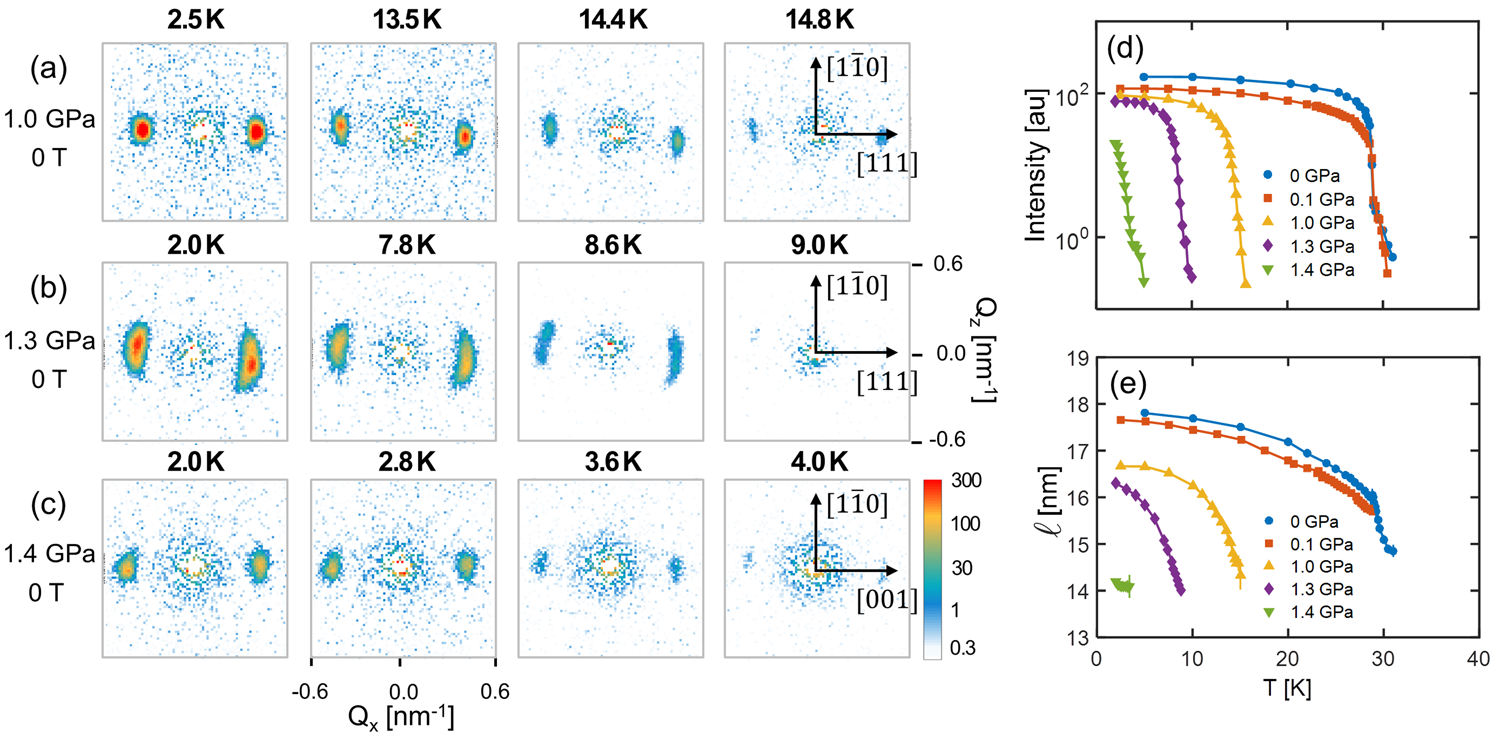
Figure 2(a)-(c) displays characteristic SANS patterns collected at zero magnetic field and for different temperatures and pressures. The patterns for = 1.0 GPa are very similar to the ones seen at zero pressure: below 14 K long-range helical order sets-in with . However, above , we do not observe the intense ring of scattering seen at ambient pressures, and which is characteristic of the isotropic, chiral and short-range helimagnetic correlations seen in the precursor phase Grigoriev et al. (2005); Pappas et al. (2009); Janoschek et al. (2013); Pappas et al. (2017); Bannenberg et al. (2017a). In addition, the temperature evolution of the total scattered intensity displayed in Fig. 2(d), obtained by summing the intensity over the entire SANS pattern, is different from that at lower pressures. For = 0 and 0.1 GPa there is a clear kink at , which is completely absent at higher pressures. Therefore, we conclude that this diffuse scattering weakens considerably with increasing pressure and at high pressures it does not exceed the background of the pressure cell. This substantial weakening of the diffuse scattering indicates a suppression of the precursor phase. This conclusion is supported by the NSE spectra presented in the supplement SI (Fig. S10), which under pressure do not show the fluctuations associated with the precursor phase but remain elastic on the nanoseconds timescale even for . This result is also consistent with the disappearance under pressure of the ‘shoulder’, characteristic of the precursor phase, observed slightly above in the temperature dependence of the resistivity and specific heat Petrova and Stishov (2012); Sidorov et al. (2014).
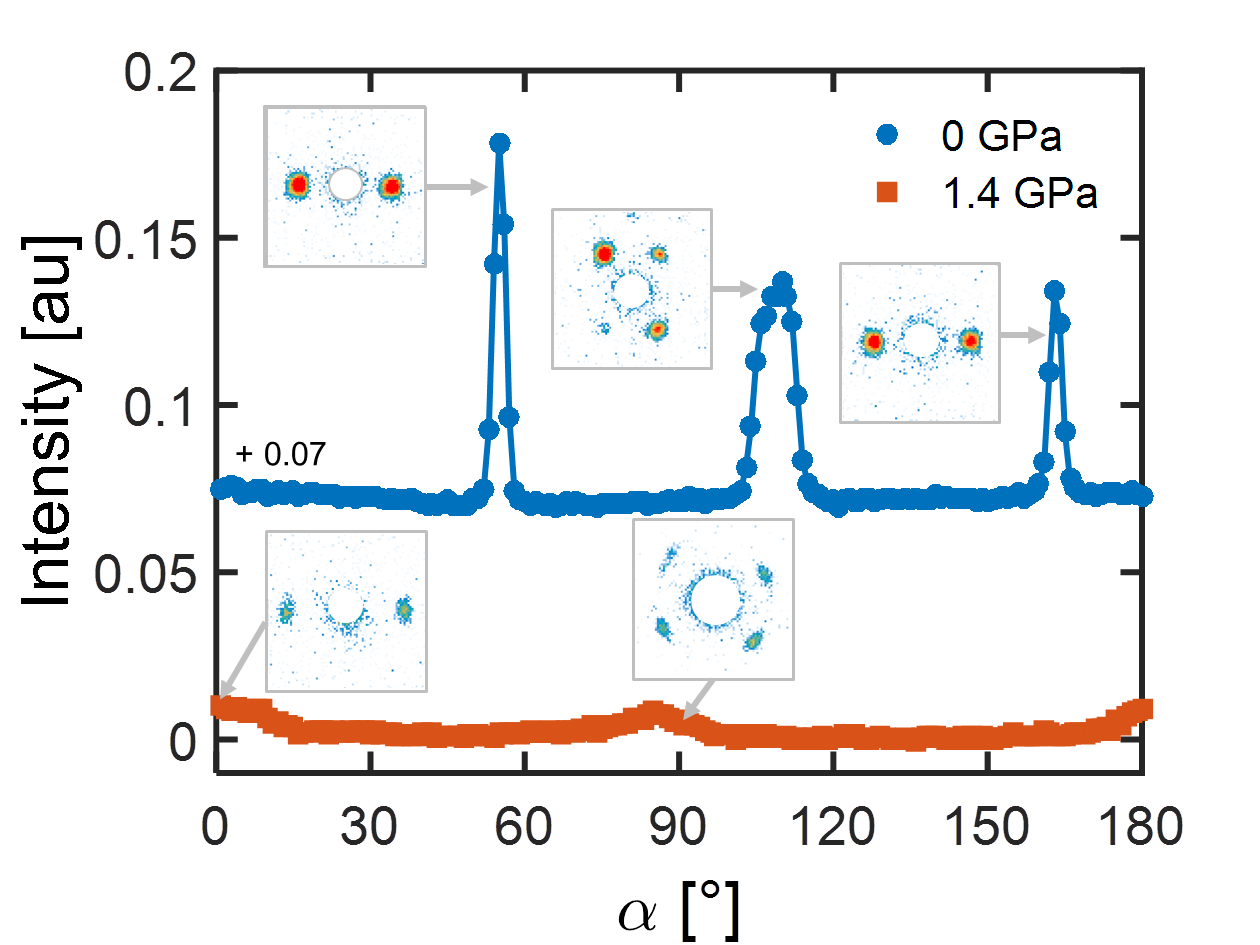
When the pressure reaches 1.3 GPa, the helical Bragg peaks broaden substantially [Fig. 2(b)], implying that the direction of is relatively ill-defined. Surprisingly, if the pressure is further increased to 1.4 GPa, the peaks become again as sharp as for lower pressures. However, the helices are no longer aligned along but along (see Fig. 2(c) and the rocking scans of Fig. S1). This unexpected and novel result reveals that the direction of crosses over around . This effect can be accounted for by the cubic anisotropy, , which has only minima at for 0 and for 0 Bak and Jensen (1980). Our results thus reveal that changes sign around , the region of the phase diagram where Larmor diffraction indicates an abrupt change of the spontaneous magnetostriction Pfleiderer et al. (2007).
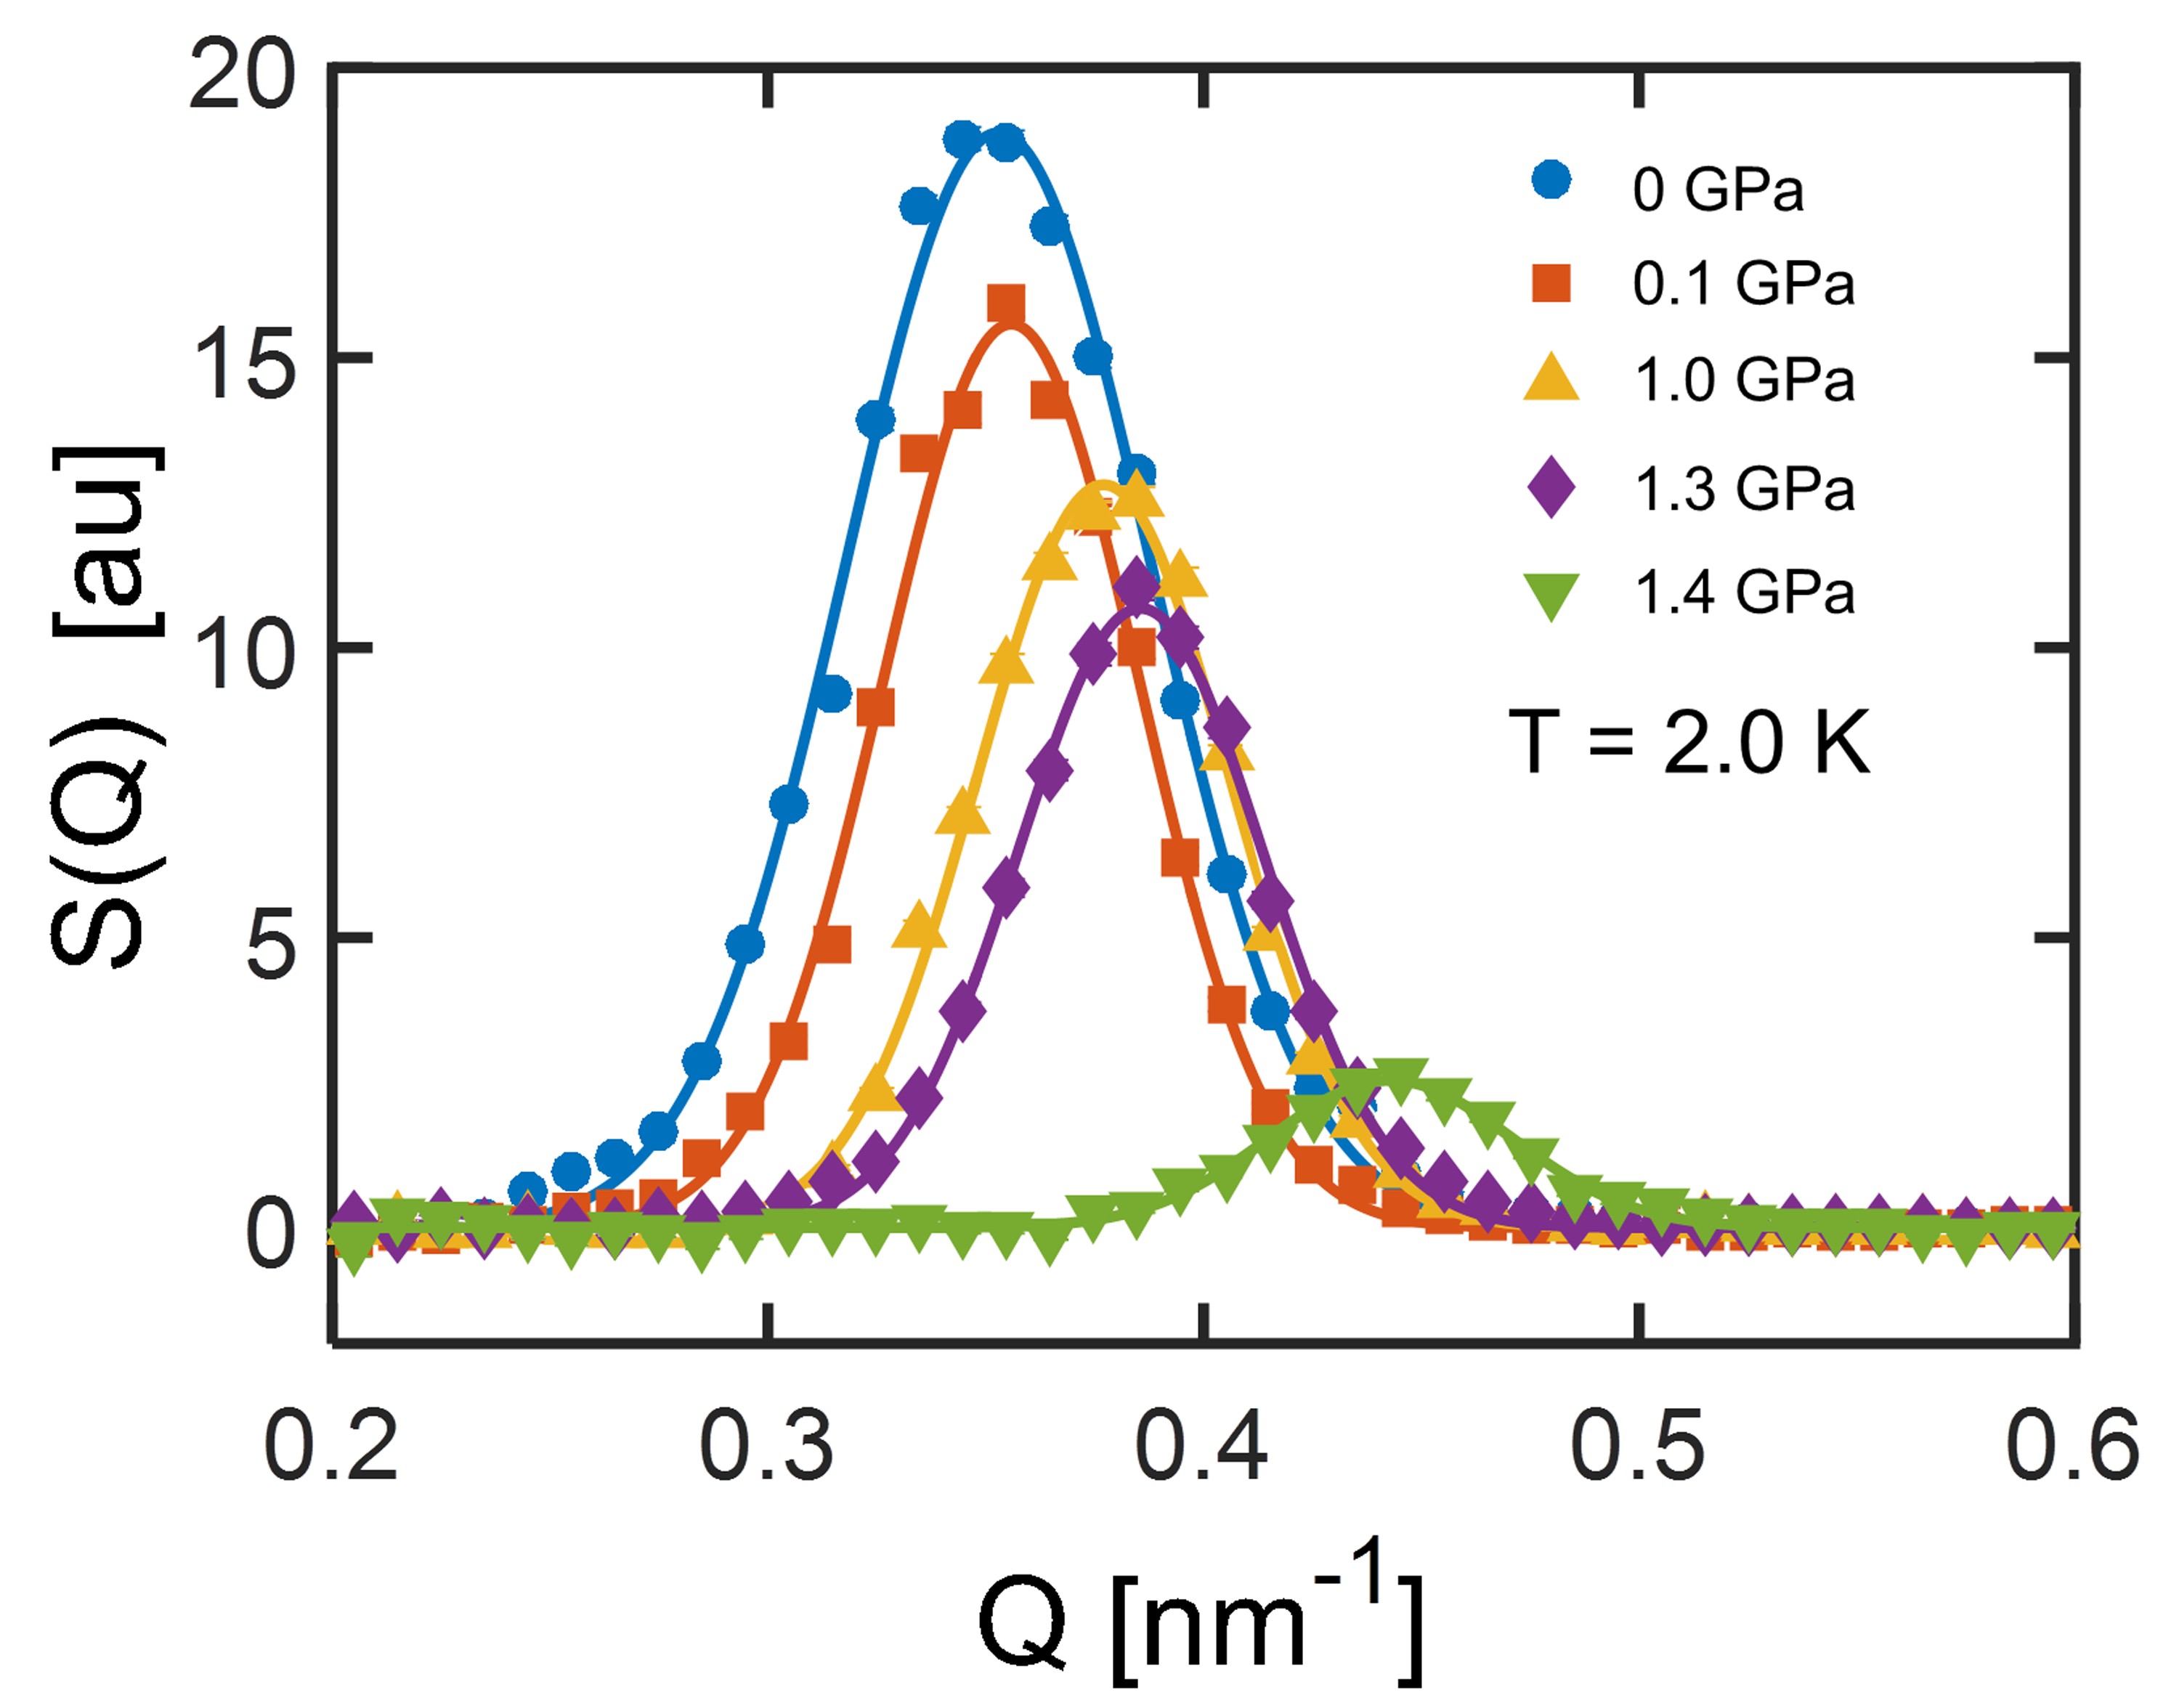
The change of the sign of is accompanied by a relative weakening of the ferromagnetic exchange with respect to the Dzyaloshinsky-Moriya interaction. This is revealed by the decrease of the pitch of the helix , shown in Fig. 2(e), which is consistent with earlier measurements Fåk et al. (2005). In addition, we note that the total scattered intensity at low temperatures does not reduce dramatically with increasing pressure, not even for [Fig. 2(d)]. Therefore, the magnetic moment does not vanish, which is in agreement with previous studies Thessieu et al. (1997); Pfleiderer et al. (1997); Petrova et al. (2006); Otero-Leal et al. (2009). Finally, the temperature dependence of the total scattered intensity also indicates that the weak first-order phase transition, as seen at ambient pressure Stishov et al. (2007); Pappas et al. (2009); Janoschek et al. (2013); Pappas et al. (2017), persists up to .
III.2 Magnetic Field
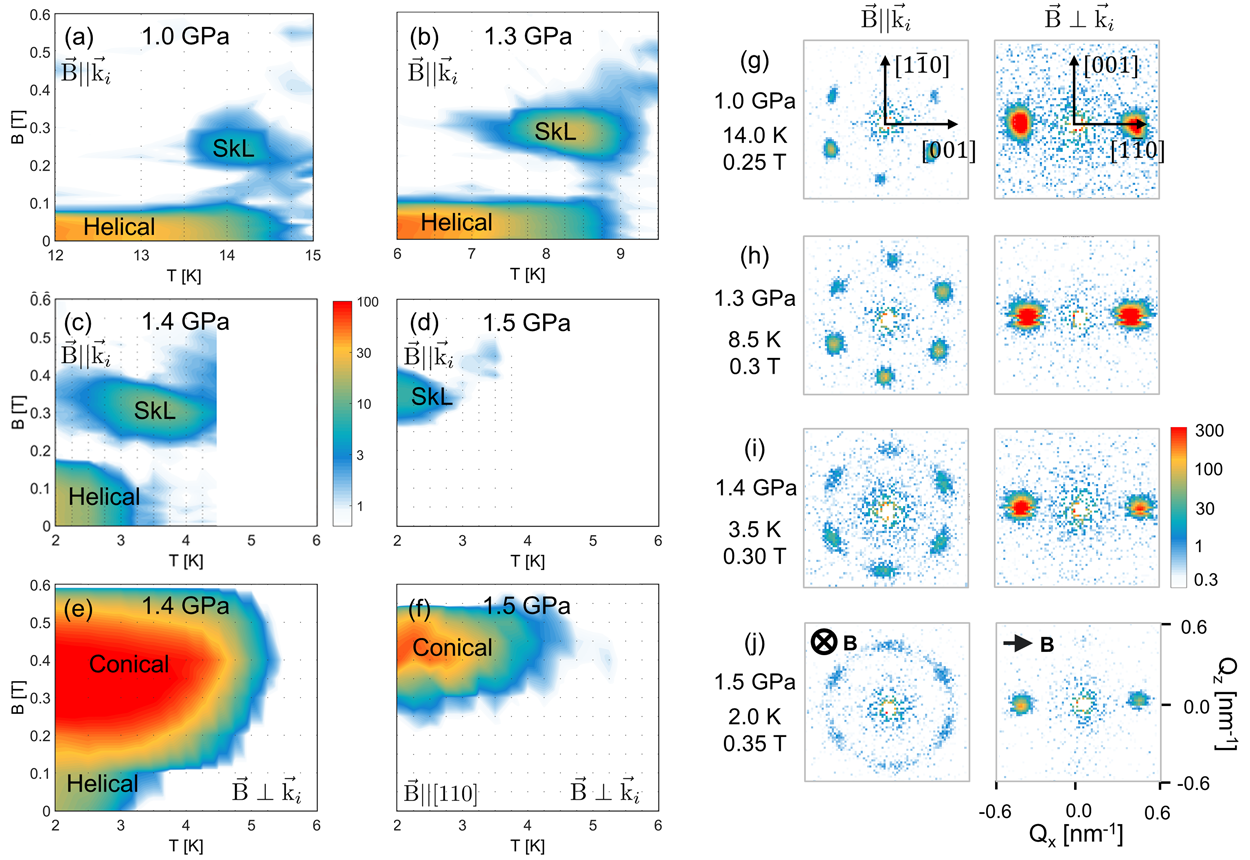
The results under magnetic field are summarized by Fig. 3, which displays SANS patterns and contour plots of the total scattered intensity as a function of temperature and magnetic field at different pressures and for both experimental configurations: and . These results clearly show three distinct regimes: , and .
For , the magnetic field-temperature phase diagrams remain qualitatively the same as at zero pressure. This is illustrated by the contour plot of Fig. 3(a), which displays the total scattered intensity for = 1.0 GPa and for , the configuration sensitive to helical modulations perpendicular to the magnetic field. This plot shows two regions with intensity: at low magnetic fields and below owing to the helical phase, and at intermediate magnetic fields, in the A-phase region, due to the six-fold symmetric SANS patterns [Fig. 3(g)] characteristic of the skyrmion lattice phase Mühlbauer et al. (2009). In the complementary configuration with , which is sensitive to helimagnetic correlations parallel to the magnetic field, the SANS patterns show two peaks along the field [Fig. 3(g)], characteristic of the conical phase, which coexists with the skyrmion lattice in the A-phase.
The behavior changes considerably above . For the skyrmion lattice appears at temperatures significantly higher than [Fig. 3(b),(c)]. At = 1.3 GPa , the skyrmion lattice phase persists up to = 9.4 K, i.e. + 0.4 K. At a slightly larger pressure of 1.4 GPa, the skyrmion lattice extends up to = 4.5, i.e. + 1.5 K, which is a most remarkable result. A similar but even more pronounced effect is seen for the conical phase, which as shown by the contour plot of the total scattered intensity for [Fig. 3(e)], persists up to 5.5 K, i.e. up to 2.
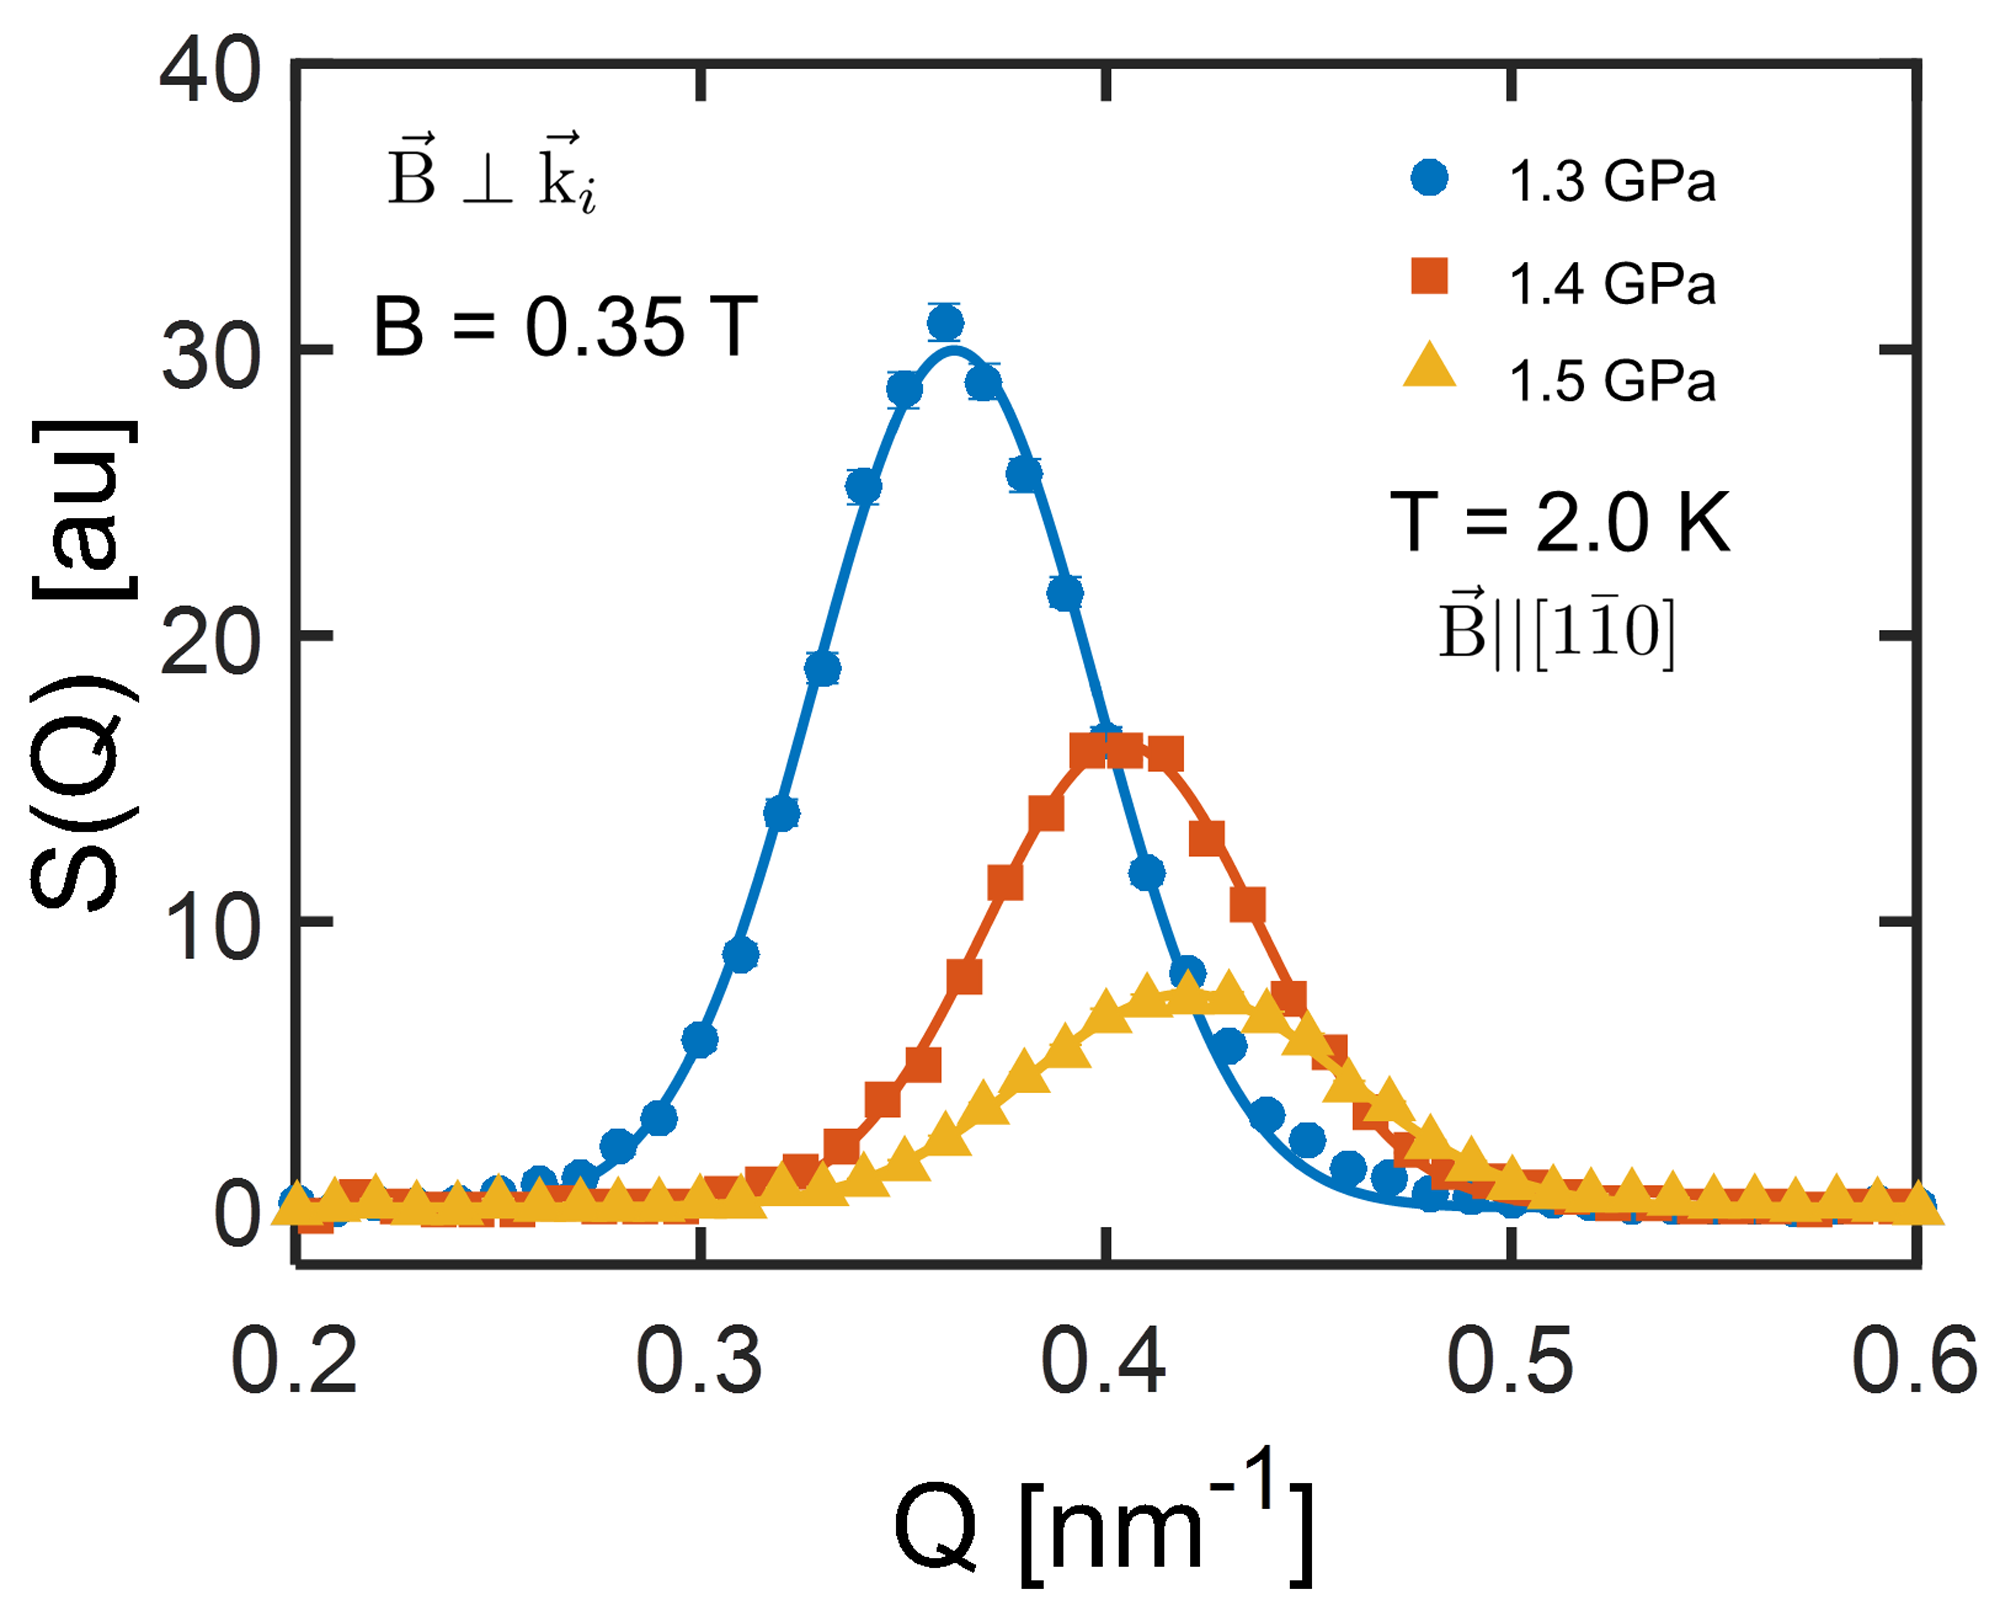
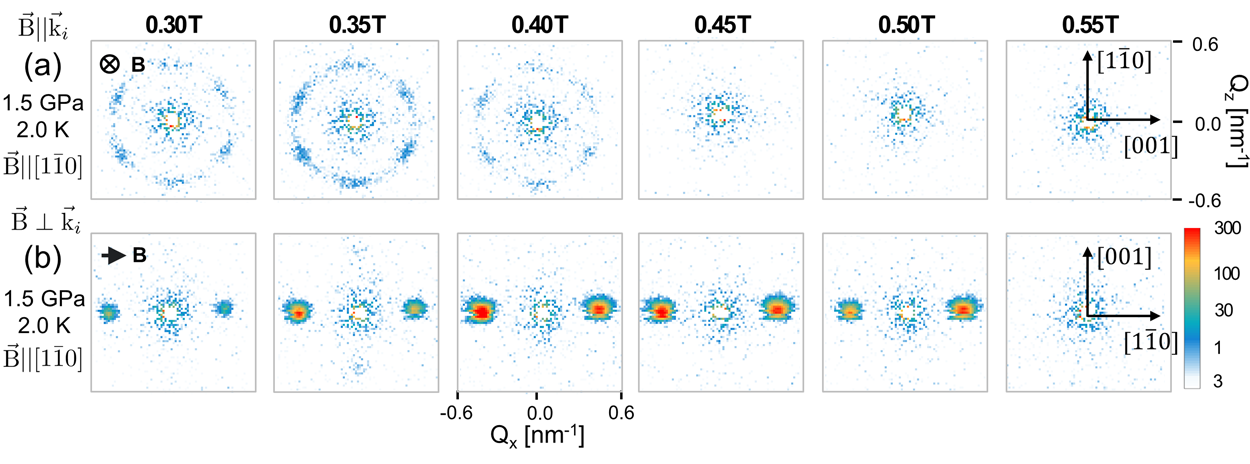
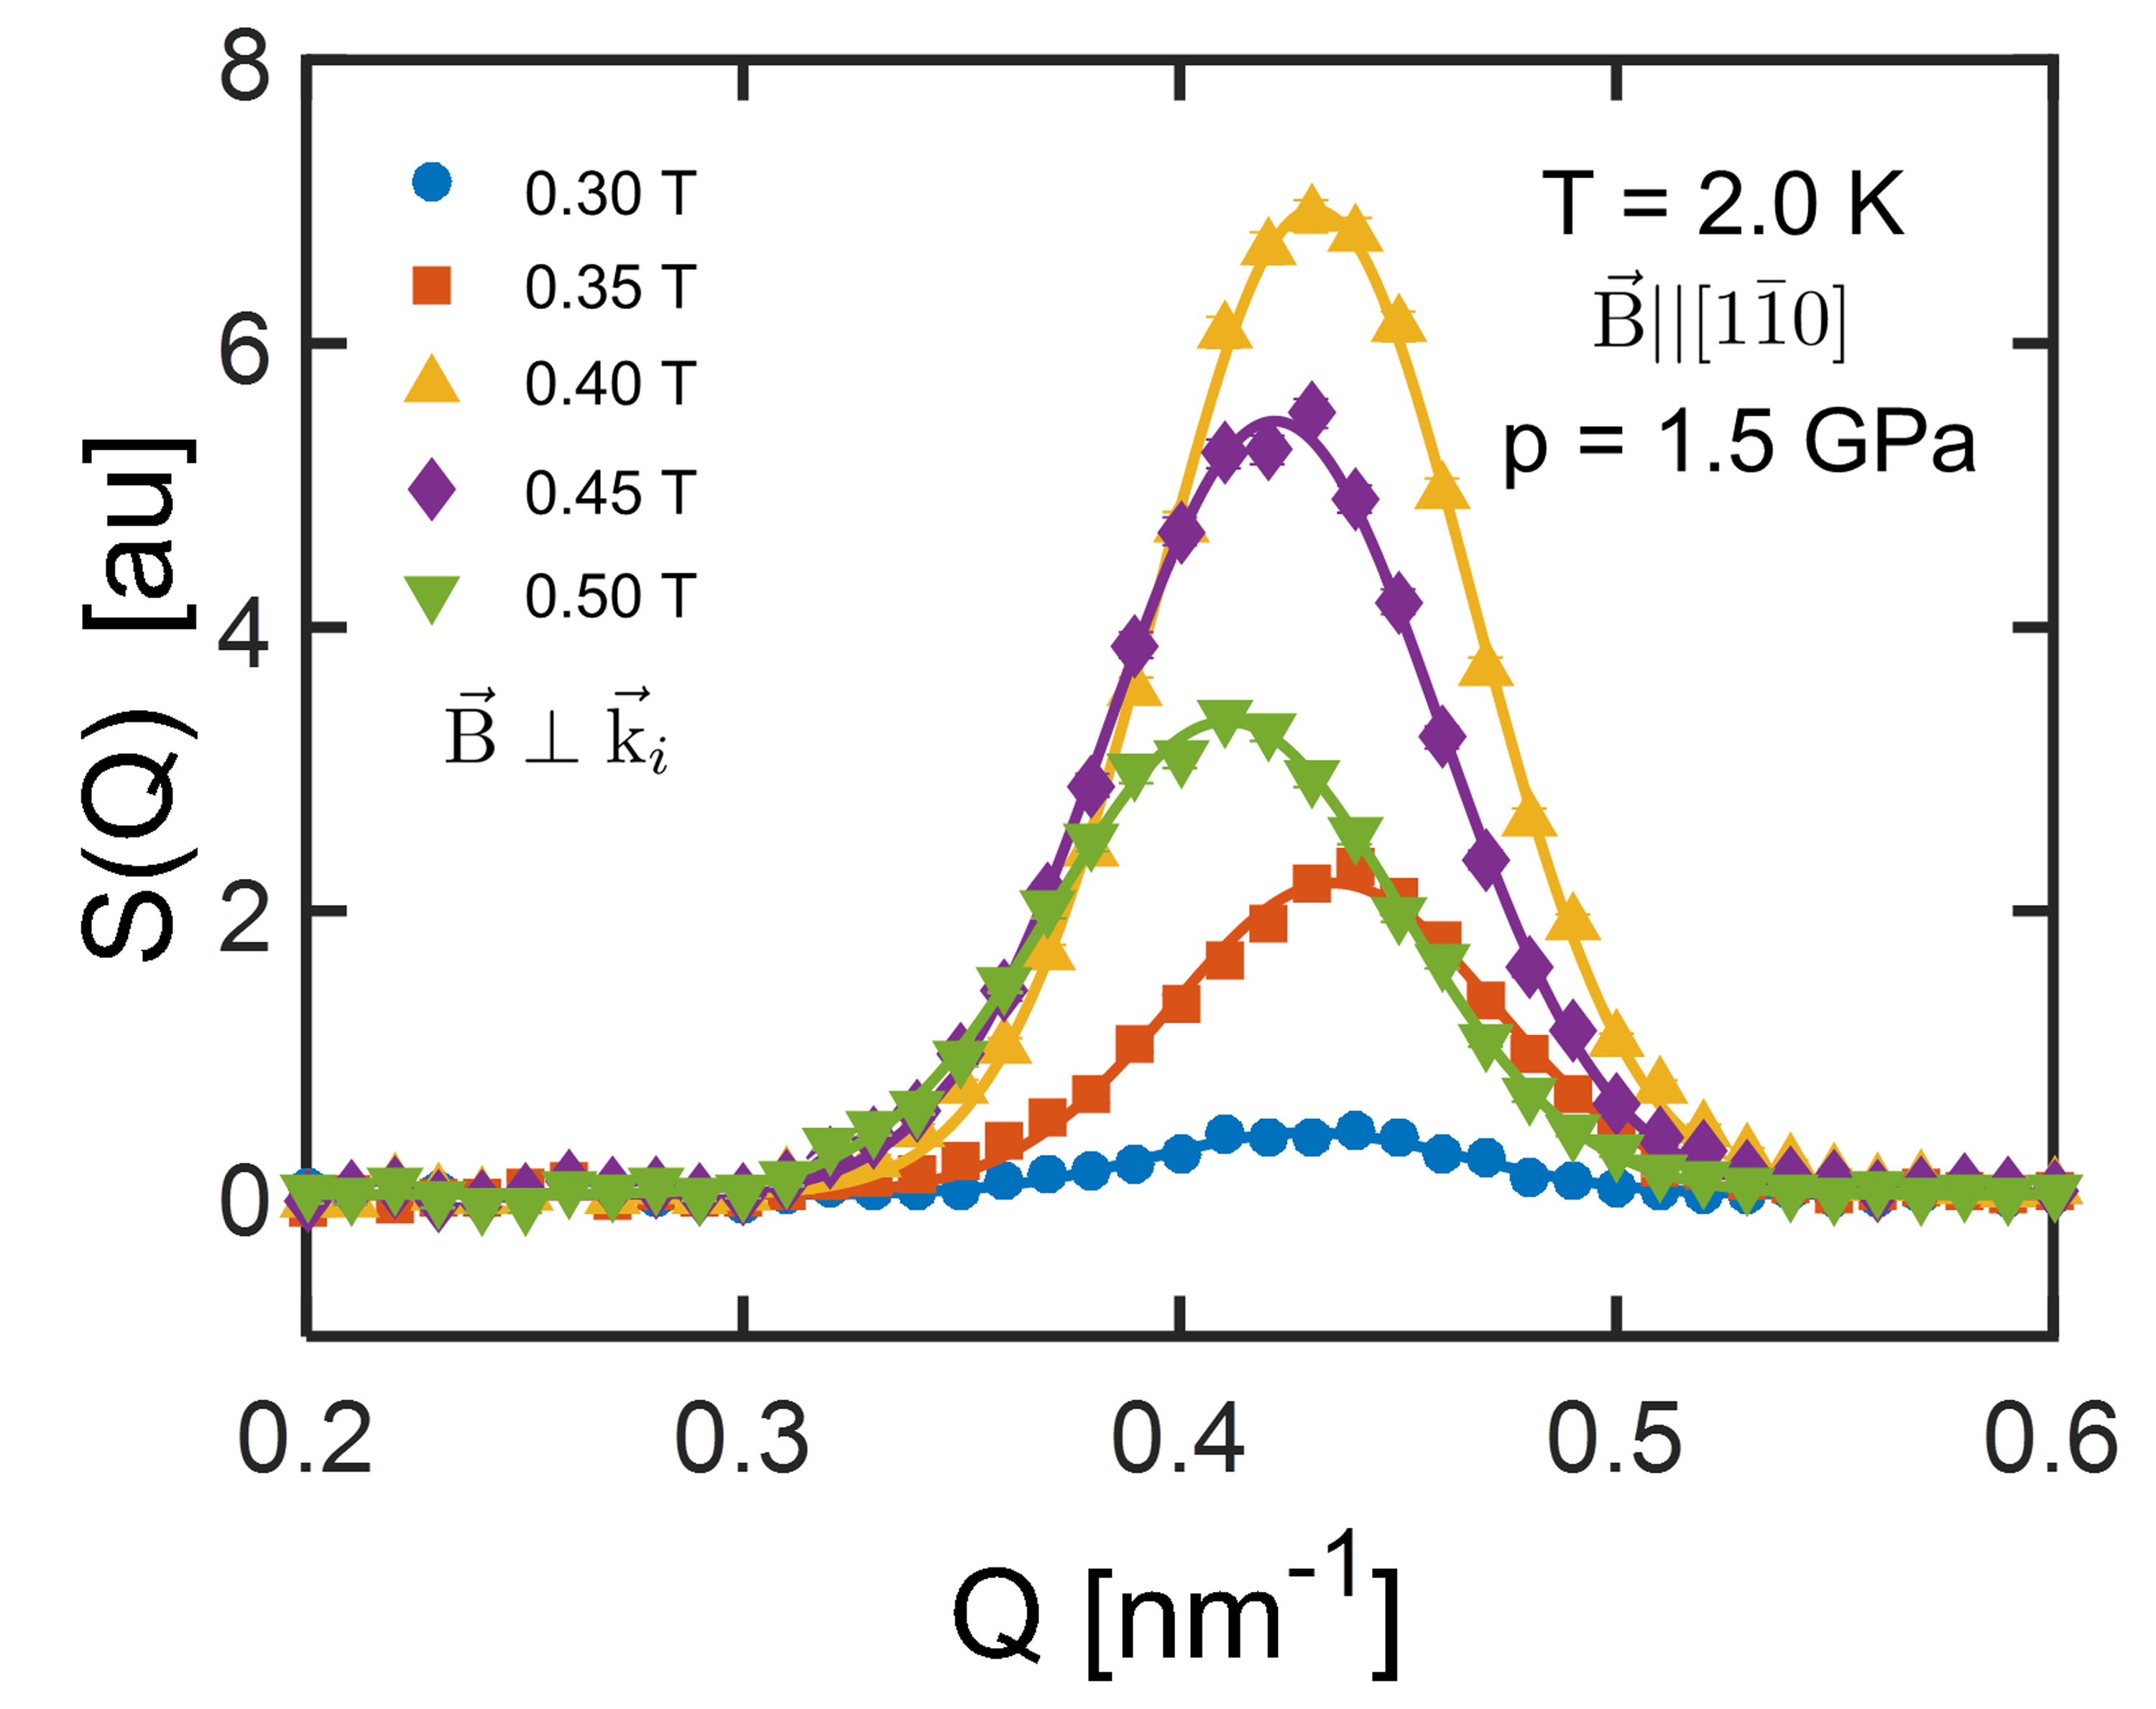
Above , the skyrmion lattice and conical spiral scattering appears under magnetic fields despite the absence of any scattering at zero field. This is illustrated by the patterns of Fig. S4 and the contour plots of Fig. 3(d),(f) for = 1.5 GPa, which show that the skyrmion lattice scattering appears up to = 3 K [Fig. 3(d)], whereas the conical scattering persists up to temperatures as high as = 4.5 K [Fig. 3(f)]. The characteristic skyrmion lattice pattern of six peaks is seen for [Fig. 3(j)], superimposed on a weak ring of scattering. These six maxima are noticeably broader along the ring than at lower pressures [Fig. 3(g)], suggesting that the sixth-order anisotropy, which couples the skyrmion to the crystallographic lattice Mühlbauer et al. (2009); Bannenberg et al. (2017b), weakens considerably at these high pressures. On the other hand, the width of both the peaks and the ring is limited by the experimental resolution. Among the six skyrmion lattice maxima, two are oriented along the -crystallographic directions and their combination with the ring of scattering thus closely resembles the scattering that was previously attributed to partial helimagnetic order Pintschovius et al. (2004); Pfleiderer et al. (2004).
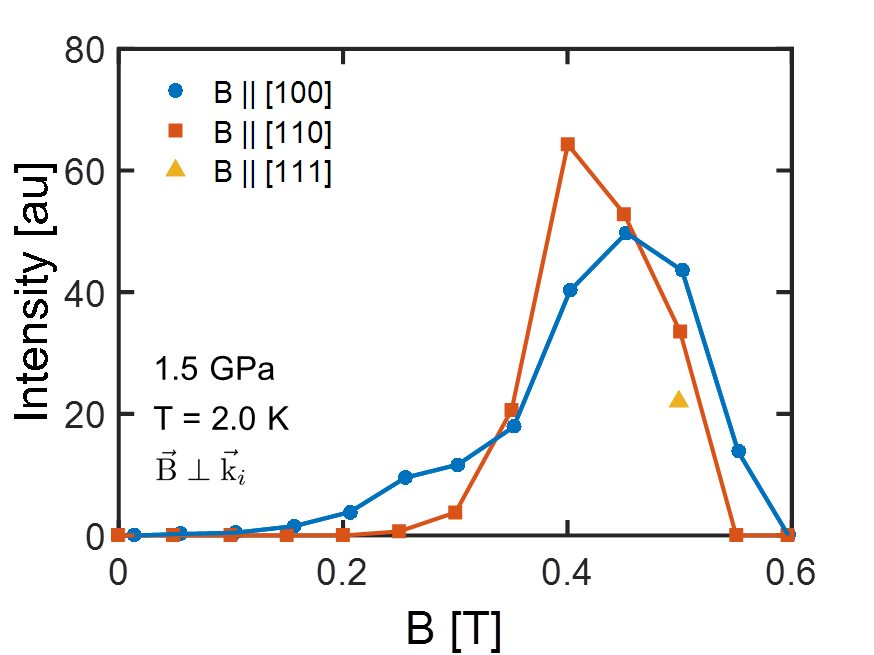
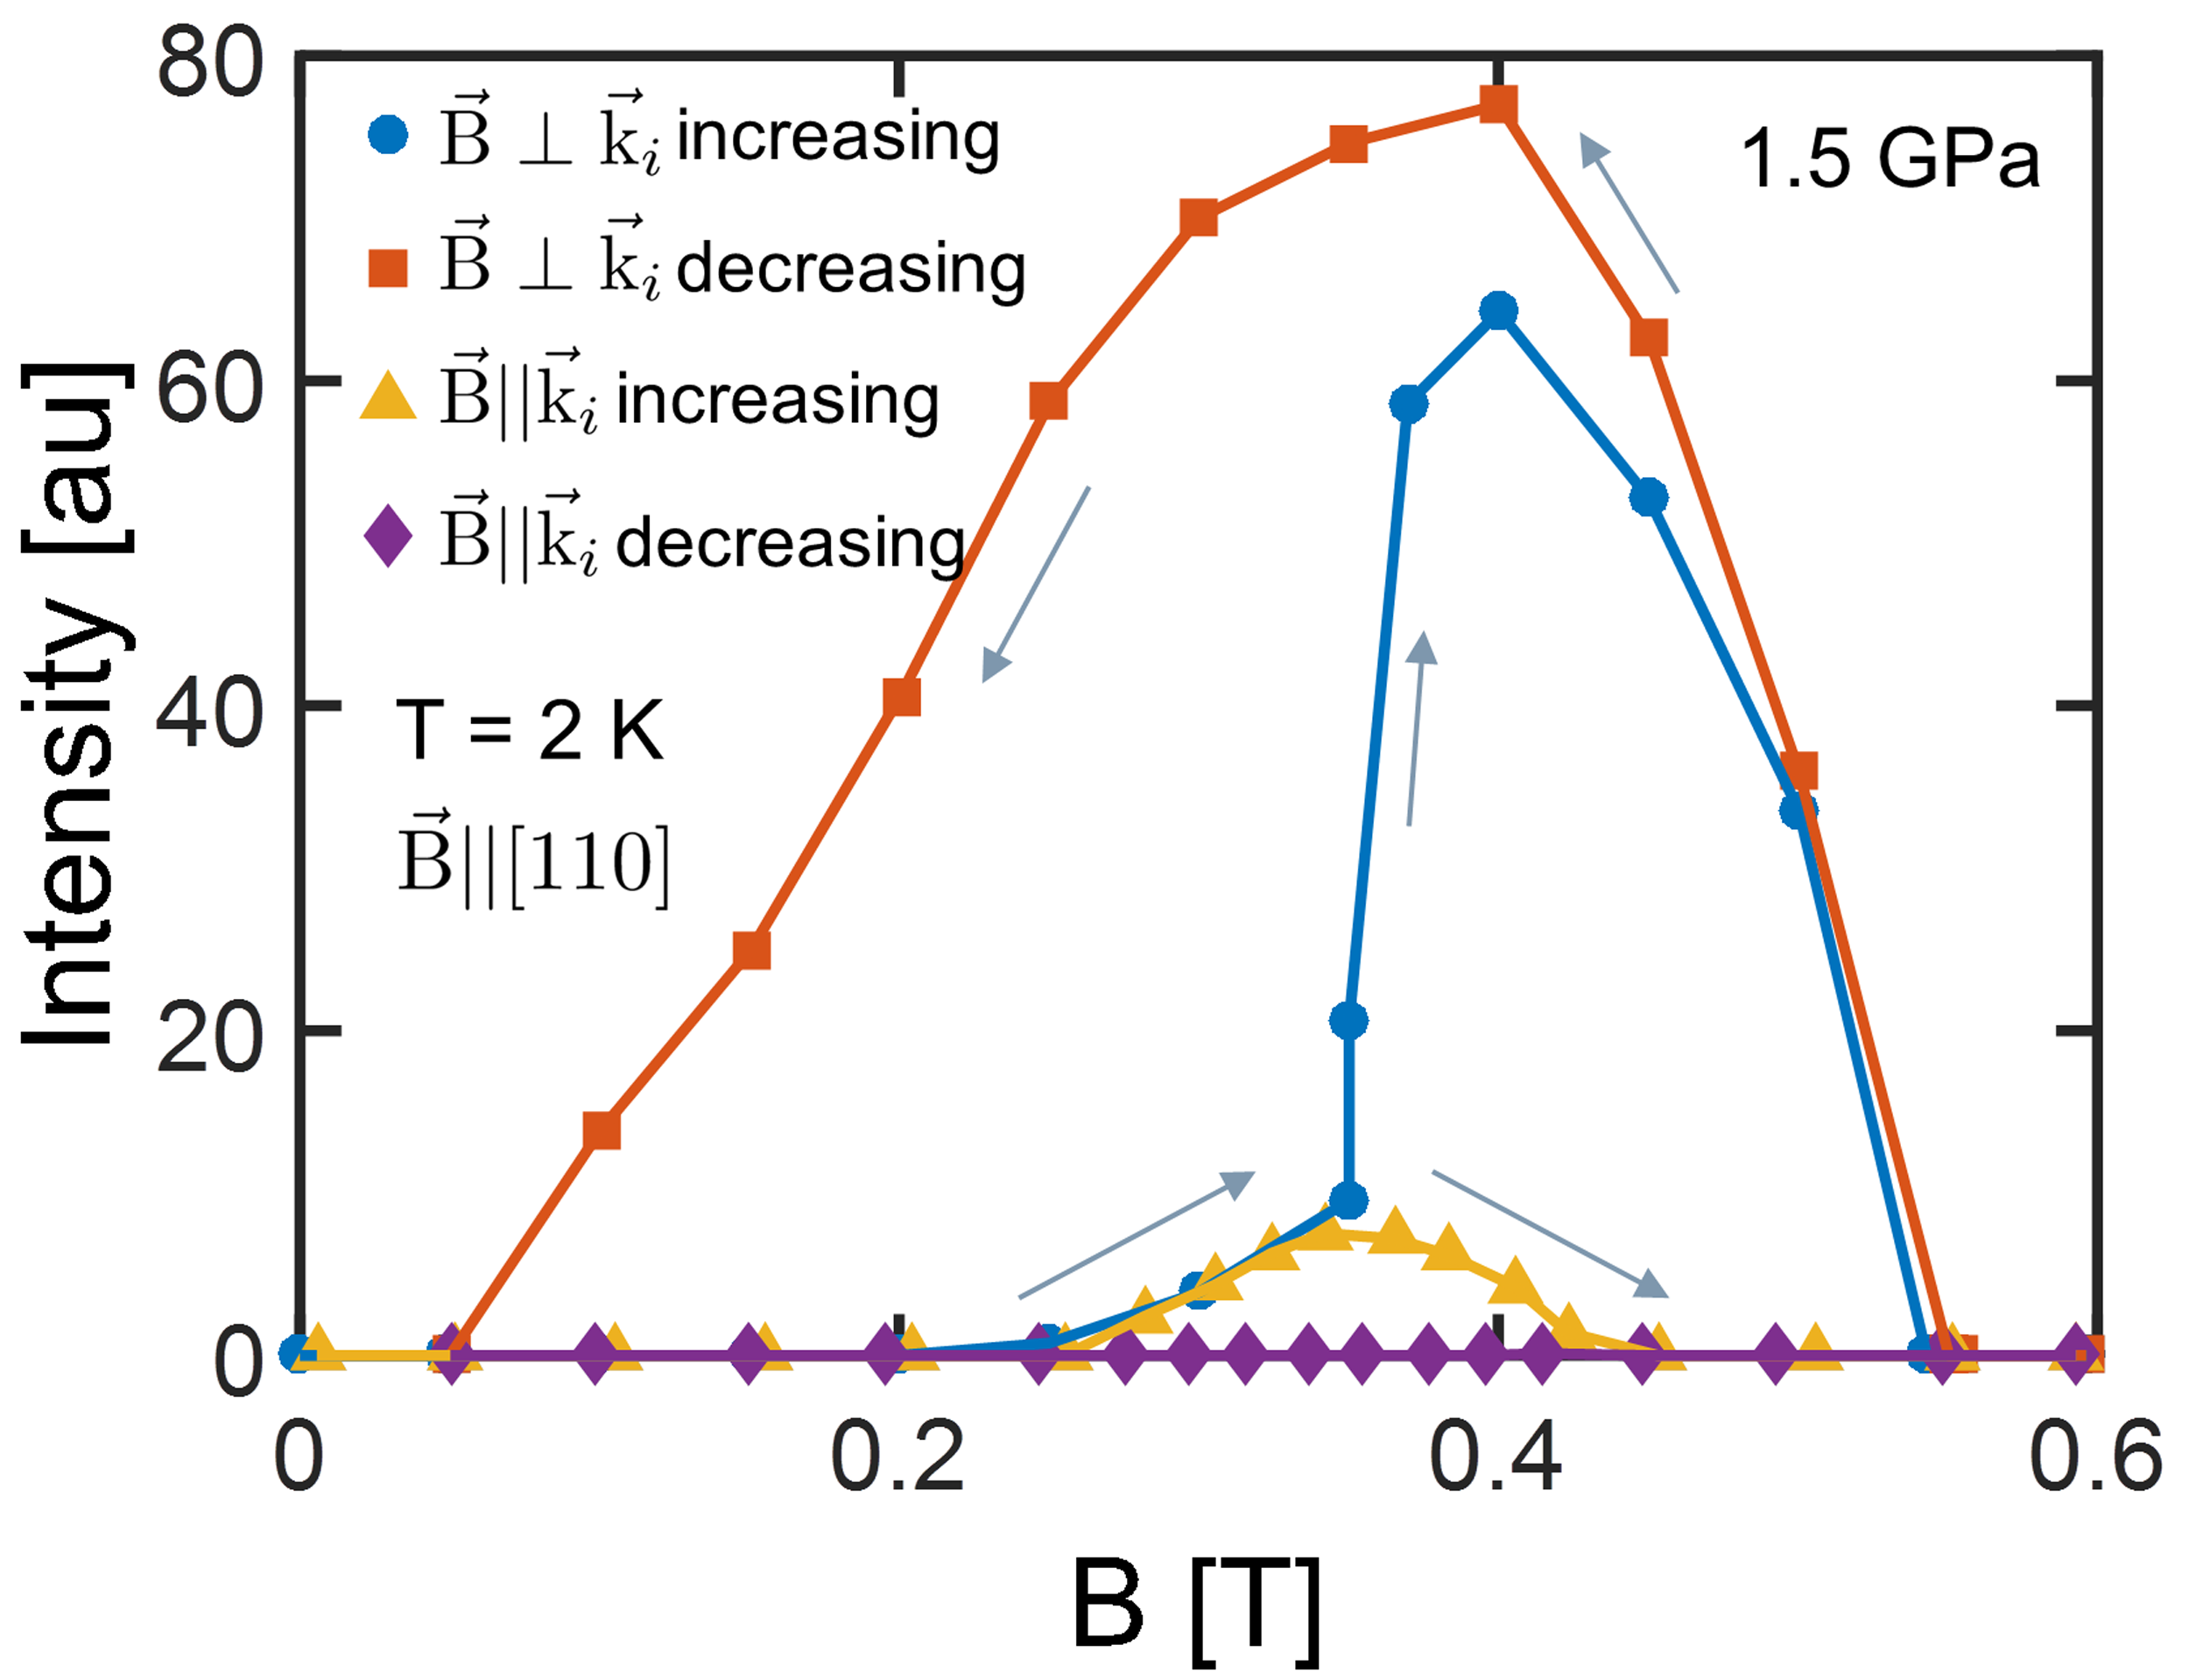
The intensity and extent of both the skyrmion lattice and conical scattering strongly depend on the magnetic history. As shown in Fig. 4, when the field is increased, skyrmion scattering appears between 0.22 and 0.43 T whereas it does not reappear when the magnetic field is decreased from 0.8 T, i.e. from the field-polarized state. On the other hand, with increasing field, the conical scattering appears at the same magnetic field as the skyrmion lattice phase, increases rapidly at 0.4 T before vanishing at the field-polarized state. However, when the magnetic field is decreased from 0.8 T to zero, the conical scattering reappears, becomes even more intense, in particular below 0.4 T, and extends down to very low fields. This strong hysteric behavior suggests that sizable energy barriers are involved in the nucleation of these field-induced phases.
The formation under magnetic field of skyrmion lattices and conical spirals at for and at for is a remarkable observation, which sheds light on earlier puzzling magnetization results Thessieu et al. (1997). In the absence of long-range helimagnetic correlations at zero field, an important question is that of the ground state out of which a magnetic field can stabilize skyrmion lattices and conical spirals. If this state would consist of a partial helimagnetic order, as previously suggested Pfleiderer et al. (2004); Pintschovius et al. (2004), one would expect a considerable amount of scattering to persist down to zero magnetic field especially when the magnetic field is reduced from high to low values (Fig. 4). However, this is not what we observe. One may argue that we are hindered by the background of the pressure cell that would mask the scattering of the partial helical order. On the other hand, as seen in Fig. 2(d), the background of the cell is small enough to let us observe the diffuse scattering of the precursor phase at low pressures, which is more than two orders of magnitude weaker than the maximum of the conical scattering at 1.5 GPa (Fig. 4). We thus conclude that we should have been able to observe the partial helical order if the intensity of the scattering would have been comparable to that of the diffuse scattering of the precursor phase at low pressures.
The destabilization of the long-range helical order at and the nature of the phase that sets-in above have been widely debated in the literature Rößler et al. (2006); Tewari et al. (2006); Binz et al. (2006); Fischer et al. (2008); Hopkinson and Kee (2009); Kirkpatrick and Belitz (2010); Pfleiderer et al. (2009). In the absence of quantum criticality Pfleiderer et al. (2007) it has been suggested that the NFL and THE behavior would be the signature of spin textures and spin excitations with a non-trivial topology Pfleiderer et al. (2009). These would predominately be stabilized by magnetic moment modulus fluctuations, resulting from the reduced longitudinal spin stiffness and the weak itinerant electron character of the magnetism in MnSi Rößler et al. (2006). The softening of the magnetic moment implies that the magnetization modulus becomes strongly field dependent, and this could explain the formation of conical spirals or skyrmion lattices under magnetic field, even in the absence of any long-range helimagnetic correlations at zero field Leonov and Bogdanov (2018). Following this scenario, hydrostatic pressure would reduce the longitudinal spin stiffness and soften the magnetic moment. In other words, hydrostatic pressure would enhance the itinerant electron character of the magnetism in MnSi and this enhancement could be a driver in the destabilization of the long-range helical order at .
IV Conclusion
In conclusion, our SANS results shed light on the puzzling behavior of MnSi under pressure. With increasing pressure, first the helical propagation vector smoothly reorients from to around . At higher pressures, the helimagnetic order persists at zero magnetic field up to . Nevertheless, magnetic fields stabilize conical spirals and skyrmion lattices even in the absence of helimagnetic correlations at zero field, thus even above in a part of the phase diagram where previous studies reported NFL and THE behavior. This unexpected observation can possibly be attributed to a softening of the magnetic moment reflecting an enhancement of the itinerant electron character of the magnetism in MnSi with increasing pressure. We argue that this enhancement could be a driver in the destabilization of the long-range helical order at .
Acknowledgements.
The authors wish to thank N. Martin for fruitful discussions and the ISIS and ILL support staff for their assistance. Experiments at the ISIS Pulsed Neutron and Muon Source were supported by a beamtime allocation from the Science and Technology Facilities Council and The Netherlands Organization for Scientific Research (NWO). The ISIS experimental data is available through doi.org/10.5286/ISIS.E.90588288. The work of LJB and CP is financially supported by The Netherlands Organization for Scientific Research through project 721.012.102 (Larmor). TAL and DLS acknowledge support by the U.S. Department of Energy, Basic Energy Sciences under Contract DE-AC02-07CH11358.References
- Mühlbauer et al. (2009) S. Mühlbauer, B. Binz, F. Jonietz, C. Pfleiderer, A. Rosch, A. Neubauer, R. Georgii, and P. Böni, Science 323, 915 (2009).
- Neubauer et al. (2009) A. Neubauer, C. Pfleiderer, B. Binz, A. Rosch, R. Ritz, P. G. Niklowitz, and P. Böni, Physical Review Letters 102, 186602 (2009).
- Pfleiderer et al. (2001) C. Pfleiderer, S. Julian, and G. G. Lonzarich, Nature 414, 427 (2001).
- Doiron-Leyraud et al. (2003) N. Doiron-Leyraud, I. R. Walker, L. Taillefer, M. J. Steiner, S. R. Julian, and G. G. Lonzarich, Nature 425, 595 (2003).
- Pfleiderer et al. (2007) C. Pfleiderer, P. Böni, T. Keller, U. K. Rößler, and A. Rosch, Science 316, 1871 (2007).
- Lee et al. (2009) M. Lee, W. Kang, Y. Onose, Y. Tokura, and N. P. Ong, Physical Review Letters 102, 186601 (2009).
- Ritz et al. (2013a) R. Ritz, M. Halder, M. Wagner, C. Franz, A. Bauer, and C. Pfleiderer, Nature 497, 231 (2013a).
- Ritz et al. (2013b) R. Ritz, M. Halder, C. Franz, A. Bauer, M. Wagner, R. Bamler, A. Rosch, and C. Pfleiderer, Physical Review B 87, 134424 (2013b).
- Pfleiderer et al. (2004) C. Pfleiderer, D. Reznik, L. Pintschovius, H. v Lohneysen, et al., Nature 427, 227 (2004).
- Pintschovius et al. (2004) L. Pintschovius, D. Reznik, C. Pfleiderer, and H. von Löhneysen, Pramana 63, 117 (2004).
- Pfleiderer et al. (1997) C. Pfleiderer, G. J. McMullan, S. R. Julian, and G. G. Lonzarich, Physical Review B 55, 8330 (1997).
- Fåk et al. (2005) B. Fåk, R. A. Sadykov, J. Flouquet, and G. Lapertot, Journal of Physics: Condensed Matter 17, 1635 (2005).
- Yu et al. (2004) W. Yu, F. Zamborszky, J. D. Thompson, J. L. Sarrao, M. E. Torelli, Z. Fisk, and S. E. Brown, Physical Review Letters 92, 086403 (2004).
- Uemura et al. (2007) Y. J. Uemura, T. Goko, I. M. Gat-Malureanu, J. P. Carlo, P. L. Russo, A. T. Savici, A. Aczel, G. J. MacDougall, J. A. Rodriguez, G. M. Luke, et al., Nature Physics 3, 29 (2007).
- Andreica et al. (2010) D. Andreica, P. DalmasdeRéotier, A. Yaouanc, A. Amato, and G. Lapertot, Physical Review B 81, 060412(R) (2010).
- Sadykov et al. (2018) R. Sadykov, C. Pappas, L. J. Bannenberg, R. M. Dalgliesh, P. Falus, C. Goodway, and E. Lelievre-Berna, Journal of Neutron Research 20, 25 (2018).
- (17) “See Supplemental Material for more experimental details and additional SANS and NSE results,” .
- Grigoriev et al. (2005) S. V. Grigoriev, S. V. Maleyev, A. I. Okorokov, Y. O. Chetverikov, R. Georgii, P. Böni, D. Lamago, H. Eckerlebe, and K. Pranzas, Physical Review B 72, 134420 (2005).
- Pappas et al. (2009) C. Pappas, E. Lelievre-Berna, P. Falus, P. M. Bentley, E. Moskvin, S. Grigoriev, P. Fouquet, and B. Farago, Physical Review Letters 102, 197202 (2009).
- Janoschek et al. (2013) M. Janoschek, M. Garst, A. Bauer, P. Krautscheid, R. Georgii, P. Böni, and C. Pfleiderer, Physical Review B 87, 134407 (2013).
- Pappas et al. (2017) C. Pappas, L. J. Bannenberg, E. Lelièvre-Berna, F. Qian, C. D. Dewhurst, R. M. Dalgliesh, D. L. Schlagel, T. A. Lograsso, and P. Falus, Physical Review Letters 119, 047203 (2017).
- Bannenberg et al. (2017a) L. J. Bannenberg, K. Kakurai, P. Falus, E. Lelièvre-Berna, R. M. Dalgliesh, C. D. Dewhurst, F. Qian, Y. Onose, Y. Endoh, Y. Tokura, and C. Pappas, Physical Review B 95, 144433 (2017a).
- Petrova and Stishov (2012) A. E. Petrova and S. M. Stishov, Phys. Rev. B 86, 174407 (2012).
- Sidorov et al. (2014) V. A. Sidorov, A. E. Petrova, P. S. Berdonosov, V. A. Dolgikh, and S. M. Stishov, Physical Review B 89, 100403(R) (2014).
- Bak and Jensen (1980) P. Bak and M. H. Jensen, Journal of Physics C: Solid State Physics 13, L881 (1980).
- Thessieu et al. (1997) C. Thessieu, C. Pfleiderer, A. N. Stepanov, and J. Flouquet, Journal of Physics: Condensed Matter 9, 6677 (1997).
- Petrova et al. (2006) A. E. Petrova, V. Krasnorussky, J. Sarrao, and S. M. Stishov, Physical Review B 73, 052409 (2006).
- Otero-Leal et al. (2009) M. Otero-Leal, F. Rivadulla, S. S. Saxena, K. Ahilan, and J. Rivas, Physical Review B 79, 060401(R) (2009).
- Stishov et al. (2007) S. M. Stishov, A. E. Petrova, S. Khasanov, G. K. Panova, A. A. Shikov, J. C. Lashley, D. Wu, and T. A. Lograsso, Physical Review B 76, 052405 (2007).
- Bannenberg et al. (2017b) L. J. Bannenberg, F. Qian, R. M. Dalgliesh, N. Martin, G. Chaboussant, M. Schmidt, D. L. Schlagel, T. A. Lograsso, H. Wilhelm, and C. Pappas, Physical Review B 96, 184416 (2017b).
- Rößler et al. (2006) U. K. Rößler, A. N. Bogdanov, and C. Pfleiderer, Nature 442, 797 (2006).
- Tewari et al. (2006) S. Tewari, D. Belitz, and T. R. Kirkpatrick, Physical Review Letters 96, 047207 (2006).
- Binz et al. (2006) B. Binz, A. Vishwanath, and V. Aji, Physical Review Letters 96, 207202 (2006).
- Fischer et al. (2008) I. Fischer, N. Shah, and A. Rosch, Physical Review B 77, 024415 (2008).
- Hopkinson and Kee (2009) J. M. Hopkinson and H.-Y. Kee, Physical Review B 79, 14421 (2009).
- Kirkpatrick and Belitz (2010) T. R. Kirkpatrick and D. Belitz, Physical Review Letters 104, 256404 (2010).
- Pfleiderer et al. (2009) C. Pfleiderer, A. Neubauer, S. Muhlbauer, F. Jonietz, M. Janoschek, S. Legl, R. Ritz, W. Münzer, C. Franz, P. G. Niklowitz, T. Keller, R. Georgii, P. Böni, B. Binz, A. Rosch, U. K. Rößler, and A. N. Bogdanov, Journal of Physics-Condensed Matter 21, 164215 (2009).
- Leonov and Bogdanov (2018) A. O. Leonov and A. N. Bogdanov, New Journal of Physics 20, 043017 (2018).
- Bannenberg et al. (2018a) L. J. Bannenberg, F. Weber, A. J. E. Lefering, T. Wolf, and C. Pappas, Physical Review B 98, 184430 (2018a).
- Bannenberg et al. (2018b) L. J. Bannenberg, R. M. Dalgliesh, T. Wolf, F. Weber, and C. Pappas, Physical Review B 98, 184431 (2018b).
Experimental Details
S0.0.1 Sample and Pressure Cell
The measurements were performed on a 110 mg single crystal of MnSi of approximately 223 mm3 in size which originates from the same batch as the samples used in Pappas et al. (2017); Bannenberg et al. (2017b, 2018a, 2018b). It was aligned with the [10] crystallographic direction vertical and placed in a cylindrical teflon tube. High pressures were generated using a CuBe/TiZr double-wall clamp cell with a 50 - 50% mixture of FC770 and FC75 as pressure transmitter. Details of the pressure cell and the modus operandi can be found in ref. Sadykov et al. (2018).
S0.0.2 SANS
The SANS measurements were performed at the time-of-flight instrument LARMOR of the ISIS neutron source using neutrons with wavelengths 0.09 1.25 nm. The sample was located 4.4 m from the detector that consists of 80 3He tubes, each 8 mm wide. The magnetic field was applied with a 2T 3D vector field cryomagnet both parallel and perpendicular to the incoming neutron beam. We carefully eliminated the residual magnetic fields by warming up the entire cryomagnet prior to the measurements. All SANS patterns are normalized to standard monitor counts and background corrected using a high temperature measurement.
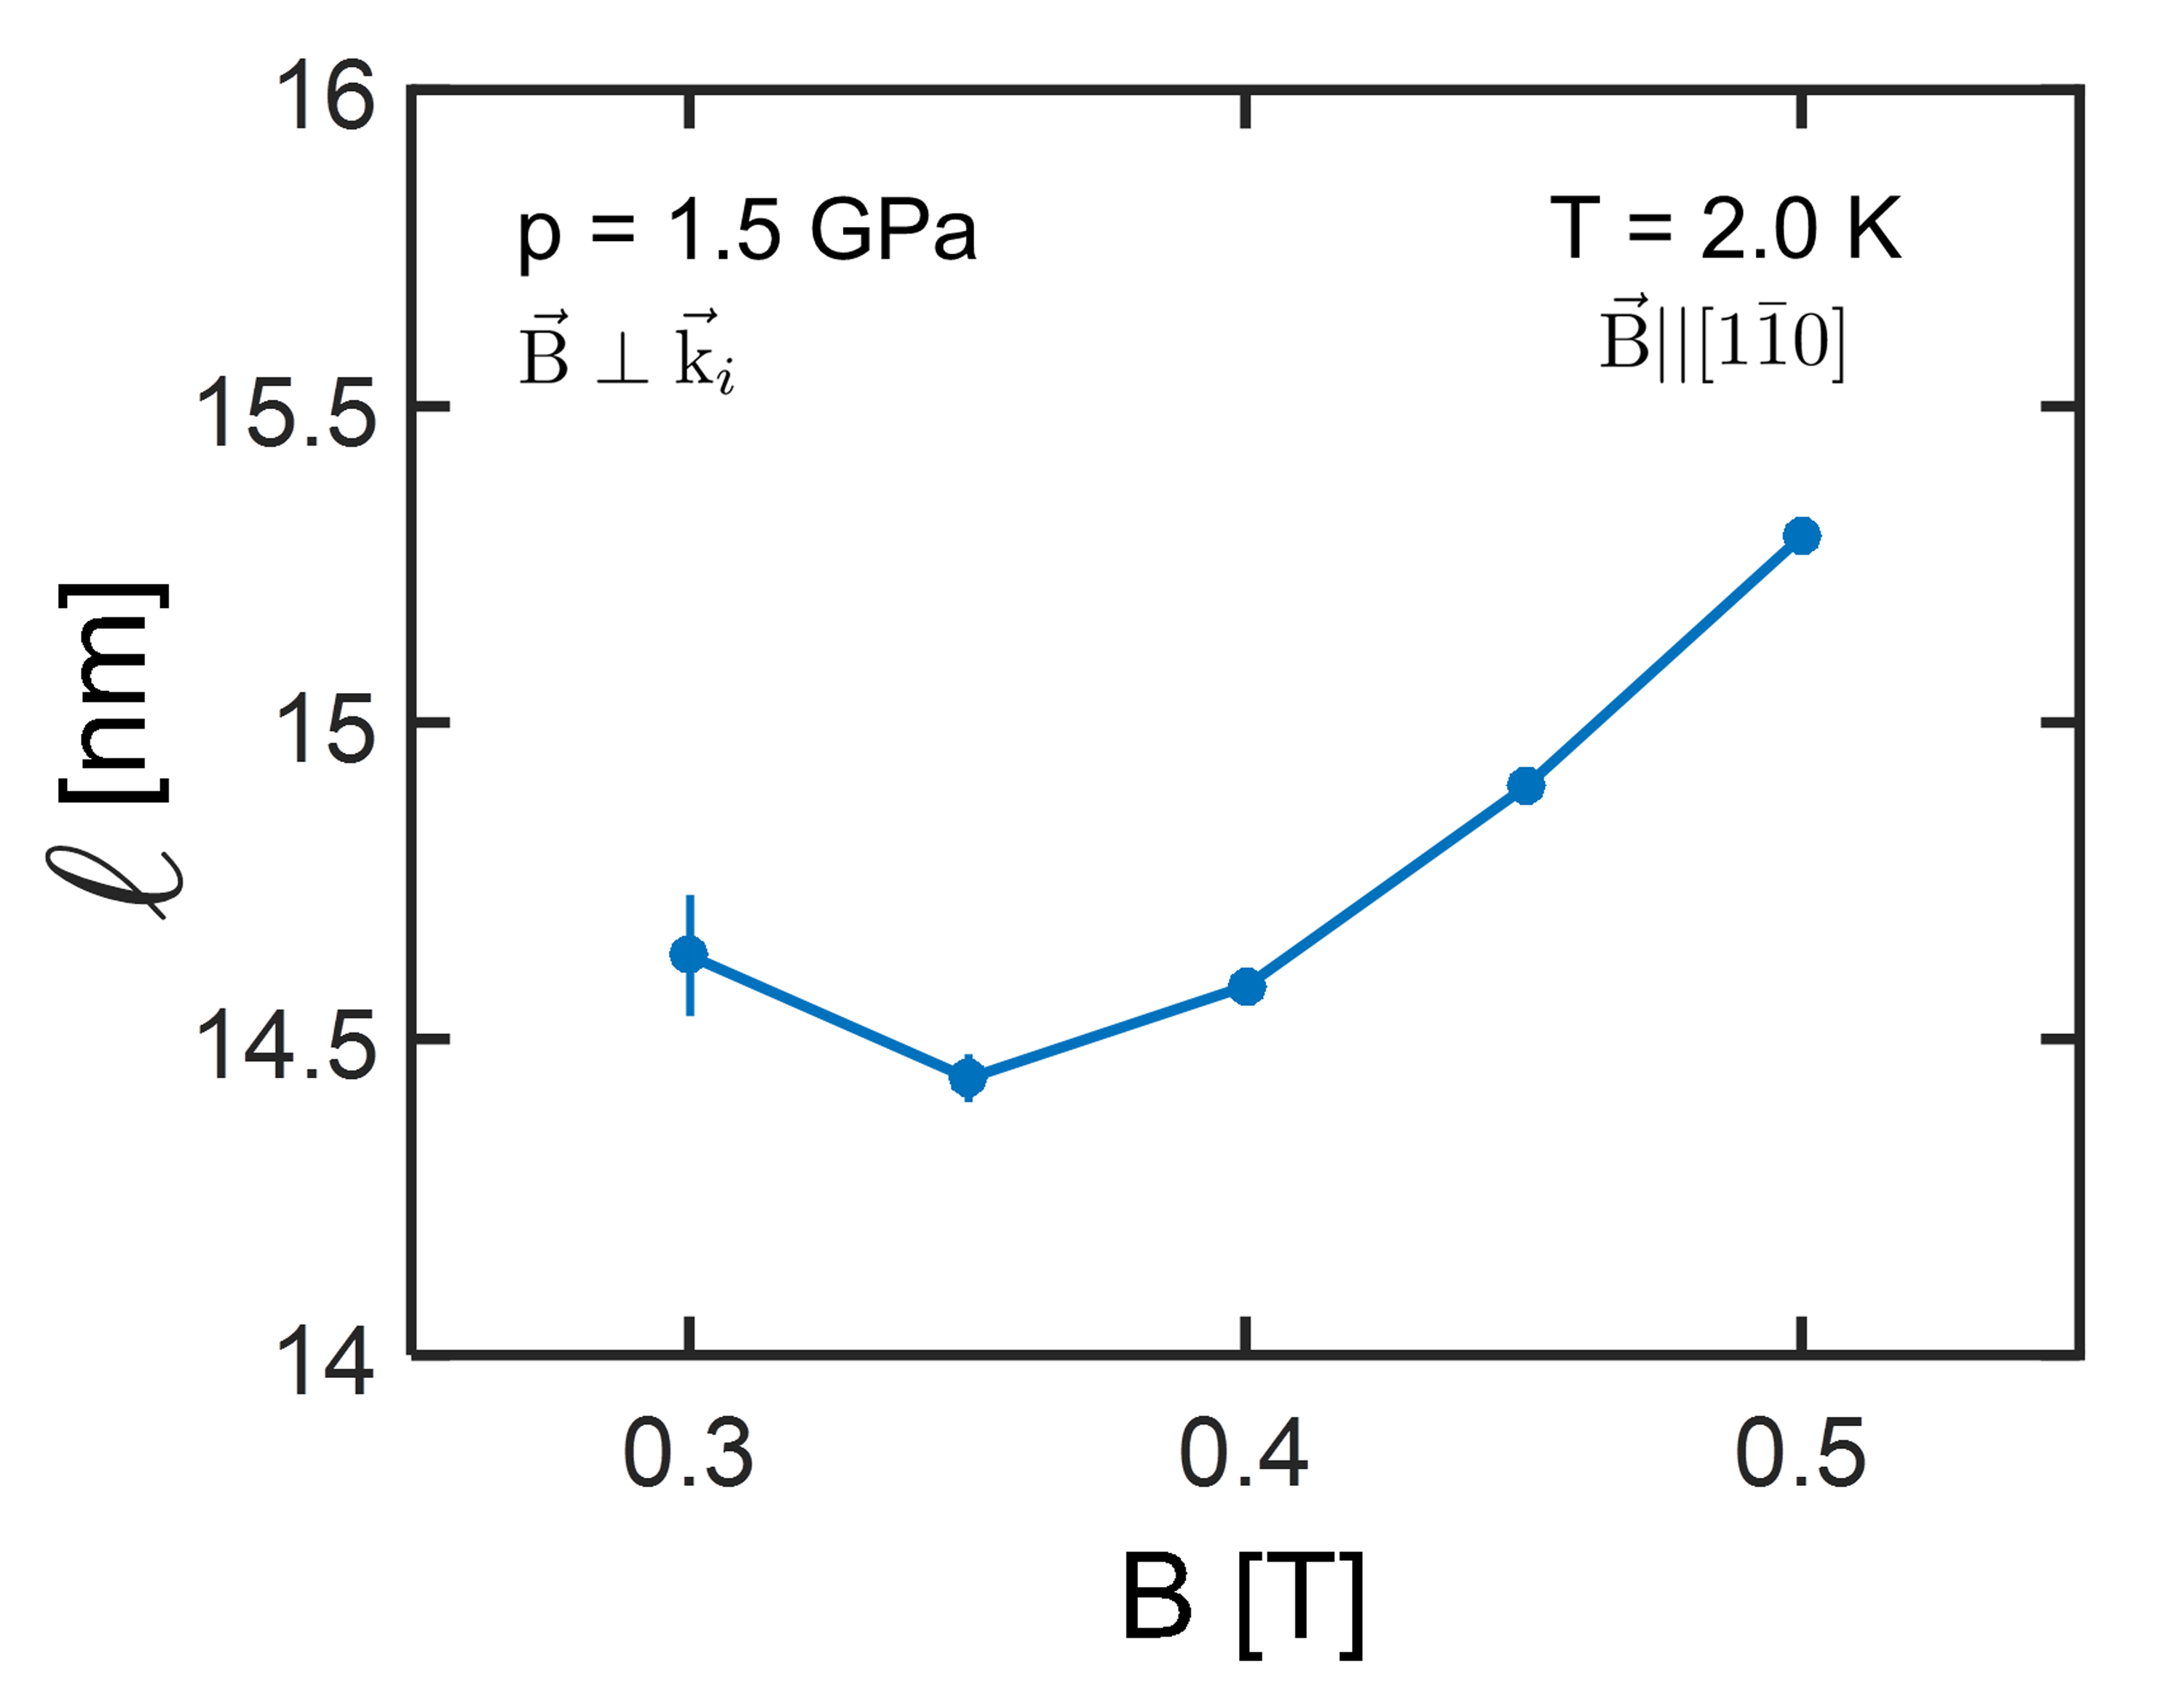
The scattering function is a one dimensional representation of the 2D SANS patterns and obtained from radially averaging the SANS patterns of e.g. Fig. 2. Fig. S3 shows example data at zero magnetic field and at = 2 K for different pressures. The data were fitted to a Gaussian:
| (S1) |
with the pitch of the helix and the FWHM. The resulting values of at zero magnetic field are provided in Fig. 2(d). The integrated intensity is computed by summing all scattered intensity with a momentum transfer of 0.2 1.2 nm-1.
S0.0.3 NSE Spectroscopy
The Neutron Spin Echo (NSE) Spectroscopy measurements were performed for 0.2, 1 and 1.3 GPa at the IN15 spectrometer of the Institute Laue-Langevin. The measurements were performed in the paramagnetic NSE configuration and the neutron beam had a wavelength of = 0.9 nm and a monochromatization of / = 15%. The results for =1.3 GPa are displayed in Figure S10 and show that the intermediate scattering function remains purely elastic from low temperatures up to . In fact the NSE signal is elastic at all temperatures where measurements are possible (at higher temperatures the magnetic signal weakens considerably in comparison to the background generated by the pressure cell and this hinders a reliable determination of the paramagnetic NSE response).
As mentioned in the main text, the absence of relaxation for confirms the suppression of the precursor phenomena with increasing pressure shown by the SANS results of Fig. 2. This suppression is also consistent with the weakening with increasing pressure of the ‘shoulder’, which is characteristic of the precursor phase and is seen slightly above in the temperature dependence of the resistivity and the specific heat Petrova and Stishov (2012); Sidorov et al. (2014).
Supplemental Figures