Anomalous protein kinetics on low-fouling surfaces
Abstract
In this work, protein-surface interactions were probed in terms of adsorption and desorption of a model protein, bovine serum albumin, on a low-fouling surface with single-molecule localization microscopy. Single-molecule experiments enable precise determination of both adsorption and desorption rates. Strikingly the experimental data show anomalous desorption kinetics, evident as a surface dwell time that exhibits a power-law distribution, i.e. a heavy-tailed rather than the expected exponential distribution. As a direct consequence of this heavy-tailed distribution, the average desorption rate depends upon the time scale of the experiment and the protein surface concentration does not reach equilibrium. Further analysis reveals that the observed anomalous desorption emerges due to the reversible formation of a small fraction of soluble protein multimers (small oligomers), such that each one desorbs from the surface with a different rate. The overall kinetics can be described by a series of elementary reactions, yielding simple scaling relations that predict experimental observations. This work reveals a mechanistic origin for anomalous desorption kinetics that can be employed to interpret observations where low-protein fouling surfaces eventually foul when in long-term contact with protein solutions. The work also provides new insights that can be used to define design principles for non-fouling surfaces and to predict their performance.
I Introduction
The interaction of proteins in solution with solid surfaces is a fundamental phenomenon of great importance in multiple scientific and engineering disciplines Ramsden (1995); Gray (2004); Rabe et al. (2011); Adamczyk (2012); Wei et al. (2014). From a life sciences perspective, adsorption and desorption of proteins at surfaces are key players in e.g. organ development, tissue repair, and blood clotting. In biomedical implants and devices, controlling or inhibiting irreversible protein adsorption has long been considered an important feature of biocompatible materials and biosensor surfaces Latour (2005); Fang et al. (2005); Wei et al. (2014); Hedayati et al. (2019). When a biomedical device such as a catheter, or an implant such as a stent or artificial knee comes in contact with body fluids, it is exposed to a myriad of proteins apt to adsorbing into the foreign material and rapidly modifying the surface chemistry Bernard et al. (2018). This adsorbed protein layer can modulate subsequent biological phenomena including blood clotting, bacterial adhesion, and inflammation, which can lead, for example, to failure of blood-contacting medical devices, fouling of contact lenses, and deterioration of biosensor sensitivity. Many industrial technologies also rely on controlled protein adsorption for processes related to protein purification, drug delivery systems, food packaging and storage, and biosensing Ramsden (1995); Firkowska-Boden et al. (2018).
Human serum albumin (HSA), the most abundant protein in blood plasma, and its analogue bovine serum albumin (BSA) have been studied extensively as model systems for protein adsorption at solid-liquid interfaces. In blood, albumin is responsible for maintaining osmotic pressure Hankins (2006). In the female cervical fluid, it represents of the total protein Tjokronegoro and Sirisinha (1975) and it is necessary for sperm to acquire the ability to fertilize an egg Visconti et al. (2011). Several classes of drugs also depend on albumin for binding and transport, including antibiotics, anticoagulants, and anti-inflammatory drugs, and albumin is emerging as a drug carrier in the treatment of diabetes and cancer Kratz (2014). Further, albumin is used as a blocking agent in immunoassays and for coating medical devices to suppress the adhesion of other proteins and bacteria Brokke et al. (1991). The adsorption of albumin on solid interfaces has been studied for multiple substrates including micaAdamczyk et al. (2018), silica Malmsten (1994); Wasilewska et al. (2019), functionalized gold nanoparticles Dominguez-Medina et al. (2016), and model surfaces of varying hydrophobicity Wertz and Santore (2001). These studies have typically focused on mass transfer, maximum protein coverage, and the reversibility of protein adsorption. The activation energies for desorption and diffusion have also been investigated in both hydrophobic and hydrophilic surfaces Langdon et al. (2012). Mathematical models of different complexities have been developed to explain experimental observations Rabe et al. (2011); Kim (2018); Adamczyk et al. (2018).
A key feature of irreversible adsorption onto solid surfaces involves surface-induced protein fouling. Thus, a great deal of effort has been placed in the design and characterization of advanced materials to impart protein resistance Wei et al. (2014); Selim et al. (2017); Hedayati et al. (2018); Chen et al. (2019). Besides their critical applications in biomaterials, low-fouling surfaces are routinely used in single-molecule biophysics research Roy et al. (2008). The most widely used and best characterized strategy to impart protein resistance to a surface consists of coating it with a polyethylene glycol (PEG) brush Banerjee et al. (2011). Experimental evidence shows that the mechanisms of protein interactions with PEG surfaces are highly complex with non-trivial dependence on grafting density Faulón Marruecos et al. (2016). While many studies focus specifically on the rate of surface adsorption, the study of protein desorption from low-fouling surfaces is still lacking detailed understanding.
Adsorption and desorption processes are most often quantified in terms of the respective kinetic coefficients and Fang et al. (2005). This analysis enables experiments to be interpreted using a basic kinetic equation
| (1) |
where is the adsorbed protein surface density and the adsorption kinetic coefficient is proportional to the bulk protein concentration. This simple kinetic model is expected to predict valid results for low surface occupancy so that blocking effects can be neglected and both the density of available surface sites and the protein solution concentration do not change substantially during observation times. Eq. (1) is often sufficient to interpret short-term protein adsorption and predicts that surface concentration will converge exponentially to a constant value () with a characteristic time constant . However, it often fails to predict long-term (more than min) surface kinetics. The failure of the kinetic equation (Eq. (1)) is sometimes ascribed to a deterioration of the non-fouling behavior due to various effects such as oxidation of the surface or the Vroman effect for complex protein mixtures Noh and Vogler (2007).
In this article, we study the kinetics of BSA on a PEG brush-coated surface. The kinetics are characterized in detail by employing single-molecule detection. Desorption from the surface is observed to exhibit anomalous behavior that is manifested as a power-law distribution in the surface dwell times. This behavior can be accurately explained by considering that there is a finite probability for the molecules in solution to reversibly self-associate. A simple model considering an equilibrium concentration of multimers in solution and a desorption rate that depends on the number of monomers in the adsorbed particle is proposed to explain our results. The predictions from this model are solved semi-analytically and are validated using two different surfaces.
II Materials and Methods
II.1 Materials
PEG silane (-[methoxy(polyethyleneoxy)-propyl] trimethoxysilane), MW Da, was purchased from Gelest (Morrisville, PA). -Mercaptoethanol, catalase from bovine liver, and glucose oxidase were purchased from Sigma Aldrich (St. Louis, MO). Anhydrous toluene was purchased from MilliporeSigma (Burlington, MA). BSA conjugated to Alexa Fluor (degree of labeling: ) and ethanol ( proof +%) were purchased from Thermo Fisher Scientific (Waltham, MA). M cm water from a Millipore water purification unit was used for making all aqueous solutions.
II.2 Preparation of PEG brush surfaces
Surfaces functionalized with PEG brushes were constructed via a grafting-to approach Ionov et al. (2009); Faulón Marruecos et al. (2016). Prior to functionalization, fused silica wafers were thoroughly washed with acetone, ethanol, and deionized water and dried with ultrapure N2. Wafers were then exposed to oxygen plasma (Plasma Etch, Carson City, NV) for min. The substrates were subsequently incubated in % v/v PEG silane dissolved in anhydrous toluene. The reaction was performed at room temperature for min to construct PEG brush surfaces. Finally, surfaces were rinsed multiple times with toluene and deionized water and dried with ultrapure N2. The higher grafting density surfaces were made by incubating the PEG solution for hour instead of min.
II.3 PEG characterization
The thickness of the dry brush was measured by ellipsometry. For this purpose PEG brushes were constructed on Si wafers using the same protocol described above. p-doped - -cm Si wafers were purchased from MSE Supplies (Tucson, AZ). Ellipsometry was performed using a J.A. Woollam variable angle spectroscopic ellipsometer (model VASE-VB-250) and data analysis was done using the J. A.Woollam WVASE32 software package. Each surface was spectrally scanned with an incident angle between , in increments of 5∘, over a wavelength range of nm. The collected spectra were fit to a three-layer planar model of the solid surface, which accounts for the refractive index of air (), PEG (), silicon oxide layer (), and silicon () . The dry PEG brush thickness was obtained and subsequently related to grafting density where is the dry density of the PEG monomer repeat unit ( g/cm3), is Avogadro’s number, and is the average molecular weight of the PEG polymer (500 Da). For each surface preparation, dry thickness was measured on three different samples and on two different spots in each sample. The resulting grafting density was nm-2. The density of the high grafting density PEG was found to be nm-2.
II.4 Imaging buffer
Imaging was performed in a buffer consisting of mM Tris-HCl (pH ), mM NaCl, % glucose, mg mL-1 glucose oxidase, 34 g mL-1 catalase, and % -mercaptoethanol. This buffer includes an enzymatic oxygen scavenging system to increase fluorophore stability Roy et al. (2008); Hedayati et al. (2020). BSA was added to the imaging buffer to a final concentration of 5 nM.
II.5 Imaging
Images were acquired by time-lapse imaging using Nikon NIS-Elements software in an objective-type total internal reflection fluorescence (TIRF) custom-built microscope equipped with an Olympus PlanApo NA objective and a CRISP ASI autofocus system Campagnola et al. (2015). The optical aberrations of the imaging system were corrected using a MicAO 3DSR adaptive optics system (Imagine Optic, Orsay, France) inserted into the emission pathway between the microscope and the EMCCD camera Gervasi et al. (2018). Namely, we used the adaptive optics system to correct for astigmatism, coma, trefoil, and spherical aberrations. In general, optical elements in the emission path inside the microscope introduce different aberrations that compromise the symmetry of the point spread function. The correction of these aberrations leads to improved localization precision Clouvel et al. (2013). Fluorophores were excited with a -nm laser (DL638-328 050, CrystaLaser, Reno, NV). For excitation, an optical density filter with ND= was used and an incident angle above the critical angle was employed. Emission was collected through the appropriate Semrock bandpass filters and the images were acquired in a water-cooled, back-illuminated EMCCD camera (iXon DU-, Andor, Belfast, UK) liquid-cooled to C with an electronic gain of . In order to avoid photobleaching and allow for longer imaging, time-lapsed imaging was used whereby an image was obtained every s over a total period of frames. Exposure time in each frame was limited to ms using an Uniblitz high-speed optical shutter synchronized with the camera acquisition.
II.6 Single-molecule detection
Detection and tracking of individual molecules were performed in MATLAB using the u-track algorithm Jaqaman et al. (2008). The localization precision is governed by the number of detected photons. In our data, the estimated mean localization precision is found to be 10 nm.
II.7 Measurements of Stokes hydrodynamic radius
BSA size was measured by dynamic light scattering (DLS) using a Zetasizer Nano ZS (Malvern) with a nm laser line. Samples were prepared and measured after the solution equilibrated for min, and the same solution was again measured after min. The time-dependent fluctuations of the back-scattered light was measured at a fixed angle of in an avalanche photodiode. Samples were maintained at C in imaging buffer solution. Acquisition time was set to s. The intensity autocorrelation functions were analyzed using the Zetasizer Software v.7.13 (Malvern). The same software was used to estimate the viscosity for mM Tris HCl, mM NaCl aqueous solution at C: mPa s. The distribution of diffusion coefficients was directly obtained from the intensity autocorrelation function, which was transformed into a distribution of hydrodynamic radii using the Stokes-Einstein relation,
| (2) |
where is thermal energy and is the solution viscosity. Three independent runs were collected for each sample and the obtained distributions of radii were then averaged.
Zeta potential of BSA at pH was also obtained via laser Doppler velocimetry in the same Zetasizer Nano ZS instrument. Here, a voltage of V was applied between electrodes at the edge of the cell separated by mm and the protein electrophoretic mobility is measured. The zeta potential was obtained from Henry’s equation Jachimska et al. (2008). We found the zeta potential of BSA to be mV.
III Results and discussion
To accurately quantify protein adsorption and desorption on PEG-coated surfaces, we imaged individual fluorescently labeled BSA by total internal reflection fluorescence (TIRF) microscopy. Proteins were diluted to low concentrations ( nM) in imaging buffer to enable single-molecule detection as they adsorb to and desorb from the solid-liquid interface. The protein solution was allowed to equilibrate for at least 1 hour and then the solution was injected into a chamber that has been constructed with one surface consisting of a coverslip functionalized with PEG brushes. The chamber does not let water evaporate, so that protein concentration in solution is constant for the duration of the experiment. Immediately following injection of the solution, the microscope was focused on the surface, and then time-lapse microscopy videos were collected for 100 min (3000 frames). Even though the imaging time is long, the concentration of labeled proteins in solution is not expected to change substantially because imaging is done in TIRF and, as a consequence, photobleaching only affects proteins on the surface. Further, care is taken to reduce photobleaching by means of time-lapse imaging and using an oxygen scavenging buffer Hedayati et al. (2020).
The inset in Fig. 1(a) shows a representative adsorbed BSA image. Individual fluorophores are clearly visible above the fluorescent background, making it easy to detect the exact moments of adsorption and desorption from the surface. Adsorbed BSA molecules are observed to be immobile on the PEG surface. Supplemental Fig. S1† shows the distribution of displacements within the trajectories of the molecules on the surface both for lag times of a single frame and frames. The distributions of displacements in and frames are indistinguishable and they are governed solely by the localization error. Several groups have previously shown that a highly effective mode of surface mobility can be induced by a process known as bulk-mediated diffusion Bychuk and O’Shaughnessy (1994); Chechkin et al. (2012); Skaug et al. (2013); Rojo et al. (2013); Weltz et al. (2015); Campagnola et al. (2015); Berezhkovskii et al. (2015); Krapf et al. (2016). In this case, molecules hop between binding sites by desorbing from one site, diffusing in the bulk, and readsorbing to a different site Knight and Falke (2009); Yu et al. (2013); Skaug et al. (2014). This effect definitely takes place for BSA dynamics, but we do not probe it for two reasons: First, the density of labeled proteins on the surface is too high to accurately distinguish between a hopping event and the adsorption of a different molecule. Second, we are primarily interested in the desorption kinetics, thus we do not investigate bulk-mediated diffusion here.
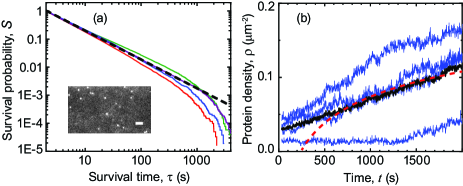
Our single-molecule assay allows an evaluation of the kinetic model because both and can be directly measured. In particular, Eq. (1) predicts the average dwell time for an adsorbed particle on the surface to be and the dwell times themselves to be random variables drawn from an exponential distribution . Fig. 1(a) shows the survival probabilities, of BSA molecules on four independent PEG surfaces at the same conditions,
| (3) |
Contrary to the expectations from the simple kinetic model (Eq. (1)), the survival probability does not decay exponentially. Counterintuitively, it decays as a power law up to a timescale of the order of s. Namely, the survival probability is observed to scale as with . An interesting outcome of distributions with a power-law tail is that they lack a characteristic time. In contrast, the apparent desorption rate depends on the time that has lapsed since the system was prepared Schulz et al. (2014); Krapf and Metzler (2019) (in our case, since the solution came in contact with the surface). In systems exhibiting heavy-tail distributions, the mean dwell time diverges and a high degree of complexity is expected Stefani et al. (2009); Jeon et al. (2011); Weron et al. (2017).
After s, the survival probability decays rapidly due to photobleaching. The characteristic photobleacing time depends on the total time the protein was exposed to laser excitation. Supplemental Fig. S2† shows the survival probability obtained from imaging without time-lapse video (i.e., fluorophores are continuously exposed to laser excitation) and using a faster frame rate of frames/sec. Note that in Fig. 1(a), fluorophores were only excited during ms every 2-s frame. Under continuous illumination the photobleaching decay is observed to occur much earlier. The photobleaching decay function is discussed in the Supplementary Information†Ḃy probing shorter times we also find faster kinetics with the same power-law tail distribution.
The observed anomalous desorption kinetics implies that Eq. (1) does not hold and the protein surface density should not reach a steady state within this long timescale, but it should instead increase with time. The surface dwell time (i.e., the desorption time) is given by Eq. (3) as . We can write a recurrence relation for the occupation probability of an individual surface site,
| (4) |
where is the probability of the site being empty at time , with , and is the area of a single site. The first term on the right part of Eq. (4) has the same meaning as the adsorption in Eq. (1) and the second term accounts for a particle being adsorbed at an earlier time and desorbing at time . This recurrence relation is more rigorous than Eq. (1) because it relaxes two approximations. The first one is that blocking effects are not necessarily neglected and an adsorbed protein can block the adsorption of a new protein. Nevertheless, if the adsorption sites are small enough, blocking effects are still negligible. The second and more important one for this work is that the dwell time of a protein on the surface is not necessarily exponential, i.e., the process is not assumed to be Markovian. The physical meaning of the area of an individual site in this model is not trivial a priori. In broad terms, a single site consists of the space available for binding one protein. This space can be either the inverse density of surface defects (if proteins are expected to bind onto defects), or the area covered by a single particle (if proteins can equally adsorbed anywhere on the surface), which depends only on the nature of the surface-particle interactions.
It is possible to solve for by use of Laplace transform, which yields (see supplementary information† for mathematical derivation). Note that, assuming again low surface occupation, the surface density is proportional to the probability of occupation of a single site and thus
| (5) |
where . Fig. 1(b) shows the density of surface proteins as a function of time for 2000 s in four replicate experiments. The protein density increases with time without reaching a steady state.
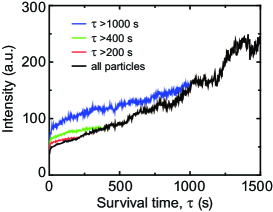
A power-law tail in the dwell times can emerge from two different scenarios Krapf (2015): (1) A non-stationary process where after capture, the trap strength becomes stronger with time and the particle probability of escape decreases Weigel et al. (2013) and (2) a heterogeneous process involving traps of varying depths Scher and Montroll (1975); Sokolov et al. (2009); Burov et al. (2011); Krapf (2013); Krapf and Metzler (2019). We are able to untangle these effects by measuring the fluorescence intensity of adsorbed particles as a function of the time that lapsed since protein adsorption. We find that a heterogeneous process provides the correct interpretation. The key idea behind this measurement lies in the fact that a protein aggregate will be bound more strongly to the surface than a single monomer while at the same time it will exhibit brighter fluorescence emission. We do not find evidence for an heterogeneous surface in our data, but intrinsic surface heterogeneities are possible and they would further increase the complexity of the interfacial interactions Langdon et al. (2015). Note that while different protein conformations also lead to heterogeneous binding properties, they are not expected to give rise to different fluorescence intensities. Fig. 2 shows, as a black line, the average fluorescence intensity for all particles as a function of the time they spent on the surface. The average intensity increases with time since adsorption. The figure also shows in red, green, and blue the average intensities for the particle that survived on the surface at least , , and s, respectively. Interestingly, the particles that survived longer times on the surface were brighter since the time of adsorption. This result suggests that molecules form aggregates in solution and then they bind to the surface. Note that, e.g. for particles that survive longer than s, an increase is also seen up to 1000 s, suggesting that surface-mediated cluster growth can also take place. Previous DLS evidence has also shown that BSA suspensions (as well as HSA) contain a significant fraction of protein dimers Jachimska et al. (2008). The diffusion of BSA at oil-water interfaces has also revealed the presence of BSA dimers and trimers Walder and Schwartz (2010).
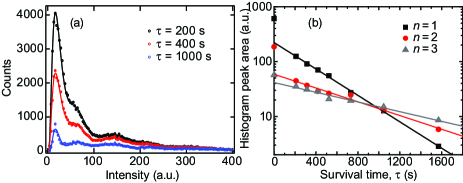
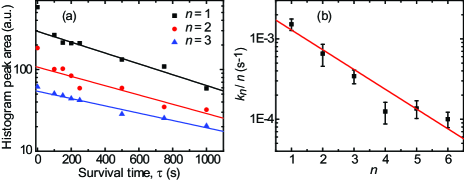
The histogram of particle intensities (Fig. 3(a)) displays several well-differentiated peaks, in agreement with our hypothesis that particles with different numbers of BSA proteins are found on the surface. We observe an intensity peak for single proteins () and peaks for dimers (), trimers (), etc. We speculate the first peak (lowest intensity) corresponds to monomers, the second to dimers, etc. Following the same methodology we employed above, we measure the intensity histograms of particles that dwell on the surface for times longer than . Three different histograms are shown as examples in Fig. 3(a), corresponding to , , and s. While the overall survival probability of adsorbed particles decays as a power law, the survival probability of each of the different peaks decay exponentially, albeit with different characteristic times (Fig. 3(b)).
Because particles with longer dwell times are brighter and fluorescent particles on the surface have well-defined discrete intensities, we postulate a simple model where proteins in solution can aggregate into clusters. Classical biochemistry usually considers that proteins unfold when they aggregate. However, unfolding is irreversible for practical purposes and particles would sediment out of the liquid phase. Using dynamic light scattering, we verify that the measured protein hydrodynamic radius is in steady state. Supplemental Fig. S3a† shows the measured distribution of hydrodynamic radii for a freshly prepared BSA solution and for a solution allowed to settle for a period of minutes. Both distributions are indistinguishable, which provides evidence that the solution is in equilibrium and irreversible aggregation does not take place in the bulk phase over the timescale of our experiments. Given that the solution is in equilibrium, we assume particles can reversibly self-associate into soluble multimers Cromwell et al. (2006); Erickson (2019), and that the distribution of the number of proteins ( monomers) in a multimer, , follows a Boltzmann distribution. The addition of an extra protein to a cluster requires a free energy . Thus, with being the characteristic number of molecules in a particle (a cluster) in solution †.
Once the particle is on the surface, each constituent monomer has the same probability of association to and dissociation from the surface. Thus, at a given time, any number of monomers between and can be associated to the surface,
| (6) |
where and are the monomer dissociation and association rates, is a state with monomers bound to the surface and represents a protein that has completely dissociated from the surface. Under the approximation , reaction (6) has the asymptotic long time solution for the probability of being in state , given monomers in a particle,
| (7) |
where is an effective desorption rate coefficient given by
| (8) |
for any initial condition between the states and (see supplementary information† for mathematical derivation).
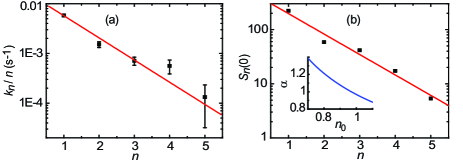
The survival probability for a multimer of monomers describes the probability that the particle has not yet reached state . Thus, . This predicted behavior is in excellent agreement with the exponential decays of the different intensity peaks (Fig. 3(b)). Further, the rate is observed to obey the predicted behavior as in Eq. (8) (Fig. 4(a)). This measurement yields and . Besides allowing the computation of , an extrapolation of the intensity peaks to yields the fraction of molecules in each state, i.e., the fraction of single monomers , dimers , trimers , etc., that bind to the surface. Fig. 4b shows that these fractions are in good agreement with our assumption of a Boltzmann distribution for the number of monomers within a particle in solution, where the characteristic number of monomers is found from these data to be .
How does a power-law tail in the surface dwell time distribution emerge? Even though the dwell times of particle of a given number of monomers are exponentially distributed, the asymptotic dwell times of a particle of unknown can have a power-law form. Namely, the survival probability is
| (9) |
We analyzed this function numerically and found that, at long times, it converges to a power-law tail (Supplemental Fig. S4†) for a wide range of , , and parameters. A systematic numerical analysis of Eq. (9) reveals with
| (10) |
where is a constant and is a monotonically increasing function (Supplemental Fig. S5†). Note that only depends on the dissociation/association rates ( and ) via their ratio. By setting as found from Fig. 4(a), we obtain the dependence of on the characteristic number of monomers in a particle, (inset of Fig. 4(b)). An anomalous exponent (as obtained for the tail of the survival probability) is found for . This value is in surprisingly good agreement with the value from the relative magnitude of the intensity peaks (Fig. 4(b)).
The observed anomalous surface dynamics is well described by an heterogeneous protein solution with the heterogeneity being rooted in the proteins forming aggregates in thermodynamic equilibrium. This model predicts that the distribution of particle sizes in solution, when measured from dynamic light scattering (DLS) or sedimentation velocity Harding (1995), should have the same signature of multimers following a Boltzmann distribution. Supplemental Fig. S3b† shows the polydispersity of the sample as obtained from DLS measurements. The distribution of hydrodynamic radii exhibits a long tail as expected from an heterogeneous population. By employing a Boltzmann distribution for particle sizes, , as before, the distribution of hydrodynamic radii can be decomposed into a series of Gaussian peaks. Namely, we approximate aggregates of monomers as a sphere of volume , where is the volume of a monomer. Thus, the radius of a cluster is . From the Boltzmann distribution, the concentration ratio between a multimer of size and that of a multimer of size is
| (11) |
Therefore, the probability density function (PDF) of radii can be modeled by a series of Gaussian functions with equal width given by the instrument accuracy,
| (12) |
where and are the peak magnitude and radius of the first peak, i.e., those of the monomer. In agreement with the predictions of our model, a least square fitting of the radius distribution yields a ratio , or a characteristic number of molecules of molecules in a cluster, .
Only two parameters are responsible for the anomalous kinetics behavior: the tendency of proteins in solution to oligomerize, described by the characteristic number of monomers in a single particle, and the ratio between adsorption and desorption rates of a single monomer within a particle on the surface. In order to evaluate our findings on a different set of parameters, we modified the PEG conditions to yield a different adsorption/desorption ratio. Specifically, we prepared a new PEG brush surface with a higher grafting density. While the original PEG surface had an average grafting grafting density of chains/nm2, the modified surface had an average density of chains/nm2, as measured by ellipsometry. The multimer model was also found to be in good agreement with the measured kinetics in this surface. A multimodal population was detected in the histogram of particle fluorescent intensity and each peak decayed exponentially with time (Fig. 5(a)). The rate of release from the surface was also observed to obey the behavior predicted by Eq. (8) (Fig. 5(b)) and the survival probability exhibits power-law behavior (Supplemental Fig. S6† ). However, in this case the ratio between monomer binding and unbinding was different than previously found for the low density PEG surface. In this case we obtained , which does not allow us to use the small approximation. Thus, a model without this approximation is evaluated in this case (Supplemental Fig. S7†).
IV Conclusions
In order to analyze the adsorption and desorption kinetics on low-fouling surfaces, we studied the kinetics of BSA on PEG-coated silica surfaces. Our experimental data show that the release from the surface is not governed by an intuitive constant desorption rate and as a consequence, the distribution of dwell times on the surface is not exponential. Conversely, the dwell times are drawn from a power-law distribution,causing the apparent desorption rate to depend on the measurement time. This anomalous kinetics is found to be rooted in multimers being reversibly formed in solution, where each multimer has a desorption rate that depends on the number of monomers. Detailed understanding of mechanisms of protein accumulation on low-fouling surfaces is essential for design of the next generation of protein resistant surfaces. The model presented in this work describing anomalous desorption kinetics can explain experimental observations of accumulation of proteins on low-fouling surfaces.
Acknowledgements
We thank Xinran Xu for technical assistance with imaging. This work was supported by the National Science Foundation (award number 1511830).
References
- Ramsden (1995) J. J. Ramsden, Chem. Soc. Rev., 1995, 24, 73–78.
- Gray (2004) J. J. Gray, Curr. Opin. Struct. Biol., 2004, 14, 110–115.
- Rabe et al. (2011) M. Rabe, D. Verdes and S. Seeger, Adv. Colloid Interface Sci., 2011, 162, 87–106.
- Adamczyk (2012) Z. Adamczyk, Curr. Opin. Colloid Interface Sci., 2012, 17, 173–186.
- Wei et al. (2014) Q. Wei, T. Becherer, S. Angioletti-Uberti, J. Dzubiella, C. Wischke, A. T. Neffe, A. Lendlein, M. Ballauff and R. Haag, Angew. Chem. Int. Ed. Engl., 2014, 53, 8004–8031.
- Latour (2005) R. A. Latour, in Encyclopedia of Biomaterials and Biomedical Engineering, ed. G. L. Bowlin and G. Wnek, CRC Press, 2005, vol. 1, pp. 270–284.
- Fang et al. (2005) F. Fang, J. Satulovsky and I. Szleifer, Biophys. J., 2005, 89, 1516–1533.
- Hedayati et al. (2019) M. Hedayati, M. J. Neufeld, M. M. Reynolds and M. J. Kipper, Mater. Sci. Eng. R Rep., 2019, 138, 118–152.
- Bernard et al. (2018) M. Bernard, E. Jubeli, M. D. Pungente and N. Yagoubi, Biomater. Sci., 2018, 6, 2025–2053.
- Firkowska-Boden et al. (2018) I. Firkowska-Boden, X. Zhang and K. D. Jandt, Adv. Healthc. Mater., 2018, 7, 1700995.
- Hankins (2006) J. Hankins, J. Infusion Nursing, 2006, 29, 260–265.
- Tjokronegoro and Sirisinha (1975) A. Tjokronegoro and S. Sirisinha, Fertil. Steril., 1975, 26, 413–417.
- Visconti et al. (2011) P. E. Visconti, D. Krapf, J. L. De La Vega-Beltrán, J. J. Acevedo and A. Darszon, Asian J. Androl., 2011, 13, 395.
- Kratz (2014) F. Kratz, J. Control. Release, 2014, 190, 331–336.
- Brokke et al. (1991) P. Brokke, J. Dankert, J. Carballo and J. Feijen, J. Biomater. Appl., 1991, 5, 204–226.
- Adamczyk et al. (2018) Z. Adamczyk, M. Nattich-Rak, M. Dabkowska and M. Kujda-Kruk, J. Colloid Interface Sci., 2018, 514, 769–790.
- Malmsten (1994) M. Malmsten, J. Colloid Interface Sci., 1994, 166, 333–342.
- Wasilewska et al. (2019) M. Wasilewska, Z. Adamczyk, A. Pomorska, M. Nattich-Rak and M. Sadowska, Langmuir, 2019, 35, 2639–2648.
- Dominguez-Medina et al. (2016) S. Dominguez-Medina, L. Kisley, L. J. Tauzin, A. Hoggard, B. Shuang, A. S. D. S. Indrasekara, S. Chen, L.-Y. Wang, P. J. Derry, A. Liopo, E. R. Zubarev, C. F. Landes and S. Link, ACS Nano, 2016, 10, 2103–2112.
- Wertz and Santore (2001) C. F. Wertz and M. M. Santore, Langmuir, 2001, 17, 3006–3016.
- Langdon et al. (2012) B. B. Langdon, M. Kastantin and D. K. Schwartz, Biophys. J., 2012, 102, 2625–2633.
- Kim (2018) J. Kim, Colloids Surf. B: Biointerfaces, 2018, 162, 370–379.
- Selim et al. (2017) M. S. Selim, M. Shenashen, S. A. El-Safty, S. Higazy, M. M. Selim, H. Isago and A. Elmarakbi, Prog. Mater. Sci., 2017, 87, 1–32.
- Hedayati et al. (2018) M. Hedayati, M. M. Reynolds, D. Krapf and M. J. Kipper, ACS Appl. Mater. Interfaces, 2018, 10, 31892–31902.
- Chen et al. (2019) Q. Chen, S. Yu, D. Zhang, W. Zhang, H. Zhang, J. Zou, Z. Mao, Y. Yuan, C. Gao and R. Liu, J. Am. Chem. Soc., 2019, 141, 16772–16780.
- Roy et al. (2008) R. Roy, S. Hohng and T. Ha, Nat. Methods, 2008, 5, 507.
- Banerjee et al. (2011) I. Banerjee, R. C. Pangule and R. S. Kane, Adv. Mater., 2011, 23, 690–718.
- Faulón Marruecos et al. (2016) D. Faulón Marruecos, M. Kastantin, D. K. Schwartz and J. L. Kaar, Biomacromolecules, 2016, 17, 1017–1025.
- Noh and Vogler (2007) H. Noh and E. A. Vogler, Biomaterials, 2007, 28, 405–422.
- Ionov et al. (2009) L. Ionov, A. Synytska, E. Kaul and S. Diez, Biomacromolecules, 2009, 11, 233–237.
- Hedayati et al. (2020) M. Hedayati, D. Faulón Marruecos, D. Krapf, J. L. Kaar and M. J. Kipper, Acta Biomater., 2020, 102, 169–180.
- Campagnola et al. (2015) G. Campagnola, K. Nepal, B. W. Schroder, O. B. Peersen and D. Krapf, Sci. Rep., 2015, 5, 17721.
- Gervasi et al. (2018) M. G. Gervasi, X. Xu, B. Carbajal-Gonzalez, M. G. Buffone, P. E. Visconti and D. Krapf, J. Cell Sci., 2018, 131, jcs215897.
- Clouvel et al. (2013) G. Clouvel, A. Jasaitis, J. Sillibourne, I. Izeddin, M. El Beheiry, X. Levecq, M. Dahan, M. Bornens and X. Darzacq, Proc. SPIE, 2013, p. 85900Z.
- Jaqaman et al. (2008) K. Jaqaman, D. Loerke, M. Mettlen, H. Kuwata, S. Grinstein, S. L. Schmid and G. Danuser, Nat. Methods, 2008, 5, 695.
- Jachimska et al. (2008) B. Jachimska, M. Wasilewska and Z. Adamczyk, Langmuir, 2008, 24, 6866–6872.
- Bychuk and O’Shaughnessy (1994) O. V. Bychuk and B. O’Shaughnessy, J. Chem. Phys., 1994, 101, 772–780.
- Chechkin et al. (2012) A. V. Chechkin, I. M. Zaid, M. A. Lomholt, I. M. Sokolov and R. Metzler, Phys. Rev. E, 2012, 86, 041101.
- Skaug et al. (2013) M. J. Skaug, J. Mabry and D. K. Schwartz, Phys. Rev. Lett., 2013, 110, 256101.
- Rojo et al. (2013) F. Rojo, C. E. Budde Jr, H. S. Wio and C. E. Budde, Phys. Rev. E, 2013, 87, 012115.
- Weltz et al. (2015) J. S. Weltz, D. K. Schwartz and J. L. Kaar, ACS Nano, 2015, 10, 730–738.
- Berezhkovskii et al. (2015) A. M. Berezhkovskii, L. Dagdug and S. M. Bezrukov, J. Chem. Phys., 2015, 143, 084103.
- Krapf et al. (2016) D. Krapf, G. Campagnola, K. Nepal and O. B. Peersen, Phys. Chem. Chem. Phys., 2016, 18, 12633–12641.
- Knight and Falke (2009) J. D. Knight and J. J. Falke, Biophys. J., 2009, 96, 566–582.
- Yu et al. (2013) C. Yu, J. Guan, K. Chen, S. C. Bae and S. Granick, ACS Nano, 2013, 7, 9735–9742.
- Skaug et al. (2014) M. J. Skaug, A. M. Lacasta, L. Ramirez-Piscina, J. M. Sancho, K. Lindenberg and D. K. Schwartz, Soft Matter, 2014, 10, 753–759.
- Schulz et al. (2014) J. H. Schulz, E. Barkai and R. Metzler, Phys. Rev. X, 2014, 4, 011028.
- Krapf and Metzler (2019) D. Krapf and R. Metzler, Phys. Today, 2019, 72, 48–55.
- Stefani et al. (2009) F. D. Stefani, J. P. Hoogenboom and E. Barkai, Phys. Today, 2009, 62, 34–39.
- Jeon et al. (2011) J. H. Jeon, V. Tejedor, S. Burov, E. Barkai, C. Selhuber-Unkel, K. Berg-Sorensen, L. Oddershede and R. Metzler, Phys. Rev. Lett., 2011, 106, 048103.
- Weron et al. (2017) A. Weron, K. Burnecki, E. J. Akin, L. Solé, M. Balcerek, M. M. Tamkun and D. Krapf, Sci. Rep., 2017, 7, 5404.
- Krapf (2015) D. Krapf, in Curr. Top. Membr., 2015, vol. 75, pp. 167–207.
- Weigel et al. (2013) A. V. Weigel, M. M. Tamkun and D. Krapf, Proc. Natl. Acad. Sci. U.S.A., 2013, 110, E4591–E4600.
- Scher and Montroll (1975) H. Scher and E. W. Montroll, Phys. Rev. B, 1975, 12, 2455.
- Sokolov et al. (2009) I. Sokolov, S. Yuste, J. Ruiz-Lorenzo and K. Lindenberg, Phys. Rev. E, 2009, 79, 051113.
- Burov et al. (2011) S. Burov, J.-H. Jeon, R. Metzler and E. Barkai, Phys. Chem. Chem. Phys., 2011, 13, 1800–1812.
- Krapf (2013) D. Krapf, Phys. Chem. Chem. Phys., 2013, 15, 459–465.
- Langdon et al. (2015) B. B. Langdon, R. B. Mirhossaini, J. N. Mabry, I. Sriram, A. Lajmi, Y. Zhang, O. J. Rojas and D. K. Schwartz, ACS Appl. Mater. Interfaces, 2015, 7, 3607–3617.
- Walder and Schwartz (2010) R. Walder and D. K. Schwartz, Langmuir, 2010, 26, 13364–13367.
- Cromwell et al. (2006) M. E. Cromwell, E. Hilario and F. Jacobson, AAPS J., 2006, 8, E572–E579.
- Erickson (2019) H. P. Erickson, in Principles of Protein-Protein Association, IOP Publishing, 2019, pp. 2–1 to 2–7.
- Harding (1995) S. E. Harding, Biophys. Chem., 1995, 55, 69–93.