The Quasar ULAS J1342+0928 Is Hosted by a Galaxy Merger
Abstract
We present ALMA () resolution observations of the [C II] m line and underlying dust continuum in the host galaxy of the most distant quasar currently known, ULAS J1342+0928 at . Both the [C II] and continuum are detected and spatially resolved. The [C II] line is 1.5 times more extended than the continuum emission, showing an elongated and complex structure of approximately . Two separate peaks are clearly seen ( each) in three 100 km s-1 width [C II] channel maps. The velocity field of the [C II] gas does not show evidence of a coherent rotation field but rather chaotic motion reminiscent of an ongoing merger.
1 Introduction
The host galaxies of high-redshift quasars are thought to be the most massive galaxies at the earliest cosmic epochs, and therefore provide important constraints on early galaxy formation and evolution models. The physical properties of these extreme galaxies can be studied in detail with existing (sub)millimeter facilities even within the first billion years of the universe (; see Carilli & Walter 2013 for a review). Pioneering works pushed the limits of facilities such as PdBI111Plateau de Bure Interferometer./NOEMA222NOrthern Extended Millimeter Array. and the VLA333Karl G. Jansky Very Large Array. to characterize the dust and the molecular and atomic gas in a handful of the brightest of these quasars (e.g., Bertoldi et al. 2003; Walter et al. 2004; Maiolino et al. 2005; Walter et al. 2009; Venemans et al. 2012; Bañados et al. 2015). These studies showed that early supermassive black hole growth can be accompanied by extended, intense star formation and large reservoirs of dense and enriched molecular gas.
The [C II] m fine-structure line (hereafter [C II]) is one of the brightest far-infrared lines in star-forming galaxies, and its frequency at is conveniently located in a high-transmission atmospheric window visible with millimeter facilities. To date, thanks to the advent of ALMA444Atacama Large Millimeter/submillimeter Array. more than 40 quasar host galaxies at have been detected in [C II] (e.g., Willott et al., 2017; Izumi et al., 2018; Decarli et al., 2018) and a handful of these objects have (sub)kiloparsec-resolution maps of their interstellar medium (e.g., Venemans et al. 2016, 2019; Wang et al. 2019; Neeleman et al. 2019). These high-resolution observations are exposing a diverse population. For example, recent kpc resolution ALMA [C II] imaging of the quasar ULAS J1120+0641 at revealed an extremely compact, unresolved (kpc) host galaxy that does not exhibit ordered motion on kiloparsec scales (Venemans et al., 2017a), in contrast to what is observed in other quasar hosts (e.g., Shao et al., 2017).
In this Letter we present kiloparsec-resolution observations of the [C II] line and underlying dust continuum of the host galaxy of the quasar ULAS J1342+0928 at (hereafter J1342+0928). In a companion paper we present a multiline ALMA survey of this quasar host galaxy, tracing various phases of its interstellar medium (Novak et al., 2019). This is the most distant quasar known to date and is powered by a supermassive black hole with 800 million times the mass of the sun (Bañados et al., 2018a). This system is being studied from X-rays to radio wavelengths (e.g., Bañados et al. 2018b; E. Momjian et al. 2019, in preparation). IRAM/NOEMA observations resulted in the detection of the [C II] line and dust from this quasar at , constraining the far-infrared luminosity of the quasar to . The NOEMA [C II] emission remained spatially unresolved with an upper limit on the diameter of 7 kpc (Venemans et al., 2017b).
We assume a standard, flat, -CDM cosmology with , , and . In this cosmology, at the universe was 680 Myr old and corresponds to a projected physical separation of 1 kpc.
2 Observations
We performed ALMA Band 6 observations to spatially resolve the [C II] line of J1342+0928. The observations were carried out on 2017 December 26 in the C43-6 array with a total on-source time of 114 minutes. The observations were tuned to cover 222.511 GHz, which corresponds to the frequency of the [C II] line (GHz) at the redshift of the quasar, , measured from NOEMA data (Venemans et al., 2017b). According to the ALMA documentation, the maximum recoverable scale555Defined as the largest angular size at which at least 10% of the total flux density of a uniform disk is recovered, and estimated using the 5th percentile of the sampled distances. of our observations is 3.
We used the default ALMA calibration pipeline implemented in the Common Astronomy Software Application package (CASA; McMullin et al., 2007) to calibrate the dataset666CASA calibration pipeline version 5.1.1-5. Visibilities were imaged with the tclean777CASA version 5.4.0-68 task using natural weighting to maximize the signal-to-noise (S/N) of our detection, and cleaning was performed down to inside a circle with a radius of centered at the source. The continuum was subtracted from visibilities with the task uvcontsub to facilitate imaging of the continuum-free data, such as the [C II] line channel and moment zero maps, as well as to obtain the pure continuum data. The imaged cube has a channel width of 50 km s-1, synthesized beam of , and an rms noise level of 0.1 mJy beam-1 for each channel. An additional cube with a broader channel width of 100 km s-1 (rms of 0.07 mJy beam-1) was imaged to assist in the analysis of the source morphology (Section 3.3). Data containing only the continuum were imaged yielding an rms value of 7.7 Jy beam-1 in the final map.

3 Results and discussion
3.1 [C II] spectrum
To maximize the recoverable [C II] emission spread over multiple beams, we extracted the spectrum using an aperture with a radius of (6.5 kpc), no further [C II] is recovered beyond this radius (see Figures in Appendix A of Novak et al. 2019). In order to properly measure flux density of a resolved source we applied the residual scaling method, which mitigates the issue of ill-defined units in interferometric maps (see Appendix A in Novak et al. 2019; and also Jorsater & van Moorsel 1995; Walter & Brinks 1999 for further details). The correct flux measurement is equal to , where is the clean-to-dirty beam area ratio, and , , and are aperture fluxes measured inside the dirty map, clean components only map, and the residual map, respectively. The scaling factor depends on the dirty beam shape and the size of the aperture used, and in our case is . In other words, we measure the flux in the dirty map and scale it by , which ensures that the final flux density units are properly defined. If we measured the total aperture flux in the final map, which is a combination of the clean Gaussian components on top of the residual, we would have obtained 1.25–1.8 larger values. The exact difference changes from channel to channel due to varying contributions from the clean and the dirty flux present inside the aperture. The extracted spectrum is shown in Figure 1 and a Gaussian fit results in the integrated [C II] line flux of Jy km s-1, FWHM of km s-1, and a redshift of . Recently, there has been growing evidence for significant velocity differences between the emission lines of the highest-redshift quasars (e.g., Mazzucchelli et al., 2017; Meyer et al., 2019). Our ALMA data imply that the Mg II emission arising from the broad-line region of the quasar is blueshifted by with respect to the systemic redshift of the host galaxy traced by [C II]. These measurements are consistent with the values reported in the lower-resolution NOEMA data (Venemans et al., 2017b), and we use their published redshift value throughout the paper for consistency. We note that the limitation of the maximum recoverable scale applies to smooth large-scale structures only. Patchy flux distribution within the aperture can still be accumulated. The agreement between our ALMA spectrum and the low-resolution () NOEMA spectrum (see Fig. 1) demonstrates that we do not miss significant flux with our aperture choice.
3.2 Continuum and [C II] maps
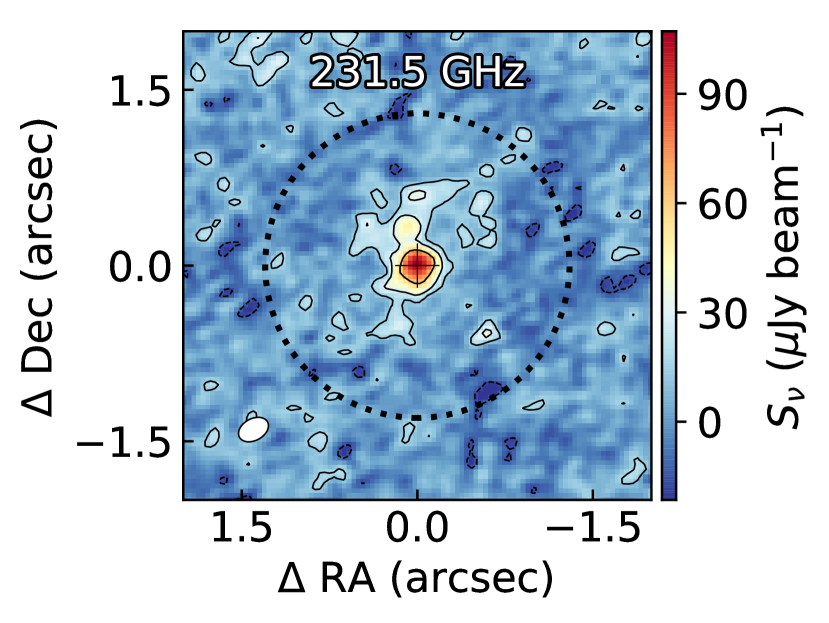
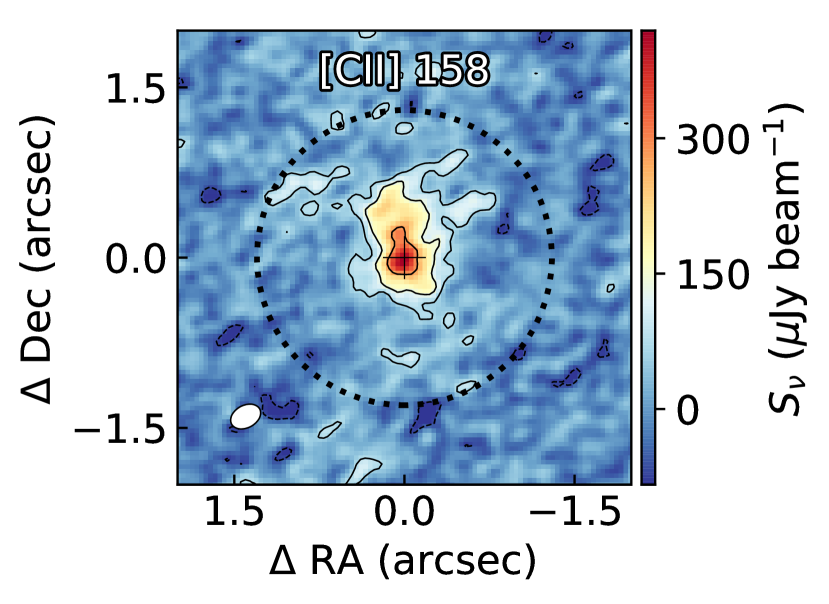
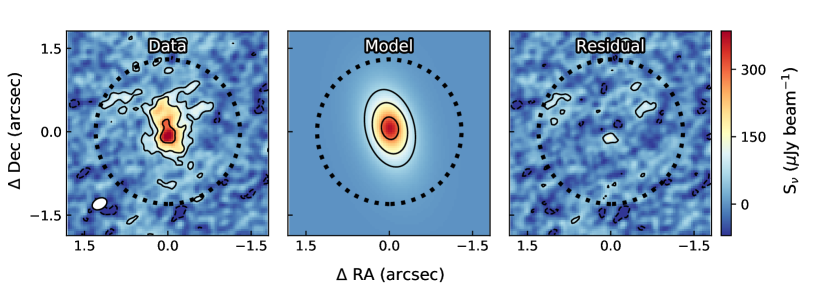
We imaged the line-free channels (effective bandwidth of 6.6 GHz) to create the dust continuum map at 231.5 GHz shown in the left panel of Figure 2, from which we measure a flux density of mJy in a circular aperture of radius , i.e., the same aperture used for the [C II] spectrum shown in Figure 1. We also imaged a moment zero [C II] map over a 455 km s-1 wide range, shown in the right panel of Figure 2. This width corresponds to the 1.2FWHM measured in the low-resolution NOEMA data (Venemans et al., 2017b), which was chosen to maximize the S/N of a Gaussian line detection888Choosing the FWHM of 318 km s-1, which we measure in our ALMA spectrum, yields consistent results within the uncertainties..
Although the integrated spectrum does not show evident deviations from a simple Gaussian profile (Figure 1), the morphology and kinematics of this system are complex. The continuum and [C II] emission are both spatially resolved with approximate sizes of and , respectively (Figure 2). The peak of the continuum emission at (ICRS) is consistent with the peak of the [C II] emission as well as the near-infrared -band position, within the uncertainty of 50 mas.
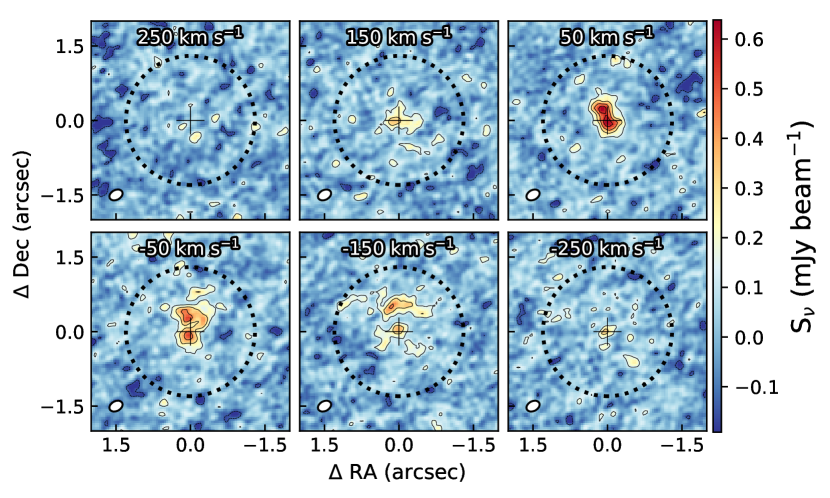
3.3 Kinematics: Channel maps
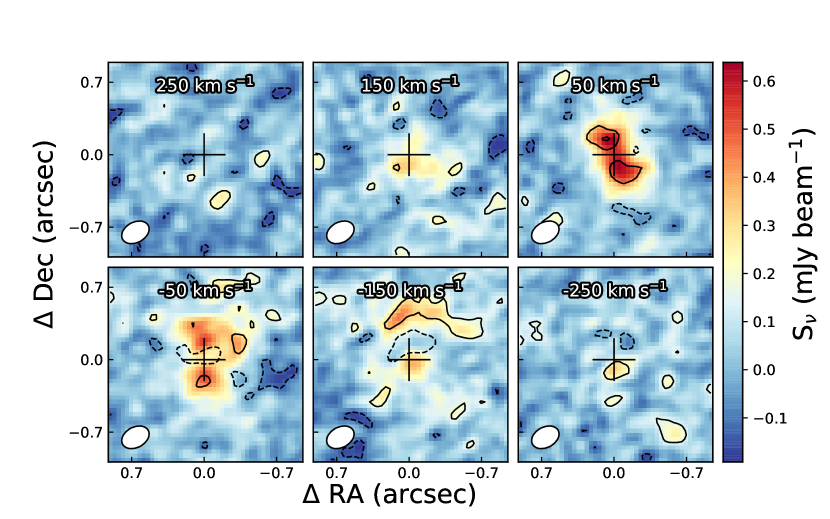
The channel maps of the continuum-subtracted data cube of J1342+0928 are shown in Figure 3. [C II] emission is detected over the entire width of the [C II] line () at the position of the peak of the continuum emission (cross in Figure 3). This figure reveals a highly complicated [C II] emission, being bright and complex in the central channel maps. The emission breaks up into two structures with clear separate peaks, each detected at significance in three different channels. We extracted the spectra centered on both structures using an aperture of 025 (1.25 kpc), resulting in spectra consistent with the total integrated [C II] spectrum shown in Figure 1. This resembles the clumpy substructures identified in some high-redshift submillimeter galaxies (e.g., Hodge et al., 2019) and quasar–galaxy mergers (e.g., Decarli et al., 2019). Higher S/N observations are required to reveal more details in narrower [C II] channel maps and higher resolution is needed to probe how clumpy these substructures are.
3.4 [C II] moment maps
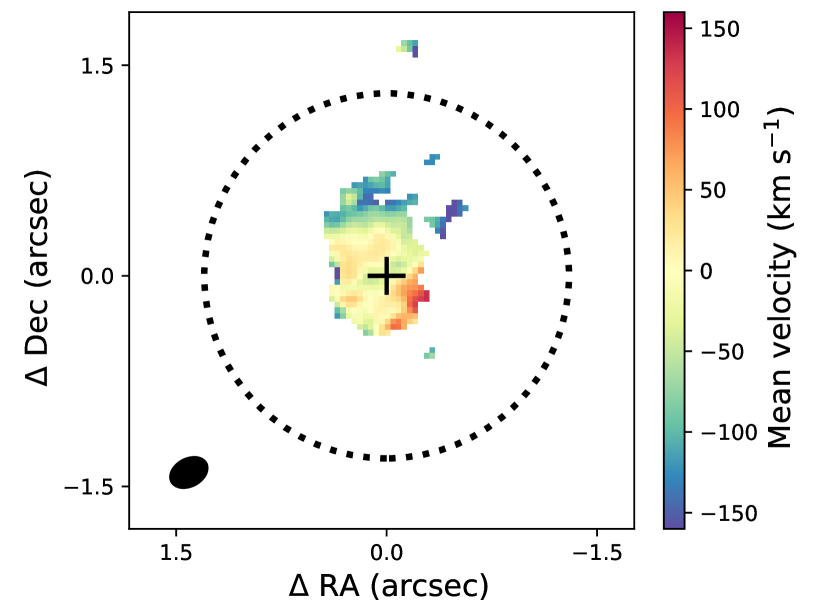
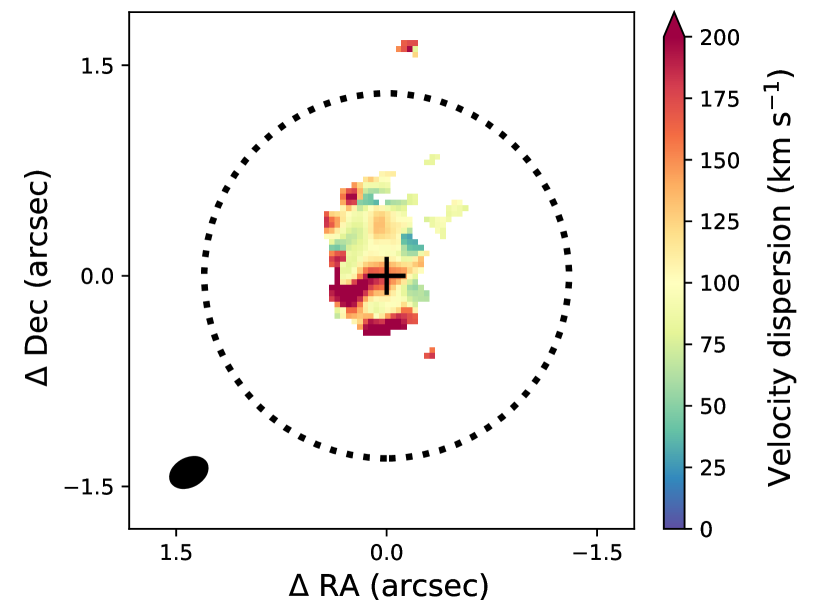
The velocity field and velocity dispersion of the [C II] line are shown in Figure 4. Even though there seems to be a mild velocity gradient with the northern part blueshifted and the southern part redshifted, the velocity dispersion does not resemble a coherent rotating structure as seen in some quasars at (e.g., Shao et al., 2017). Indeed, the velocity dispersion has a peak at the quasar location in line with what observed in the channel maps (Figure 3).
3.5 Rotating disk model
Here we test whether our current data can rule out a simple rotating disk. We model the [C II] emission as an exponential function that can be described by a thin tilted disk with constant circular velocity and velocity dispersion as described in Section 4 of Venemans et al. (2019) and in Appendix C of Neeleman et al. (2019). We obtain the best fit and uncertainties of the parameters performing a minimization using a Markov Chain Monte Carlo approach. The best-fit model is shown in Figure 5 and consists of a disk with a circular velocity , a velocity dispersion , and an inclination angle between the normal to the plane of the galaxy and the line of sight of .
In the case of a rotating thin disk geometry, the dynamical mass within a emission region can be expressed as (Wang et al., 2013), where is the circular velocity in and is the disk diameter in kpc. Using the numbers from our best-fit model ( and kpc), it yields a very small dynamical mass of , comparable to the mass of the supermassive black hole. This dynamical mass would put J1342+0928 about one order of magnitude away from the observed relationships with the black hole mass at lower redshifts and even an outlier between the highest-redshift quasars (Kormendy & Ho, 2013; Venemans et al., 2016).
At first glance this simple model produces a reasonable fit to our data given the small residuals shown in Figure 5. However, the fact that is significantly larger than is in contrast to other systems that are well described by a rotating disk (e.g., Shao et al. 2017; Neeleman et al. 2019). If we pay attention to the residuals in the channel maps (Figure 6) there seems to be more substructures that are not well represented by the model. There are residuals in all channel maps (with some of them spatially coincident), and in one channel map () the model cannot recover the northern structure at . These large residuals would not be expected if the simple disk model was an accurate description of the velocity field.
Although a rotating thin disk model is usually assumed to estimate dynamical masses of quasars with much shallower [C II] data than this work (e.g., Decarli et al. 2018; Trakhtenbrot et al. 2017), our analysis shows that this assumption might not always be the case. Thus, obtaining deep and high-S/N observations is required to derive robust dynamical host masses.
3.6 Comparison to simulations
Our data provide a good test for large cosmological simulations that allow the study and prediction of the observational properties of the first galaxies and supermassive black holes in the universe (e.g., Feng et al., 2016; Lupi et al., 2019). For example, the brightest quasar in the BlueTides simulation has a similar luminosity and black hole mass at to J1342+0928 (Di Matteo et al., 2017; Tenneti et al., 2019), but some of the predictions on the host galaxy of the simulated quasar are different from our findings. Ni et al. (2018) find that the simulated BlueTides quasar produces gas outflows reaching thousands of km s-1 with respect to the systemic redshift, similar to what reported in a quasar at (Cicone et al., 2015). In contrast, there is no evidence of such an extreme gas outflow in J1342+0928 according to our data. In fact, all the [C II] emission is confined to , with most of the emission within (see channel maps in Figure 3). Tenneti et al. (2019) find that the host galaxy of the simulated BlueTides quasar is fairly featureless with an ellipsoidal shape and a small effective radius of 0.35 kpc, which contrast to the complex and extended host galaxy of J1342+0928 revealed by ALMA (Figures 2 and 3).
3.7 Concluding remarks
Even higher resolution and S/N maps of this quasar are required to better constrain the dynamical mass of this object as well to set meaningful constraints on the clumpiness of its interstellar medium (see discussions in Hodge et al. 2016 and Gullberg et al. 2018). These observations are within the reach of ALMA and they could resolve the galaxy into more complex and clumpy substructures, perhaps even revealing the formation regions of some of the first star clusters. Furthermore, the fact that the host galaxy of J1342+0928 is extended on kiloparsec scales makes it a promising target for exploring its stellar content using the James Webb Space Telescope.
References
- Astropy Collaboration et al. (2018) Astropy Collaboration, Price-Whelan, A. M., Sipőcz, B. M., et al. 2018, AJ, 156, 123
- Bañados et al. (2015) Bañados, E., Decarli, R., Walter, F., et al. 2015, ApJ, 805, L8
- Bañados et al. (2018a) Bañados, E., Venemans, B. P., Mazzucchelli, C., et al. 2018a, Nature, 553, 473
- Bañados et al. (2018b) Bañados, E., Connor, T., Stern, D., et al. 2018b, ApJ, 856, L25
- Bertoldi et al. (2003) Bertoldi, F., Carilli, C. L., Cox, P., et al. 2003, A&A, 406, L55
- Carilli & Walter (2013) Carilli, C. L., & Walter, F. 2013, ARA&A, 51, 105
- Cicone et al. (2015) Cicone, C., Maiolino, R., Gallerani, S., et al. 2015, A&A, 574, A14
- Decarli et al. (2018) Decarli, R., Walter, F., Venemans, B. P., et al. 2018, ApJ, 854, 97
- Decarli et al. (2019) Decarli, R., Dotti, M., Bañados, E., et al. 2019, ApJ, 880, 157
- Di Matteo et al. (2017) Di Matteo, T., Croft, R. A. C., Feng, Y., Waters, D., & Wilkins, S. 2017, MNRAS, 467, 4243
- Feng et al. (2016) Feng, Y., Di-Matteo, T., Croft, R. A., et al. 2016, MNRAS, 455, 2778
- Gullberg et al. (2018) Gullberg, B., Swinbank, A. M., Smail, I., et al. 2018, ApJ, 859, 12
- Hodge et al. (2016) Hodge, J. A., Swinbank, A. M., Simpson, J. M., et al. 2016, ApJ, 833, 103
- Hodge et al. (2019) Hodge, J. A., Smail, I., Walter, F., et al. 2019, ApJ, 876, 130
- Hunter (2007) Hunter, J. D. 2007, Computing in Science and Engineering, 9, 90
- Izumi et al. (2018) Izumi, T., Onoue, M., Shirakata, H., et al. 2018, Publications of the Astronomical Society of Japan, 70, 36
- Jorsater & van Moorsel (1995) Jorsater, S., & van Moorsel, G. A. 1995, AJ, 110, 2037
- Kormendy & Ho (2013) Kormendy, J., & Ho, L. C. 2013, ARA&A, 51, 511
- Lupi et al. (2019) Lupi, A., Volonteri, M., Decarli, R., et al. 2019, MNRAS, 488, 4004
- Maiolino et al. (2005) Maiolino, R., Cox, P., Caselli, P., et al. 2005, A&A, 440, L51
- Mazzucchelli et al. (2017) Mazzucchelli, C., Bañados, E., Venemans, B. P., et al. 2017, ApJ, 849, 91
- McMullin et al. (2007) McMullin, J. P., Waters, B., Schiebel, D., Young, W., & Golap, K. 2007, in Astronomical Society of the Pacific Conference Series, Vol. 376, Astronomical Data Analysis Software and Systems XVI, ed. R. A. Shaw, F. Hill, & D. J. Bell, 127
- Meyer et al. (2019) Meyer, R. A., Bosman, S. E. I., & Ellis, R. S. 2019, MNRAS, 487, 3305
- Neeleman et al. (2019) Neeleman, M., Bañados, E., Walter, F., et al. 2019, ApJ, 882, 10
- Ni et al. (2018) Ni, Y., Di Matteo, T., Feng, Y., Croft, R. A. C., & Tenneti, A. 2018, MNRAS, 481, 4877
- Novak et al. (2019) Novak, M., Bañados, E., Decarli, R., et al. 2019, ApJ, 881, 63
- Shao et al. (2017) Shao, Y., Wang, R., Jones, G. C., et al. 2017, ApJ, 845, 138
- Tenneti et al. (2019) Tenneti, A., Wilkins, S. M., Di Matteo, T., Croft, R. A. C., & Feng, Y. 2019, MNRAS, 483, 1388
- Trakhtenbrot et al. (2017) Trakhtenbrot, B., Lira, P., Netzer, H., et al. 2017, ApJ, 836, 8
- Venemans et al. (2019) Venemans, B. P., Neeleman, M., Walter, F., et al. 2019, ApJ, 874, L30
- Venemans et al. (2016) Venemans, B. P., Walter, F., Zschaechner, L., et al. 2016, ApJ, 816, 37
- Venemans et al. (2012) Venemans, B. P., McMahon, R. G., Walter, F., et al. 2012, ApJ, 751, L25
- Venemans et al. (2017a) Venemans, B. P., Walter, F., Decarli, R., et al. 2017a, ApJ, 837, 146
- Venemans et al. (2017b) —. 2017b, ApJ, 851, L8
- Walter & Brinks (1999) Walter, F., & Brinks, E. 1999, AJ, 118, 273
- Walter et al. (2004) Walter, F., Carilli, C., Bertoldi, F., et al. 2004, ApJ, 615, L17
- Walter et al. (2009) Walter, F., Riechers, D., Cox, P., et al. 2009, Nature, 457, 699
- Wang et al. (2013) Wang, R., Wagg, J., Carilli, C. L., et al. 2013, ApJ, 773, 44
- Wang et al. (2019) Wang, R., Shao, Y., Carilli, C. L., et al. 2019, arXiv e-prints, arXiv:1904.07749
- Willott et al. (2017) Willott, C. J., Bergeron, J., & Omont, A. 2017, ApJ, 850, 108