Discovery of the Galactic High-Mass Gamma-ray Binary 4FGL J1405.1-6119
Abstract
We report the identification from multi-wavelength observations of the Fermi Large Area Telescope (LAT) source 4FGL J1405.1-6119 (= 3FGL J1405.4-6119) as a high-mass gamma-ray binary. Observations with the LAT show that gamma-ray emission from the system is modulated at a period of 13.7135 0.0019 days, with the presence of two maxima per orbit with different spectral properties. X-ray observations using the Neil Gehrels Swift Observatory X-ray Telescope (XRT) show that X-ray emission is also modulated at this period, but with a single maximum that is closer to the secondary lower-energy gamma-ray maximum. A radio source, coincident with the X-ray source is also found from Australia Telescope Compact Array (ATCA) observations, and the radio emission is modulated on the gamma-ray period with similar phasing to the X-ray emission. A large degree of interstellar obscuration severely hampers optical observations, but a near-infrared counterpart is found. Near-infrared spectroscopy indicates an O6 III spectral classification. This is the third gamma-ray binary to be discovered with the Fermi LAT from periodic modulation of the gamma-ray emission, the other two sources also have early O star, rather than Be star, counterparts. We consider at what distances we can detect such modulated gamma-ray emission with the LAT, and examine constraints on the gamma-ray binary population of the Milky Way.
Subject headings:
stars: individual (CXOU J053600.0-673507, 4FGL J1405.1-6119) — stars: neutron — gamma-rays: stars24
1. Introduction
High-mass gamma-ray binaries (HMGBs) are very rare objects. They consist of an OB star in orbit with a compact object, where interactions between the two objects cause emission whose spectral energy distribution (SED) peaks above 1 MeV (e.g. Dubus, 2015; Dubus et al., 2017, and references therein). The principal emission mechanism is thought to be interactions between the wind of a rapidly rotating neutron star and the wind from the OB companion. However, while the presence of a rapidly rotating neutron star is suspected, it has only been directly detected in the PSR B1259-63 and PSR J2032+4127 binary systems where the gamma-ray binary phase is confined to orbital phases near periastron passage of these highly-eccentric systems with long orbital periods (e.g. Li et al., 2017; Johnson et al., 2018; Abeysekara et al., 2018, and references therein). Gamma-ray binaries are expected to be precursors to High-Mass X-ray Binaries, which they can evolve into after the neutron star has spun down sufficiently to allow accretion to occur. Systems that contain jet-producing accreting black holes may also be gamma-ray sources. However, in this case the SED will peak at X-ray energies and these systems can be classified as “gamma-ray emitting X-ray binaries”. Such systems would include Cygnus X-3 (e.g. Corbel et al., 2012; Zdziarski et al., 2018) and Cygnus X-1 (e.g. Bodaghee et al., 2013; Zanin et al., 2016; Zdziarski et al., 2017).
Generally, HMGBs may be divided into those systems that contain a Be star, and those that contain an O star. Be star systems differ from the O star systems in that Be stars posses circumstellar disks, that may be transient. The known O-star HMGBs are LS 5039, 1FGL J1018.6-5856, and LMC P3, while the known Be-star gamma-ray binaries are LS I +61∘303, HESS J0632+057, PSR B1259-63 and PSR J2032+4127 (e.g. Dubus et al., 2017, and references therein). Note that HESS J0632+057, while detectable at TeV energies, appears only weakly detected at GeV energies (Malyshev & Chernyakova, 2016; Li et al., 2017), and for PSR J2032+4127, while the pulsations away from periastron were discovered at GeV energies with the LAT (Abdo et al., 2009), binary related activity was primarily detected at TeV rather than GeV energies (Abeysekara et al., 2018).
The number of detectable Galactic gamma-ray binaries will depend on factors that include the distribution of initial neutron star spin periods, and the lifetimes of gamma-ray binaries. Initial estimates of the possible population of gamma-ray binaries came from Meurs & van den Heuvel (1989) who predicted 30 systems in the appropriate evolutionary stage. More recently, based on light-curve modeling and the currently known number of systems, Dubus et al. (2017) estimated that 100 Galactic systems may be detectable. Due to the large point spread function of gamma-ray telescopes such as the Fermi LAT (e.g. Fermi LAT collaboration, 2019), there are very many known gamma-ray sources whose nature is not yet known, and so are potentially binary systems.
Our program to discover gamma-ray binaries initially searches for signs of periodic modulation in gamma-ray light curves obtained with the Fermi-LAT. We then search for counterparts at other wavelengths, and for confirmation of modulation on the same period in the counterparts. From this program we previously identified 1FGL J1018.6-5856 and LMC P3 as high-mass gamma-ray binaries. Here we present the discovery of 4FGL J1405.1-6119 as an additional gamma-ray binary.
We present previous observations and analysis of 4FGL J1405.1-6119 in Section 2. We describe LAT observations and our program to search for modulated gamma-ray sources in Section 3.1. The Swift X-ray observations of the region are presented in Section 3.2, and the ATCA observations in Section 3.3. Near-infrared spectroscopy is described in Section 3.4. The discovery of periodic gamma-ray emission from the direction of 4FGL J1405.1-6119 is presented in Section 4.1, the identification of the counterpart as CXOGSG J140514.4-611827 from the detection of modulated X-ray and radio emission is given in Sections 4.2 and 4.3 respectively. The nature of 4FGL J1405.1-6119 and the implications for the overall population of gamma-ray binaries in the Galaxy are discussed in Section 5 with an overall conclusion in Section 6. Unless otherwise stated, uncertainties are given at the 1 level.
2. Previous Observations of 4FGL J1405.1-6119
4FGL J1405.1-6119 is in the fourth LAT catalog (Fermi LAT collaboration, 2019) and counterparts were also present in previous LAT catalogs as 1FGL J1405.1-6123c (Abdo et al., 2010), 2FGL J1405.5-6121 (Nolan et al., 2012), 3FGL J1405.4-6119 (Acero et al., 2015) and was present in the LAT eight year source list as FL8Y J1405.3-6119. In the third catalog of Fermi sources detected in the 10 GeV to 2 TeV energy range, it is identified as 3FHL J1405.1-6118 (Ajello et al., 2017).
Lee et al. (2012) examined sources in the second Fermi LAT catalog to search for pulsars and identified 2FGL J1405.5-6121 as a candidate based on variability and spectral criteria. Saz Parkinson et al. (2016) also undertook a classification of sources in the 3FGL catalog into pulsars and active galactic nuclei - the two main categories of identified LAT sources. From this analysis they found that 3FGL J1405.4-6119 was most likely to be a pulsar. Saz Parkinson et al. (2016) also noted the presence of XRT and Chandra sources in the Fermi error region, with the Chandra source located at R.A. = 14h05m1447 decl. = -6118277 ( 0 statistical, 0 systematic). Saz Parkinson et al. (2016) also noted a possible coincidence with the supernova remnant (SNR) G311.5-00.3 (there listed as “G311.5+0.3”). 3FGL J1405.4-6119 was also listed as a strong pulsar candidate by Wu et al. (2018). Clark et al. (2017) included 3FGL J1405.4-6119 in a search for pulsations from LAT pulsar candidates and obtained a 95% upper limit on the pulsed fraction of 0.58.
Using IBIS on board INTEGRAL covering 2 - 200 keV, Landi et al. (2017) reported activity from IGR J14059-6116 between 2003 December 7 to 2009 December 14 (MJD 52,980.45 - 55,179.04) and proposed that this IBIS source was the counterpart of 3FGL J1405.4-6119. Landi et al. (2017) also reported on XRT observations which showed the detection of one source within the IBIS error region at R.A. = 14h05m1393 decl. = -61182962 with a 52 (90% confidence) error radius. The XRT source was also positionally coincident with the near-infrared source 2MASS J140514416118282/allWISE J140514.40611827.7. Based on the infrared colors of this source, Landi et al. (2017) considered it unlikely that 3FGL J1405.4-6119 was a blazar.
3. Observations and Analysis
3.1. Gamma-ray Observations and Analysis
The Fermi LAT (Atwood et al., 2009) is a pair conversion telescope sensitive to gamma-ray photons with energies between 20 MeV to 300 GeV. The LAT data used in this paper were obtained between 2008 August 5 and 2019 March 13 (MJD 54,683 to 58,555). During this time, Fermi was primarily operated in a sky survey mode where the LAT pointing position is alternately rocked away from the zenith to the orbit north for one spacecraft orbit, then towards the orbit south for one orbit. In this way, the entire sky is observed every two spacecraft orbits, approximately every three hours. For LAT analysis we used the fermitools version 1.0.1. We used the updated Pass 8 LAT data files (“P8R3”, Bruel et al., 2018) and the weekly photon files provided by the Fermi Science Support Center which include precomputed diffuse response columns.
In our continuing search for new gamma-ray binaries, we create light curves for all sources in Fermi LAT catalogs and then calculate power spectra of these to investigate the presence of periodic modulation. The third LAT catalog contained 3033 sources (Acero et al., 2015). The most recent LAT catalog is 4FGL (Fermi LAT collaboration, 2019) which contains 5099 sources. In addition, the eight year source list (“FL8Y”111https://fermi.gsfc.nasa.gov/ssc/data/access/lat/fl8y/) which was a precursor to the fourth LAT catalog contains 5523 sources. In our search for gamma-ray binaries, we analyzed all 3FGL sources and FL8Y sources. At the time of writing a search of all the sources in the 4FGL catalog was still in progress. However, after identifying 3FGL J1405.4-6119/FL8Y 1405.3-6119 as a binary (Corbet et al., 2019), we then used the parameters of this source from the 4FGL catalog for a refined analysis of 4FGL J1405.1-6119.
Light curves covering an energy range of 100 MeV to 500 GeV were created using a variant of aperture photometry where, instead of simply summing the number of photons within an aperture, we estimate the probability that each photon comes from a source of interest and sum these probabilities (e.g. Kerr, 2011; Fermi LAT Collaboration et al., 2012). To estimate the probability of a photon coming from a source, models were created for each source using the 3FGL catalog and FL8Y source list using sources within a 10 degree radius and make3FGLxml and makeFL8Yxml respectively. Photon probabilities were calculated using gtsrcprob and then summed for a 3 degree radius aperture centered on each source. We note that although in general the use of “probability photometry” increases the signal-to-noise of the light curves, it affects the photometric properties as probabilities are based on a constant source brightness. Thus, when a source is brighter than the model predicts, the probability of a photon coming from the source is underestimated, and, when the source is fainter than the model, the probability is overestimated. This results in a decrease of the apparent modulated amplitude. In addition, there is an energy-dependent effect as the smaller point spread function (PSF) of the LAT at higher energies results in higher-energy photons having higher weights. Time bins of 500s were used for all sources.
Power spectra of these probability-weighted aperture photometry LAT light curves were calculated weighting each data point’s contribution by its relative exposure, after first subtracting the mean count rate. This is beneficial because of the substantial exposure changes from time bin to time bin (Fermi LAT Collaboration et al., 2009). For each source the calculated power spectrum covered a period range from 0.05 days (1.2 hrs) to the length of the light curve, i.e. 3510 days, giving 70,200 independent frequencies. The power spectra were oversampled by a factor of 5 compared to the nominal resolution, which we take to be the inverse of the length of the light curve (e.g. VanderPlas, 2018, and references therein), i.e. 1/3510 days-1. For the strongest peak in each power spectrum the False Alarm Probability (FAP, Scargle, 1982), the estimated probability of a signal reaching a power level by chance under the assumption of white noise, was calculated. This FAP takes into account the number of independent frequencies searched, but does not include the effect of searching for periodicity in multiple sources. In addition, possible statistical problems with the FAP have been noted (e.g. Koen, 1990; Baluev, 2008; Süveges, 2014). In our photometric analyses the background is not fitted for each time bin, and artifact signals can be seen at several periods including Fermi’s 90 minute orbital period, the survey period at twice this, one day, the Moon’s 27.3 day sidereal period, the 53 day precession period of the Fermi satellite, and one quarter of a year222http://fermi.gsfc.nasa.gov/ssc/data/analysis/LAT_caveats_temporal.html. In addition, because of the broad point-spread function of the LAT, particularly at lower energies, variability in nearby sources can also cause apparent modulation in a light curve. Because of these potential artifacts, when apparent evidence of periodic modulation is found in a LAT light curve, it is highly desirable to be able to confirm the modulation using observations at other wavelengths.
3.2. X-ray Observations and Analysis
The Swift XRT (Burrows et al., 2005) is a Wolter I X-ray imaging telescope sensitive to X-rays ranging from 0.3 to 10 keV. Although some previous XRT observations of the region had previously been made dating back to October 2011, these were infrequent, had short observation durations, and had been made over a long interval. We therefore requested additional Swift XRT Target of Opportunity (TOO) observations to cover two orbital cycles more intensively and with longer durations. The XRT TOO observations of 4FGL J1405.1-6119 (CXOGSG J140514.4-611827) took place from 2018 May 16 to June 17 (MJD 58,254–MJD 58,286) with exposures ranging from 3.2 ks to 4.0 ks. For completeness, we additionally analyzed the 15 short archival XRT observations, which were performed between 2011 October 4 and 2017 December 13 (MJD 55,838 and MJD 58,100). The exposures of these archival XRT observations ranged from 90 s to 4.6 ks.
4FGL J1405.1-6119 was observed in Photon Counting (PC; Hill et al., 2004) mode with a readout time of 2.5 s adopting the standard grade filtering (0–12 for PC). We reduced and analyzed the data using the Swift XRT product generator (Evans et al., 2007) and the HEAsoft v.6.20 package and calibration files dated 2017 May 1, following the procedures defined in the XRT Data Reduction Guide (Capalbi et al., 2005). The data were reprocessed with the XRTDAS standard data pipeline package xrtpipeline using the standard filtering procedure to apply the newest calibration and default screening criteria.
We find the background-subtracted count rates of our TOO observations to be between 1.010-3 and 7 210-3 counts s-1. Since our observations of 4FGL J1405.1-6119 were not affected by pile-up, we extracted the source spectra from count-dependent circular regions generated by the Swift XRT product generator. The ancillary response files, accounting for vignetting, point-spread function correction, and different extraction regions, were generated and corrected for exposure using the FTOOL packages xrtmkarf and xrtexpomap, respectively. Due to the large neutral hydrogen column density, the source was not detected at energies below 2 keV. We, therefore, restrict our spectral analysis to energies above 2 keV.
Individual spectra were not useful for analysis, as each spectrum was found to have between 0–21 counts. A cumulative spectrum was therefore extracted, which has a total of 165 counts, and the total exposure is 34.9 ks. We further processed the spectral data produced by xselect using the FTOOL grppha, which defined the binning and quality flags of the spectra. We used the quality flag to further eliminate bad data. Initially, we grouped the bins to ensure a minimum of 20 counts to fit the spectra using statistics. However, insufficient bins were produced in the resulting spectrum. Due to the small number of counts, we therefore used the “C” statistic (Cash, 1979) for the spectral analysis. The cumulative spectrum was grouped to have 5 counts per bin.
3.3. Radio Observations and Analysis
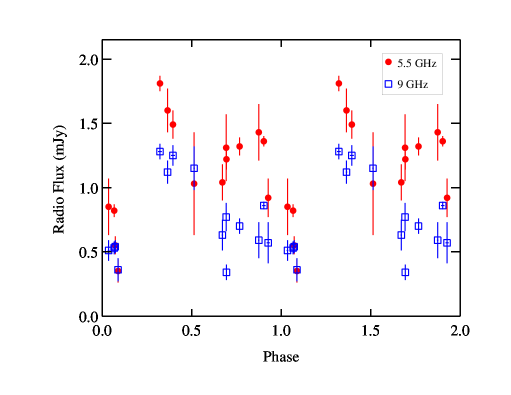
Radio observations were obtained using the Australia Telescope Compact Array (ATCA; Wilson et al., 2011). Dedicated follow-up observations were made between 2017 November 17 and 2018 December 8 (MJD 58,074 to 58,460, see Table 3) with observations centered at 5.5 and 9.0 GHz, with 2 GHz bandwidths for both bands. The ATCA, which consists of six 22 m-diameter antennas, was in several different array configurations over this period, with the more compact arrays somewhat more sensitive to the bright extended emission in the vicinity. Details of the array configurations are given in Table 3.
Observations were reduced following standard procedures in Miriad (Sault et al., 1995), with the flux density scale set by observations of calibrators PKS 1934-638 and/or PKS 0823-500. Initially, observations were made covering the nominal position of the 3FGL source, and the positions of radio sources cataloged by Schinzel et al. (2017) and candidate X-ray sources. Observations differed in length, hour-angle coverage, angular resolution, and sensitivity to extended radio emission in the vicinity, resulting in a heterogeneous data set. Schinzel et al. (2017), who observed with the ATCA in the relatively compact H168 and H214 array configurations, detected four sources within the 3 error region around 4FGL J1405.1-6119, all of which were brighter than 15 mJy, and are resolved out on longer ATCA baselines. Schinzel et al. (2017) also list a further 60 objects in the field detected outside the 3 region, which appear to be associated with the HII region cataloged by Caswell & Haynes (1987) at (l,b) = (311.627, +0.27). Observations of the candidate X-ray sources in more extended ATCA array configurations revealed the fainter (2 mJy), variable radio counterpart. The final observations of the series were conducted as targeted observations, with the phase calibrator PKS 1420-679 used throughout.
3.4. Near-Infrared Observations and Analysis
We observed the candidate near-IR counterpart to 4FGL J1405.1-6119 (2MASS J140514416118282, allWISE J140514.40611827.7; Landi et al., 2017) with FLAMINGOS-2 (Eikenberry et al., 2004) on Gemini South on 2018 June 7 through Program ID GS-2018A-Q-412. We used the R3K grism and a 4-pixel slit, giving a resolution of across the -band. The target was observed with 10 120-sec exposures in a standard ABBA nod, giving 1200 sec of exposure time total. We also observed the nearby A0V star HD 119942 as a telluric standard immediately before our science observations.
The data were reduced using standard near-IR procedures, with optimal extraction of the spectra from subtracted, flat-fielded nodded pairs. The final combined spectrum has a signal-to-noise of about 140 per resolution element in the continuum. After interpolating over the intrinsic Br feature in the telluric standard, we corrected the 4FGL J1405.1-6119 spectrum for telluric absorption by scaling the telluric spectrum to minimize the residuals in the regions of strong telluric lines.
4. Results
4.1. Gamma-ray Results
The power spectra of the light curves of all 3033 3FGL and 5523 FL8Y sources were examined for indications of periodic modulation that could arise from previously unknown binary systems. For candidate new binaries our usual threshold for further investigation has been for a source to have a peak power 18 mean power level (FAP 510-4) and for the period not to coincide with a known artifact. We also exclude very long periods that are suggestive of arising from red-noise type behavior, such as from active galactic nuclei.
From our power spectra, initially from 3FGL sources, and persisting into the FL8Y list and the 4FGL catalog (Fermi LAT collaboration, 2019), we noted two peaks in the power spectra of 3FGL J1405.4-6119 and FL8Y J1405.3-6119 which, although lower than our usual threshold for further investigation, were consistent at a 1.7 level with being harmonics. From the power spectrum of 4FGL J1405.1-6119 (Fig. 1, bottom panel) the two peaks are at 6.8586 0.0013 days and 13.7235 0.0046 days. The heights of the peaks are 15.1 and 17.4 compared to the mean power level respectively, with FAP values of 0.02 and 0.002, for 77436 trials. For a two value trial, i.e. performing a test on whether there is modulation at either twice or half the period of stronger peak, then the peak height of the 6.86 day period implies an FAP of 610-7.
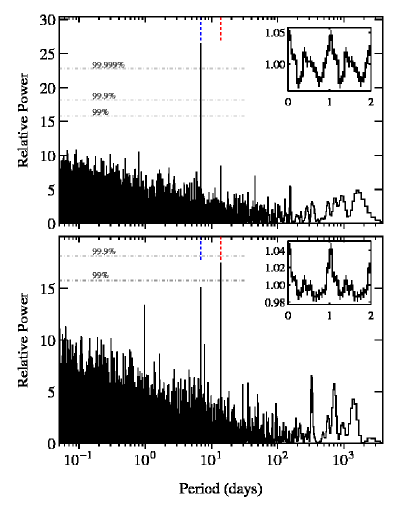
Folding the LAT light curve on the 13.7 day period (Fig. 1, bottom panel inset) shows a profile with a single sharp peak, which occurs near MJD 56,498.7. The presence of two peaks in the power spectrum can be ascribed to the sharpness of this peak which deviates from a simple sine modulation. Since the probability-weighted light curve can potentially suffer from photometric distortions (Section 3.1) we also created a light curve using conventional aperture photometry without the weighting. For this we employed a one degree radius aperture. From the power spectrum of this (Fig. 1, top panel) we find instead a single peak at 6.85675 0.00096 days and only a very small peak near 13.7 days. The height of the peak for the power spectrum of the unweighted 200 MeV light curve is 26.5 with an associated FAP of 310-7, allowing only for the number of independent frequencies. Through the remainder of this paper we use a period of 13.7135 0.0019 days, as the period implied by the harmonic in the power spectrum of the unweighted light curve. Period search techniques based on light-curve folding such as maximization (e.g. Leahy et al., 1983) or phase-dispersion minimization (Stellingwerf, 1978) can naturally also produce signals at “sub-harmonics” of the intrinsic modulation period, i.e. multiples of the intrinsic modulation period. However, this effect does not occur in direct Fourier-based analyses which quantify the sine-wave components of the modulation. For this reason, we identify the longer, 13.7 day, period as the intrinsic modulation period of 4FGL J1405.1-6119. This is confirmed by the single peak exhibited in the X-ray and radio light curves when folded on the longer period (Sections 4.2 and 4.3 respectively). The stronger peak near 13.7 days in the power spectrum of the conventional photometry light curve compared to the probability-weighted light curve is because the modulation in the conventional light curve is more nearly sinusoidal on this period. For the probability-weighted light curve, the modulation profile is more sharply peaked (i.e. less sinusoidal), and thus the power is spread over more than one Fourier component, principally the fundamental and the first harmonic. Such a change in profile shape between unweighted and weighted light curves is not necessarily expected to be a general feature of modulation in HMGBs. We note that if only the power spectrum of the conventional aperture photometry LAT light curve was available (Fig. 1, bottom panel) then the shorter harmonic period might have been incorrectly determined to be the period of the system.
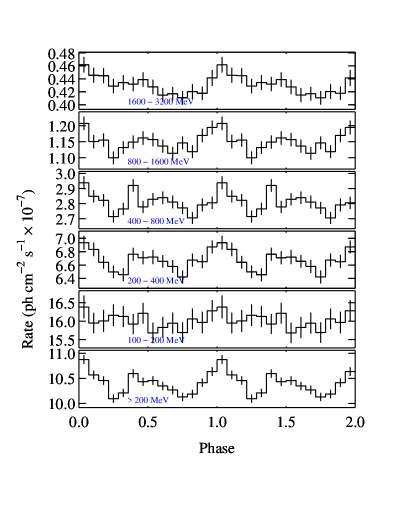
The unweighted light curve folded on 13.7 days (Fig. 1, top panel) now shows, in addition to the primary peak at phase 0, an additional prominent peak near phase 0.5. We then examined the modulation as a function of energy. We find that below 200 MeV no modulation is detected. Above 200 MeV we find that there is a difference in the two peaks, where one is more prominent at lower energies, while the other becomes more prominent at higher energies, and coincides with the phasing of the single peak in the probability-weighted light curve. Thus, we ascribe the difference between the power spectra for the weighted and unweighted light curves as an energy-dependent effect, where the high-energy photons are effectively over-weighted because of the smaller point-spread function.
To investigate the stability of the period, we divided the conventional aperture photometry light curve into three equal-length sections and calculated the power spectrum of each section separately. The periods of the orbital harmonic derived in this way (6.855 0.006, 6.860 0.004, and 6.853 0.005 days) are all consistent with each other, and also the more precise period derived from the entire light curve.
Neither the power spectrum of the probability-weighted light curve nor that of the unweighted light curve (Fig.1) show any evidence of additional periodicities, or long-period/low-frequency variability, beyond the two peaks related to the 13.7 day period, and an artifact at one day that is often seen in our power spectra of LAT light curves.
The spectral model derived for 4FGL J1405.1-6119 in the 4FGL catalog is a log normal function (LogParabola), as it was in the 3FGL catalog. i.e.
| (1) |
This model is used in the LAT catalogs for all sources with significantly curved spectra. Additional information on the 3FGL and 4FGL catalog results, including plots of spectral fits are available from the Fermi Science Support Center 333https://fermi.gsfc.nasa.gov/ssc/data/access/lat/4yr_catalog/ 444https://fermi.gsfc.nasa.gov/ssc/data/access/lat/8yr_catalog/. In Table 2 we show the spectral parameters in the 4FGL catalog of 4FGL J1405.1-6119 together with the other persistent HMGBs. In all cases the model employed in the catalog was LogParabola, and we note that the spectral parameters of all sources are broadly comparable.
We made a phase-resolved maximum likelihood analysis to also examine the modulation on 13.7 days. For this we generate a model based on the 4FGL source catalog, but held all parameters fixed, apart from the flux of 4FGL J1405.1-6119. We employed a 10 degree radius “region of interest”. The phase-resolved fluxes derived from this likelihood analysis are plotted in Fig. 3. We find that the flux increase near phase zero is clearly detected, but only a modest increase near a phase of 0.5 is observed. The overall folded light curve also appears somewhat noisier with a lower amplitude than the folded aperture photometry light curve. We investigated phase-resolved likelihood analysis for energy ranges between 200 to 1000 MeV, and 1000 to 500,000 MeV. However, the fits to the lower energy range resulted in low Test Score (TS) numbers and so could not be used to investigate the secondary peak. We also made fits with the spectral parameters of FL8Y J1405.3-6119 left free, but these were found to result in spectral parameters which varied in an implausible way between phase bins.

While the likelihood analysis does not strongly show the double-peaked orbital profile shown by the conventional aperture photometry, we note that there is no known artifact that would produce double-peaked modulation in the aperture photometry. In addition, the aperture photometry has the benefit that it is model independent. For these reasons, along with the modest secondary peak that is seen in the likelihood analysis, we believe that the double-peaked structure more strongly found in the aperture photometry is indeed showing the intrinsic behavior of the source, while the secondary apparently softer peak is more difficult to fit due to the higher background at lower energies.
4.2. X-ray Results
4.2.1 X-ray Flux Variations
The XRT TOO observations of 4FGL J1405.1-6119 cover more than two orbital periods. The XRT light curve folded on the 13.7 day period is shown in Fig. 4. From this, a strong, approximately sinusoidal, modulation on the 13.7 day gamma-ray period can be seen. However, we note that X-ray minimum occurs near the phase of primary gamma-ray maximum. Although the archival observations have shorter durations, and thus larger error bars, than our TOO observations, they also indicate modulation on the 13.7 day period.
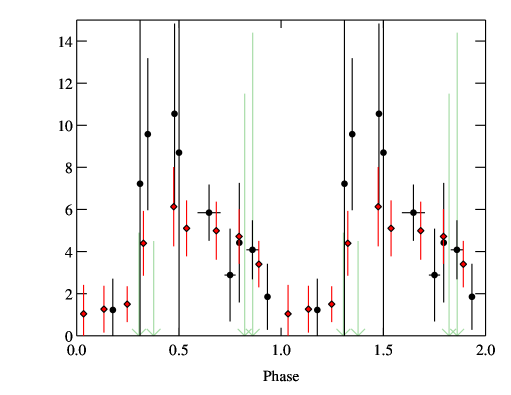
To investigate the energy dependent phase shift between the Fermi gamma-ray and Swift X-ray light curves, we calculated the maximum value of the cross correlation function between the two folded light curves after applying phase shifts to the X-ray light curve. For this we only used XRT data from the TOO observations. Due to the sparse coverage of the X-ray light curve, we did not bin this but instead linearly interpolated to cover observation gaps. From this we find the X-ray light curve leads the LAT light curve by a phase of 0.586. We also used a simple sine wave fit to the entire XRT light curve to determine maximum of the X-ray light curve and find this occurs at a phase of 0.59 0.03. This is thus consistent with the results of the cross-correlation analysis. However, this result should be treated with caution since we only have good coverage of two cycles, the individual flux measurements have relatively large errors, and the shape of the modulation is hence not yet well defined.
4.2.2 X-ray Spectrum
The cumulative and orbital-peak spectra of 4FGL J1405.1-6119 were analyzed using XSPEC v12.9.0k. We made use of the XSPEC convolution model cflux to calculate the fluxes and associated errors of 4FGL J1405.1-6119. To fit the cumulative XRT spectrum, we used several models that are used to describe systems that host a neutron star: a power law (power), a power law with a high-energy cutoff (highecut in XSPEC), and a cutoff power law (cutoffpl in XSPEC). All models were modified by an absorber that fully covers the source using appropriate cross sections (Verner et al., 1996) and abundances (Wilms et al., 2000).
We initially allowed the neutral hydrogen column density and photon index to be free parameters and performed spectral fits on the cumulative spectrum. Due to the short exposure times of the archival observations (see Table 1), we chose to include only the TOO observations that were performed between 2018 May 16 and 2018 June 17 (MJD 58,254 and MJD 58,286). The model that provides the best fit (C statistic of 10.19 for 18 degrees of freedom) to the data is a power law. While a good fit does not require a high-energy cutoff, which is typically found in accreting pulsars (Coburn et al., 2002), our spectra are limited to energies below 10 keV. We note that while high-energy cutoffs are typically seen at higher energies, none was found in LS 5039 (Takahashi et al., 2009) or 1FGL J1018.6-5856 (An et al., 2015) up to 40 keV. We find the neutral hydrogen column density for the fully covered absorption and the photon index to be 1.11023 cm-2 and 2 1, respectively. We also attempted fitting the cumulative spectrum of the TOO observations along with the archival ones and found larger uncertainties in the model parameters. The cumulative XRT spectrum, and best-fitting power-law model are shown in Fig. 5.
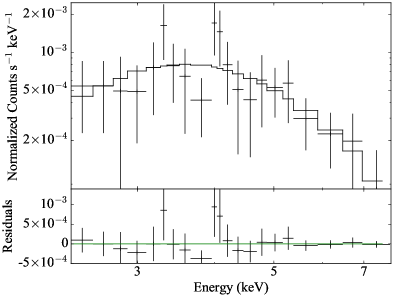
Since neither the neutral hydrogen column density for the fully covered absorber nor the photon index could be accurately constrained, we converted the mean derived value of optical reddening of 10.2 (Section 4.4) into the predicted neutral hydrogen column density and chose to fit the cumulative spectrum with the frozen to it. From Equation 1 in Güver & Oumlzel (2009), we calculate the neutral hydrogen column density along the line of sight to be 6.91022 cm-2. Using the power model, we find the photon index to be 1.5 0.4 and the unabsorbed X-ray flux in the 2–8 keV band to be 8 110-13 erg cm-2 s-1. For comparison, Takahashi et al. (2009) found a power law index for LS 5039 that varied between 1.45 - 1.61, for 1FGL J1018.6 An et al. (2015) found indices between 1.4 - 1.7, and for LMC P3 indices between 1.3 to 1.6 have been reported (Bamba et al., 2006; Seward et al., 2012; Corbet et al., 2016). It is important to note that while this model provides a good fit to the XRT spectrum (C statistic of 10.39 for 19 degrees of freedom), this interpretation should be treated with caution since we assumed that the fully covered is entirely interstellar in origin. While this is the simplest interpretation of the data, we cannot exclude the possibility that the fully covered is due to a combination of intrinsic and interstellar absorbers. However, for LS 5039 and 1FGL J1018.6-5856 the measured values are consistent with being only due to interstellar absorption An et al. (2015); Takahashi et al. (2009).
4.3. Radio Results
A point radio source was found with ATCA in the LAT error region of the gamma-ray source which coincides with the position of CXOGSG J140514.4-611827 and also the proposed near-IR counterpart at R.A. = 14h05m1442 0.02”, decl. = 61182833 0.03 (J2000). The offset of this position from the 3FGL, FL8Y, and 4FGL positions and corresponding 95% semi-major error radii are 1.43 (1.88), 1.23 (1.31), and 1.50 (1.25)′ respectively.
The radio flux densities folded on the 13.7 day period (Fig. 6) show modulation of the emission on the gamma-ray period. There is a gap in the coverage between phases 0.1 and 0.3, which hampers our determination of the phase of maximum flux, but it must be either within this gap or near phase 0.3. We do have coverage at phase 0, the maximum of the gamma-ray flux, and find a minimum radio flux. Thus, similar to the X-ray flux, the radio flux is offset from the primary gamma-ray maximum. However, there is an indication that the radio flux maximum may occur somewhat before the X-ray maximum. We note a low intensity 9 GHz measurement at a phase of 0.7, while the flux at 5.5 GHz is not exceptionally low. The 9 GHz measurement appears to be reliable and not due to an instrumental effect.
4.4. Near-Infrared Results: Spectral Classification and Distance
The near-infrared spectrum obtained with FLAMINGOS-2 is shown in Fig. 7. To classify 4FGL J1405.1-6119, we use the near-IR library of early-type stars from Hanson et al. (2005). These spectra were obtained at higher resolution than our spectrum ( rather than ), so we smooth them to match our resolution before comparison.
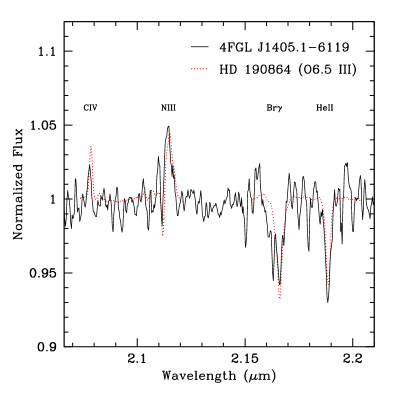
The most prominent line in the spectrum is N III in emission (rest frame 2.1155 m). and we also observe weak C IV emission at 2.078 m. Absorption lines clearly present are Br (H) at 2.1661 m and He II at 2.188 m, and a weaker He I absorption line is present at 2.113 m, nearly blended with the N III emission line.
In terms of the lines present and absent and their relative strengths, the best match from the Hanson et al. (2005) catalog is HD 190864, which is classified as an O6.5 III star. The object spectrum overplotted with this star is in Figure 7. By comparison, an O5 III star in the catalog, HD 15558, has much weaker He II than 4FGL J1405.1-6119. Similarly, the O5/O5.5 supergiants in the catalog have weaker He II and stronger C IV emission than 4FGL J1405.1-6119. Considering O dwarfs, the absorption lines generally appear to be broader than observed in 4FGL J1405.1-6119, consistent with their higher rotational velocities and/or gravities.
We conclude that, on the basis of our spectrum, the best classification of 4FGL J1405.1-6119 is as an O6.5 III star, but emphasize that this classification should be revisited with a higher signal-to-noise spectrum in the future.
By cross-correlation between the standards and our spectrum in the region of the He II line, we find a barycentric radial velocity of km s-1. We also note that the emission lines appear to lie at a different velocity, so the systemic velocity of this star is not necessarily well-determined.
In order to estimate the distance to 4FGL J1405.1-6119 we used the tabulated absolute magnitudes from Martins & Plez (2006) for an O6.5 III star (i.e. MJ = -5.03, MH = -4.92, and MK = -4.82), the 2MASS photometric measurements (H = 14.369 0.068, K = 12.769 0.044 Landi et al., 2017), and the reddening laws determined by Rieke & Lebofsky (1985, RV=3.1) and also Schlafly & Finkbeiner (2011). The infrared counterpart is also present in the Vista Variables in the Via Lactea (VVV) catalog (Minniti et al., 2010) with measured values of J = 17.270 0.028 H = 14.524 0.005 K = 12.854 0.003. The distances derived from these photometric measurements and reddening curves are given in Table 4. The mean of these distances is 7.7 kpc, with a standard deviation of 1 kpc. For the remainder of this paper we use 7.7 kpc for estimates of source luminosity, but caution that there is considerable uncertainty on this. The mean derived value of E(B-V) is 10.2 with a standard deviation of 1.5. We note that the reddening curve of Rieke & Lebofsky (1985) gives somewhat higher distances and lower reddening than using the reddening curve from Schlafly & Finkbeiner (2011). In addition, the 2MASS and VVV measurements are formally inconsistent. If this is not due to, for example, different photometric bandpasses, it might indicate variability in the near-IR.
5. Discussion
5.1. Properties and Nature of 4FGL J1405.1-6119
The periodic modulation on 13.7 days found at gamma-ray, X-ray, and radio wavelengths, together with the identification of a stellar counterpart, clearly show that 4FGL J1405.1-6119 is a high-mass gamma-ray binary, and the 13.7 day period is expected to be the orbital period of the system. 4FGL J1405.1-6119 is the third gamma-ray binary, after 1FGL J1018.6-5856 and LMC P3, to be found from the initial discovery of periodic modulation of the LAT light curve. In all three cases, the primary star in the system is an early O star, rather than a Be star. The O6.5 III classification for 4FGL J1405.1-6119 indicates a mass for the primary star 25 - 35 M☉ (Mahy et al., 2015).
For a distance of 7.7 kpc, the implied maximum gamma-ray luminosity would be comparable to, and possibly higher than, that of LS 5039, while approximately half that of 1FGL J1018.6-5856 and a tenth that of LMC P3. The unabsorbed mean X-ray luminosity of 4FGL J1405.1-6119 is 5.61033erg s-1 (/7.7 kpc)2. For LMC P3 the unabsorbed luminosity measured with the Swift XRT (2.0 - 7.5 keV) was also considerably larger at 9.61034erg s-1 (/50 kpc)2 (Corbet et al., 2016). For 1FGL J1018.6-5856 there are flares that reach unabsorbed luminosities (0.5 - 10 keV) of 1034erg s-1 (/5.4 kpc)2, while between these the luminosity can decline to 2.61033erg s-1 (/5.4 kpc)2 (An et al., 2013) and so on average it is more similar to 4FGL J1405.1-6119. For LS 5039, the X-ray luminosity (1 - 10 keV) is also comparable at 61033erg s-1 (/2.5 kpc)2 (Bosch-Ramon et al., 2007; Takahashi et al., 2009; Rea et al., 2011).
Because of the similarities with the other systems, we also hypothesize that gamma-ray emission from 4FGL J1405.1-6119 is driven by the interaction between the wind from a rapidly rotating neutron star and the wind from the O star companion. Orbital modulation of observed flux in HMGBs can be driven by orbital phase-dependent changes in both viewing angle and varying source distance for systems with significant eccentricity. The overall pattern of variability in 4FGL J1405.1-6119 is similar to that seen in LMC P3 where the X-ray and radio modulations are approximately in phase with each other, but close to 0.5 out of phase from the primary gamma-ray peak. However, the energy-dependent gamma-ray modulation seen in 4FGL J1405.1-6119 with a secondary softer peak approximately 0.5 out of phase from the primary peak is unlike LMC P3. For 1FGL J1018.6-5856 the X-ray emission has a broad component that is out of phase from the overall gamma-ray modulation, although there is an additional X-ray component that exhibits sharp “flares” that is in phase with the gamma-ray modulation (Fermi LAT Collaboration et al., 2012; An et al., 2015). An & Romani (2017) have also reported for 1FGL J1018.6-5856 that the gamma-ray light curve below 200 MeV includes a component that is modulated with a similar phasing to that of the broad X-ray component. Anti-phasing between the modulation of the gamma-ray and X-ray emission in the O-star HMGBs may be explained if the gamma-ray variability is primarily due to inverse Compton scattering, which gives greater flux near superior conjunction, and X-ray modulation is due to Doppler boosting, which will give higher observed flux near inferior conjunction (e.g. Dubus et al., 2015).
To investigate the driving mechanisms behind these modulations in detail it will be important to determine a radial velocity curve for the system. In addition to the orbital variability of the radio flux, there also appears to be shorter-term variability which does not occur simultaneously at both frequencies. The origin of this radio variability is unclear, but it may be similar to what has been seen in LMC P3 (Corbet et al., 2016).
We note that 4FGL J1405.1-6119 is located 40′ from the previously suggested SNR counterpart G311.5-00.3 (Saz Parkinson et al., 2016), which has a 5′ radio diameter (Green, 2014), and so the two sources must be distinct. Thus, for 4FGL J1405.1-6119 we cannot directly estimate the age of the system from an associated SNR. Similarly, for 1FGL J1018.6-5856 Marcote et al. (2018) also find that their motion and distance measurements are not consistent with a previously proposed possible SNR association. This is unlike LMC P3 for which there does appear to be an association with an SNR (Seward et al., 2012; Corbet et al., 2016).
The Be star HMGB LS I +61∘303 have shown, in addition to its 26.5 day orbital period, a superorbital period near 1667 days that was originally detected from radio observations (e.g. Gregory, 2002, and references therein). This superorbital modulation has also been seen in the LAT light curve of this source (e.g. Hadasch et al., 2012; Xing et al., 2017; Jaron et al., 2018). Such superorbital variability has not yet been shown to be a general property of HMGBs and, as noted in Section 4.1, we do not see such modulation in 4FGL J1405.1-6119. However, since superorbital modulation has been reported in a number of high-mass X-ray binaries accreting from both Be star envelopes and the winds from OB star companions (Rajoelimanana et al., 2011; Corbet, & Krimm, 2013; Corbet et al., 2018), it is possible that superorbital modulation may still be found in other HMGBs beyond LS I +61∘303.
5.2. Distance Limits on Detectability of Galactic Gamma-ray Binaries
The Galactic population of gamma-ray binaries has been discussed by Dubus et al. (2017) and these authors found very large uncertainties on the possible population as . We previously suggested that the discovery of a binary in the LMC but the lack of detection, at that time, of additional Galactic systems might suggest we had discovered all detectable sources. Here we investigate this in more detail by estimating the approximate maximum distance at which we could detect the known binaries from their periodic variability in LAT light curves.
In Fig. 8, using Table 3 of Dubus et al. (2017) together with the parameters of 4FGL J1405.1-6119, we plot photon luminosity of those sources with detectable modulation against distance. We note that there is a general trend for the most distant known sources to be the most luminous. This is suggestive of a flux detection threshold.
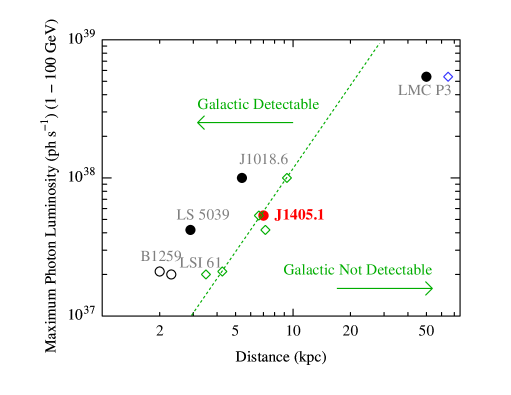
As a detection threshold in our power spectra, we consider that a peak should have a minimum height of 20 times the mean power level to be detectable. We then determined the actual heights of the orbital peaks in the FL8Y LAT light curves using light curves covering from 2008 August 5 and 2018 July 5 (MJD 54,683 to 58,304). The ratio of the maximum detection distance to the actual distance was then taken as (peak height/20)1/4. One square root to convert from power to amplitude, and one square root to allow for inverse square law decrease in flux. We then multiplied the source distances by the resulting factor, and these are plotted as green diamonds in Fig. 8. The green line is a straight line fit (in log-log space) with a slope fixed to be equivalent to r-2. The space to the left of this line is assumed to be detectable, while the space to the right would not be detectable. Note that changed distance measurements would move source locations along lines parallel to the green line, and thus the location of the green line itself would not change. In addition, due to the fourth root dependence, the location of the line does not strongly depend on the choice of detection threshold relative power level.
Although our binary detection limit is derived in a simple way, and does not account for different modulation patterns or differing backgrounds, it does give generally consistent results for the Galactic binaries. We note, however, that LMC P3 does lie inside the region where it would nominally not be detectable. Thus, the detectability of LMC P3 may be due to the considerably lower background due to it being located away from the Galactic plane. The Be star system HESS J0632+057, which is at most weakly detected with the LAT, and so does not exhibit periodic modulation, is at a distance of 0.8 kpc and a luminosity of 2.91035 ph s-1 (Dubus et al., 2017) and hence is located to the right of the nominal detection threshold line.
With extended LAT observations, the detection line will slowly move to the right. We find empirically that the strengths of the peaks of the known periods in the power spectra relative to the mean power levels increase approximately linearly with time (i.e. the mean amplitude noise decreases as the square root of time). Thus, the maximum detection distance would increase as . The maximum detection volume, for sources near the plane, would increase as . Convolved with this, for the discovery rate of new binaries from their modulation, is the poorly constrained luminosity function for gamma-ray binaries. We note that the Be star systems are relatively nearby, and lower luminosity, perhaps suggestive that there remains a more extensive population of Be stars remaining to be discovered.
Our searches for binaries based on detection of periodic modulation do require us to distinguish between periodic and non-periodic variability. If we require 10 cycles to enable clear discrimination between a coherent signal and red noise, then periods 1 year would be required. Thus, discovery of Be star binaries with periods such as those of PSR B1259-63 and PSR J2032+4127 would be difficult or impossible. However, Be X-ray binaries generally exhibit binary periods between 20 to 400 days (e.g. Corbet et al., 2017, and references therein). Brief flaring behavior such as exhibited by PSR B1259-63 (e.g. Johnson et al., 2018) would also be more readily distinguished from red noise behavior with fewer cycles.
From the modest number of gamma-ray binaries known so far, there are two factors that may facilitate the discovery of O-star systems from the detection of modulated gamma-ray emission. The orbital periods of the O-star systems are shorter than those of the known Be systems. In addition, the Be star systems typically have lower luminosities and so the O-star systems are visible at greater distances.
Our detection threshold distance for sources with similar luminosities and gamma-ray modulation properties to LS 5039 and 4FGL J1405.1-6119 raises the possibility that the HMGB population estimate of Dubus et al. (2017) may have been an underestimate. Dubus et al. (2017) estimated that 80% of LS 5039-like systems in the Galaxy would be detected. However, discovery from gamma-ray modulation alone within the Galactic plane appears currently restricted to 7 kpc. Thus, multi-wavelength observations of unidentified gamma-ray sources to aid variability searches will continue to be important. For example, the identification of an OB counterpart to an X-ray source within a LAT error ellipse could also facilitate the discovery of a gamma-ray binary.
6. Conclusion
We have identified 4FGL J1405.1-6119 as a gamma-ray binary with gamma-ray flux modulated on a period near 13.7 days. This periodicity is also seen at X-ray and radio wavelengths. As with 1FGL J1018.6-5856 and LMC P3, which were also detected from modulated gamma-ray emission with the LAT, 4FGL J1405.1-6119 contains an O, rather than a Be, star primary. The system is heavily obscured in the optical. Future infrared radial velocity measurements would be valuable for determining the system geometry and establishing the system orientation at maximum flux in the different wavebands. A determination of the system eccentricity would also be important. It is suspected that 4FGL J1405.1-6119 contains a rapidly rotating neutron star, although we do not yet have a direct detection of this. The Galactic population of gamma-ray binaries is unclear, but there may remain a lower gamma-ray luminosity population remaining to be discovered, particularly since for the known systems, the Be star systems have lower luminosities.
References
- Abdo et al. (2009) Abdo, A. A., Ackermann, M., Ajello, M., et al. 2009, Science, 325, 840
- Abdo et al. (2010) Abdo, A. A., Ackermann, M., Ajello, M., et al. 2010, ApJS, 188, 405
- Abeysekara et al. (2018) Abeysekara, A. U., Benbow, W., Bird, R., et al. 2018, ApJ, 867, L19
- Acero et al. (2015) Acero, F., Ackermann, M., Ajello, M., et al. 2015, ApJS, 218, 23
- Ajello et al. (2017) Ajello, M., Atwood, W. B., Baldini, L., et al. 2017, ApJS, 232, 18
- An et al. (2013) An, H., Dufour, F., Kaspi, V. M., et al. 2013, ApJ, 775, 135
- An et al. (2015) An, H., Bellm, E., Bhalerao, V., et al. 2015, ApJ, 806, 166
- An & Romani (2017) An, H., & Romani, R. W. 2017, ApJ, 838, 145
- Atwood et al. (2009) Atwood, W. B., Abdo, A. A., Ackermann, M., et al. 2009, ApJ, 697, 1071
- Baluev (2008) Baluev, R. V. 2008, MNRAS, 385, 1279
- Bamba et al. (2006) Bamba, A., Ueno, M., Nakajima, H., Mori, K., & Koyama, K. 2006, A&A, 450, 585
- Bodaghee et al. (2013) Bodaghee, A., Tomsick, J. A., Pottschmidt, K., et al. 2013, ApJ, 775, 98
- Bosch-Ramon et al. (2007) Bosch-Ramon, V., Motch, C., Ribó, M., et al. 2007, A&A, 473, 545
- Bruel et al. (2018) Bruel, P., Burnett, T. H., Digel, S. W., et al. 2018, arXiv:1810.11394
- Burrows et al. (2005) Burrows, D. N., Hill, J. E., Nousek, J. A., et al. 2005, Space Sci. Rev., 120, 165
- Capalbi et al. (2005) Capalbi, M., Perri, M., Saija, B., Tamburelli, F., & Angelini, L. 2005, http://swift.gsfc.nasa.gov/analysis/xrt_swguide_v1_2.pdf
- Cash (1979) Cash, W. 1979, ApJ, 228, 939
- Caswell & Haynes (1987) Caswell, J. L., & Haynes, R. F. 1987, A&A, 171, 261
- Clark et al. (2017) Clark, C. J., Wu, J., Pletsch, H. J., et al. 2017, ApJ, 834, 106
- Coburn et al. (2002) Coburn, W., Heindl, W. A., Rothschild, R. E., et al. 2002, ApJ, 580, 394
- Corbel et al. (2012) Corbel, S., Dubus, G., Tomsick, J. A., et al. 2012, MNRAS, 421, 2947
- Corbet et al. (2011) Corbet, R. H. D., Cheung, C. C., Kerr, M., et al. 2011, The Astronomer’s Telegram, 3221
- Corbet, & Krimm (2013) Corbet, R. H. D., & Krimm, H. A. 2013, ApJ, 778, 45
- Corbet et al. (2016) Corbet, R. H. D., Chomiuk, L., Coe, M. J., et al. 2016, ApJ, 829, 105
- Corbet et al. (2017) Corbet, R. H. D., Coley, J. B., & Krimm, H. A. 2017, ApJ, 846, 161
- Corbet et al. (2018) Corbet, R. H. D., Coley, J. B., Krimm, H. A., et al. 2018, The Astronomer’s Telegram, 11918, 1
- Corbet et al. (2019) Corbet, R., Chomiuk, L., Coe, M., et al. 2019, AAS/High Energy Astrophysics Division, 17, 112.04
- Dubus (2015) Dubus, G. 2015, Comptes Rendus Physique, 16, 661
- Dubus et al. (2015) Dubus, G., Lamberts, A., & Fromang, S. 2015, A&A, 581, A27
- Dubus et al. (2017) Dubus, G., Guillard, N., Petrucci, P.-O., & Martin, P. 2017, A&A, 608, A59
- Eikenberry et al. (2004) Eikenberry, S. S., Elston, R., Raines, S. N., et al. 2004, Proc. SPIE, 5492, 1196
- Evans et al. (2007) Evans, P. A., Beardmore, A. P., Page, K. L., et al. 2007, A&A, 469, 379
- Fermi LAT Collaboration et al. (2009) Fermi LAT Collaboration, Abdo, A. A., Ackermann, M., et al. 2009, Science, 326, 1512
- Fermi LAT Collaboration et al. (2012) Fermi LAT Collaboration, Ackermann, M., Ajello, M., et al. 2012, Science, 335, 189
- Fermi LAT collaboration (2019) The Fermi-LAT collaboration 2019, arXiv:1902.10045
- Green (2014) Green, D. A. 2014, Bulletin of the Astronomical Society of India, 42, 47
- Gregory (2002) Gregory, P. C. 2002, ApJ, 575, 427
- Güver & Oumlzel (2009) Güver, T., & Oumlzel, F. 2009, MNRAS, 400, 2050
- Hadasch et al. (2012) Hadasch, D., Torres, D. F., Tanaka, T., et al. 2012, ApJ, 749, 54
- Hanson et al. (2005) Hanson, M. M., Kudritzki, R.-P., Kenworthy, M. A., Puls, J., & Tokunaga, A. T. 2005, ApJS, 161, 154
- Hill et al. (2004) Hill, J. E., Burrows, D. N., Nousek, J. A., et al. 2004, Proc. SPIE, 5165, 217
- Jaron et al. (2018) Jaron, F., Massi, M., Kiehlmann, S., et al. 2018, MNRAS, 478, 440
- Johnson et al. (2018) Johnson, T. J., Wood, K. S., Kerr, M., et al. 2018, ApJ, 863, 27
- Kalberla et al. (2005) Kalberla, P. M. W., Burton, W. B., Hartmann, D., et al. 2005, A&A, 440, 775
- Kerr (2011) Kerr, M. 2011, ApJ, 732, 38
- Koen (1990) Koen, C. 1990, ApJ, 348, 700
- Landi et al. (2017) Landi, R., Bassani, L., Bazzano, A., et al. 2017, MNRAS, 470, 1107
- Leahy et al. (1983) Leahy, D. A., Elsner, R. F., & Weisskopf, M. C. 1983, ApJ, 272, 256
- Lee et al. (2012) Lee, K. J., Guillemot, L., Yue, Y. L., Kramer, M., & Champion, D. J. 2012, MNRAS, 424, 2832
- Li et al. (2017) Li, J., Torres, D. F., Cheng, K.-S., et al. 2017, ApJ, 846, 169
- Mahy et al. (2015) Mahy, L., Rauw, G., De Becker, M., Eenens, P., & Flores, C. A. 2015, A&A, 577, A23
- Malyshev & Chernyakova (2016) Malyshev, D., & Chernyakova, M. 2016, MNRAS, 463, 3074
- Marcote et al. (2018) Marcote, B., Ribó, M., Paredes, J. M., Mao, M. Y., & Edwards, P. G. 2018, A&A, 619, A26
- Martins & Plez (2006) Martins, F., & Plez, B. 2006, A&A, 457, 637
- Meurs & van den Heuvel (1989) Meurs, E. J. A., & van den Heuvel, E. P. J. 1989, A&A, 226, 88
- Minniti et al. (2010) Minniti, D., Lucas, P. W., Emerson, J. P., et al. 2010, New A, 15, 433
- Nolan et al. (2012) Nolan, P. L., Abdo, A. A., Ackermann, M., et al. 2012, ApJS, 199, 31
- Rajoelimanana et al. (2011) Rajoelimanana, A. F., Charles, P. A., & Udalski, A. 2011, MNRAS, 413, 1600
- Rea et al. (2011) Rea, N., Torres, D. F., Caliandro, G. A., et al. 2011, MNRAS, 416, 1514
- Rieke & Lebofsky (1985) Rieke, G. H., & Lebofsky, M. J. 1985, ApJ, 288, 618
- Sault et al. (1995) Sault, R. J., Teuben, P. J., & Wright, M. C. H. 1995, Astronomical Data Analysis Software and Systems IV, 77, 433
- Saz Parkinson et al. (2016) Saz Parkinson, P. M., Xu, H., Yu, P. L. H., et al. 2016, ApJ, 820, 8
- Scargle (1982) Scargle, J. D. 1982, ApJ, 263, 835
- Schinzel et al. (2017) Schinzel, F. K., Petrov, L., Taylor, G. B., & Edwards, P. G. 2017, ApJ, 838, 139
- Schlafly & Finkbeiner (2011) Schlafly, E. F., & Finkbeiner, D. P. 2011, ApJ, 737, 103
- Seward et al. (2012) Seward, F. D., Charles, P. A., Foster, D. L., et al. 2012, ApJ, 759, 123
- Stellingwerf (1978) Stellingwerf, R. F. 1978, ApJ, 224, 953
- Süveges (2014) Süveges, M. 2014, MNRAS, 440, 2099
- Takahashi et al. (2009) Takahashi, T., Kishishita, T., Uchiyama, Y., et al. 2009, ApJ, 697, 592.
- Vacca et al. (1996) Vacca, W. D., Garmany, C. D., & Shull, J. M. 1996, ApJ, 460, 914
- VanderPlas (2018) VanderPlas, J. T. 2018, ApJS, 236, 16
- Verner et al. (1996) Verner, D. A., Ferland, G. J., Korista, K. T., & Yakovlev, D. G. 1996, ApJ, 465, 487
- Wilms et al. (2000) Wilms, J., Allen, A., & McCray, R. 2000, ApJ, 542, 914
- Wilson et al. (2011) Wilson, W. E., Ferris, R. H., Axtens, P., et al. 2011, MNRAS, 416, 832
- Wu et al. (2018) Wu, J., Clark, C. J., Pletsch, H. J., et al. 2018, ApJ, 854, 99
- Xing et al. (2017) Xing, Y., Wang, Z., & Takata, J. 2017, ApJ, 851, 92
- Zanin et al. (2016) Zanin, R., Fernández-Barral, A., de Oña Wilhelmi, E., et al. 2016, A&A, 596, A55
- Zdziarski et al. (2017) Zdziarski, A. A., Malyshev, D., Chernyakova, M., & Pooley, G. G. 2017, MNRAS, 471, 3657
- Zdziarski et al. (2018) Zdziarski, A. A., Malyshev, D., Dubus, G., et al. 2018, MNRAS, 479, 4399
| ObsID | Start Time (UT) | End Time (UT) | Phasea | Exposureb | Count Ratec | Fluxd |
|---|---|---|---|---|---|---|
| 00041805001 | 2011-10-04 02:55:00 | 2011-10-04 23:05:29 | 0.831–0.890 | 3.1 | 4 | 9 |
| 00041805002 | 2011-10-08 20:56:00 | 2011-10-08 21:48:29 | 0.177–0.178 | 1.0 | 1 | 3 |
| 00042313001 | 2011-10-10 14:52:59 | 2011-10-10 15:44:59 | 0.304–0.305 | 0.5 | 4.9 | 11 |
| 00041805003 | 2011-11-01 22:55:00 | 2011-11-01 23:49:51 | 0.933–0.934 | 1.3 | 2 | 4 |
| 00042320001 | 2012-03-10 10:58:00 | 2012-03-10 11:49:44 | 0.376–0.377 | 0.6 | 4.5 | 10 |
| 00041805005 | 2012-09-21 09:30:59 | 2012-09-22 23:05:25 | 0.592–0.704 | 4.6 | 5 1 | 13 3 |
| 00084747001 | 2015-02-19 18:29:00 | 2015-02-19 18:39:00 | 0.861–0.861 | 0.6 | 14.4 | 33 |
| 00084747003 | 2016-12-04 01:34:00 | 2016-12-04 01:39:00 | 0.500–0.500 | 0.3 | 8 | 20 |
| 00084747004 | 2016-12-07 02:53:00 | 2016-12-07 20:41:00 | 0.722–0.777 | 1.1 | 3 | 7 |
| 00084747005 | 2016-12-15 03:54:00 | 2016-12-15 03:59:00 | 0.309–0.309 | 0.2 | 8 | 18 |
| 00084747006 | 2017-09-22 02:07:00 | 2017-09-22 02:25:00 | 0.794–0.795 | 1.0 | 4 | 10 |
| 00084747007 | 2017-12-07 05:30:00 | 2017-12-07 05:47:00 | 0.346–0.347 | 0.9 | 10 | 22 |
| 00084747008 | 2017-12-09 00:35:00 | 2017-12-09 00:48:00 | 0.477–0.478 | 0.7 | 10 | 24 |
| 00084747009 | 2017-12-13 17:50:00 | 2017-12-13 17:55:00 | 0.821–0.822 | 0.2 | 11.5 | 27 |
| 00084747010 | 2018-05-16 10:02:00 | 2018-05-16 13:35:00 | 0.027–0.038 | 3.9 | 1.0 | 2 |
| 00084747011 | 2018-05-19 08:09:00 | 2018-05-19 11:48:00 | 0.241–0.251 | 3.9 | 1.5 | 4 2 |
| 00084747012 | 2018-05-22 11:01:00 | 2018-05-22 14:46:00 | 0.468–0.479 | 3.9 | 6 2 | 14 |
| 00084747013 | 2018-05-25 07:43:00 | 2018-05-25 11:05:00 | 0.677–0.687 | 3.7 | 5 1 | 12 3 |
| 00084747014 | 2018-05-28 04:14:00 | 2018-05-28 07:36:00 | 0.885–0.895 | 3.8 | 3 1 | 8 |
| 00084747015 | 2018-05-31 08:51:00 | 2018-05-31 18:32:00 | 0.118–0.147 | 3.2 | 1.2 | 3 |
| 00084747016 | 2018-06-03 03:30:00 | 2018-06-03 06:53:00 | 0.320–0.330 | 3.9 | 4 | 10 |
| 00084747017 | 2018-06-06 00:21:00 | 2018-06-06 05:09:00 | 0.529–0.544 | 4.0 | 5 1 | 12 3 |
| 00084747018 | 2018-06-09 09:29:00 | 2018-06-09 20:54:00 | 0.776–0.810 | 3.9 | 5 1 | 11 3 |
| 00084747019 | 2018-06-17 15:25:00 | 2018-06-17 20:25:00 | 0.377–0.392 | 3.8 | 7 2 | 16 4 |
Note. — a Phase zero is defined as the epoch of maximum flux in the Fermi LAT (MJD 56498.7) .
b The net exposure time spread over several snapshots. Units are ks.
c Count Rate is in the 2–10 keV energy band. Units are 10-3 counts s-1. Errors are at the 1 level.
d Unabsorbed Swift XRT flux in the 1.0–10.0 keV bandpass converted with PIMMS. Units are 10-13 erg cm-2 s-1.
e 3 upper limits.
| Source | (MeV) | (lp index) | |
|---|---|---|---|
| 4FGL J1405.1-6119 | 1910.99 | 2.792 0.076 | 0.302 0.048 |
| 4FGL J0240.5+6113a | 1177.76 | 2.396 0.008 | 0.152 0.005 |
| 4FGL J0535.2-6736b | 752.28 | 2.609 0.090 | 0.153 0.061 |
| 4FGL J1018.9-5856c | 1772.77 | 2.678 0.023 | 0.236 0.014 |
| 4FGL J1826.2-1450d | 1031.04 | 2.581 0.023 | 0.124 0.015 |
| Time | Half Duration | Configuration | Flux Density | Error | Flux Density | Error |
|---|---|---|---|---|---|---|
| (MJD) | (days) | 5.5 GHz (mJy) | 5.5 GHz (mJy) | 9 GHz (mJy) | 9 GHz (mJy) | |
| 58074.051677 | 0.054630 | 1.5C | 1.43 | 0.22 | 0.59 | 0.14 |
| 58227.832580 | 0.034491 | H168 | 0.35 | 0.09 | 0.36 | 0.09 |
| 58258.472279 | 0.143056 | 6D | 1.81 | 0.06 | 1.28 | 0.06 |
| 58259.465913 | 0.148727 | 6D | 1.49 | 0.11 | 1.25 | 0.08 |
| 58266.432869 | 0.129572 | 6D | 1.36 | 0.04 | 0.86 | 0.03 |
| 58268.246122 | 0.064699 | 6D | 0.85 | 0.22 | 0.51 | 0.08 |
| 58277.279860 | 0.024132 | 6D | 1.22 | 0.08 | 0.34 | 0.06 |
| 58278.287325 | 0.023843 | 6D | 1.32 | 0.07 | 0.70 | 0.06 |
| 58409.903240 | 0.052257 | 6A | 1.60 | 0.17 | 1.12 | 0.09 |
| 58411.935300 | 0.049479 | 6A | 1.03 | 0.40 | 1.15 | 0.17 |
| 58427.816723 | 0.054514 | 6B | 1.04 | 0.14 | 0.63 | 0.12 |
| 58441.821527 | 0.003414 | 6B | 1.31 | 0.26 | 0.77 | 0.11 |
| 58445.044617 | 0.121181 | 6B | 0.92 | 0.15 | 0.57 | 0.16 |
| 58446.951851 | 0.091377 | 6B | 0.82 | 0.05 | 0.53 | 0.05 |
| 58460.747800 | 0.117766 | H168 | 0.55 | 0.07 | 0.54 | 0.05 |
Note. — The stated errors combine the statistical error, determined from RMS values in the region surrounding CXOGSG J140514.4-611827, and a systematic error conservatively taken to be 5% in the flux density scale between epochs. The ATCA array configurations are the standard names for the physical locations of the antennas: see https://www.narrabri.atnf.csiro.au/operations/array_configurations/configurations.html for full details of the antenna spacings in each array configuration.
| Color | R&L | S&F |
|---|---|---|
| distance (kpc) E(B-V) | distance (kpc) E(B-V) | |
| H - K (2MASS) | 8.1 (8.76) | 6.6 (11.56) |
| H - K (VVV) | 7.9 (9.12) | 6.4 (12.0) |
| J - H (VVV) | 8.9 (8.65) | 8.0 (11.0) |