e-science, complexity, systems theory
Claudius Gros
Five decades of US, UK, German and Dutch music charts show that cultural processes are accelerating
Abstract
Analyzing the timeline of US, UK, German and Dutch music charts, we find that the evolution of album lifetimes and of the size of weekly rank changes provide evidence for an acceleration of cultural processes. For most of the past five decades number one albums needed more than a month to climb to the top, nowadays an album is in contrast top ranked either from the start, or not at all. Over the last three decades, the number of top-listed albums increased as a consequence from roughly a dozen per year to about 40.
The distribution of album lifetimes evolved during the last decades from a log-normal distribution to a powerlaw, a profound change. Presenting an information-theoretical approach to human activities, we suggest that the fading relevance of personal time horizons may be causing this phenomenon. Furthermore we find that sales and airplay based charts differ statistically and that the inclusion of streaming affects chart diversity adversely.
We point out in addition that opinion dynamics may accelerate not only in cultural domains, as found here, but also in other settings, in particular in politics, where it could have far reaching consequences.
keywords:
music charts, timescales, social acceleration, self-organized criticality1 Introduction
Music charts constitute a valuable source for the study of extended timelines of culturally and socially relevant data. One of the most influential collection of music charts, the US-based Billboard charts, has been used in this context to examine the evolution of popular music and to test theories of cultural change mauch2015evolution . Other approaches concentrated on the fractional representation of race and gender lafrance2018race ; flynn2016objectification , on the distribution of blockbusters among superstars ordanini2016fewer , on linguistic and
psychological aspects nishina2017study ; nunes2015power , and on the question whether there is a trend towards a converging global popular music culture achterberg2011cultural . For the UK charts, a correlation analysis between musical trends, acoustic features and chart success has been performed interiano2018musical . On a general level the interplay between significance and popularity has been investigated for the case of online music platforms monechi2017significance .
An especially interesting aspect of music charts is that they allow to study if and how time scales that are potentially relevant for cultural and sociological developments have changed over the last five decades. This is a central theme for the theory of social acceleration rosa2013social , which presumes that social and cultural time scales have seen a continuing acceleration vostal2017slowing . The pace of time is also a key determinant for liberal democracies scheuerman2004liberal , which are based on reliable temporal ties between politics and electorate goetz2014question .
Empirical studies attempting to determine quantitatively the long-term evolution of political, social or cultural time scales are rare ulferts2013acceleration ; rosaPrivatComm . Here we point out that music charts allow to investigate the long-term evolution of a given cultural time scale. For the US, the UK, the German and the Dutch charts we find that several core chart characteristics, such as the overall chart diversity, the album lifetime and the entry position of number one albums, indicate that the pace of the underlying generative processes has accelerated substantially over the last decades, by a factor of two or more, in particular since the rise of the internet. The evolution of the US Billboard and the German music charts are very similar, with the Dutch charts showing a time lag of roughly a decade. The UK charts are on the other side more conservative, in the sense that their statistics changed less dramatically since the early 80s.
For the number one albums we find a complete reversal between the early decades, from the 60s to the 80s, and the situation as of today. In the past essential no number one album would start at the top of a chart. Reaching the top was instead a tedious climbing process that would take on the average an entire month, or more. Nowadays the situation is the opposite. If an album is not the number one the first week of its listing, it has only a marginal chance to climb to the top later on. We believe that these empirical findings constitute quantitative evidence that the time scales determining cultural penetration and opinion formation processes have shortened substantially, in particular since the early 90s.
Besides averaged quantities, we examine in detail the distribution of album lifetimes. The probability distribution that an album is listed overall for a certain number of weeks has seen a conspicuous evolution over the last 3-4 decades, with a log-normal distribution changing continuously into a powerlaw. This evolution can be interpreted as a self-organizing process unfolding slowly over the course of several decades. This is a unique observation, as one can study in general only the dynamics of critical states, the end state, but not critical states in the making, viz while they are forming markovic2014power .
The formation of log-normal and powerlaw distributions can be interpreted within an information-theoretical approach to human activities, that we present. Within this approach human activities are assumed to produce maximum entropy distributions, that is distributions for which the information content is maximal. The exponential distribution, which is entropy-maximal under the constraint of a given mean, becomes a powerlaw once the Weber-Fechner law is taken into account, namely that the brain discounts sensory stimuli, numbers and time logarithmically. hecht1924visual ; dehaene2003neural ; howard2018memory . Considering next that people differ with respect to their preferences, which includes having distinct expectations for the mean of the distribution to be generated, one obtains a log-normal distribution. Using this framework we propose that the observed change from a log-normal lifetime distribution to a powerlaw is due to a decoupling of the individual time horizons from decision making. There is no need to plan a trip to the next music store, to illustrate this statement, when an album can be bought on the spot, online, once somebody has discovered a song of her or his liking.
Music charts come in two varieties. As weekly sales charts, which is typically the case for albums, and as airplay charts, for which the number of times a song is aired by radio stations is counted. For airplay data, which are often included for single charts, the underlying generative process is the decision making of a restricted number of radio operators. Sales statistics results in contrast from the collective behavior of a potentially very large number of individuals. It is hence not surprising that the statistics of airplay and sales charts differ, as we find, on a fundamental level. The tendency to self-organize observed for sales charts does not manifest for airplay charts. In this study we concentrate on sales, viz album charts.
Within the last decade most algorithms used to determine chart rankings have been updated with respect to the inclusion of streaming and downloads. We find that streaming tends to reduce both the number of albums making it to a chart, the chart diversity, and the inner mobility, that is the average weekly rank changes.
2 Results
The US billboard charts, the UK charts, the German and the Dutch music charts were obtained from public internet sources billboardCharts ; britishCharts ; germanCharts ; dutchCharts . An important parameter is the length of a chart, which typically increased over the years. For quantities that can be normalized with respect to the number of entries available in a given year, the entire timeline can be examined. For other features, quantities that depend on absolute and not on relative rankings, we restricted the analysis to charts that list at least the top 40/100 albums, which has been the case since 1963/1967/1978/1979, and respectively since 1963/1982/1993/1990, for the Billboard, the UK, the German and the Dutch album charts. Somewhat special are the US Billboard album charts, which increased to in 1968. In the graphs we indicate, when suitable, whether top 100 or less chart ranks where available.
The algorithms used for the compilation of the individual charts have been adjusted over time, mostly in minor ways. A major update occurred for the Billboard charts in 2014/15, when the traditional sales-based ranking was substituted by a ranking based on a multi-metric consumption rate, which includes weighted song streaming. This update, which took effect end of 2014, affected the chart statistics profoundly. Streaming data was included respectively since 2014/2016/2017 for the Dutch, the UK and the German charts.
The original Billboard album chart, the Billboard Top 200, was retained after the 2014/15 metric update under a new name, as ‘Top Album Sales’. Data continuity is consequently achieved when using, as we have done, the Top Album Sales charts from 2014/15 on. Whenever possible we will show results obtained from both the Billboard Top 200 and the Top Album Sales charts, where the latter are compiled according to the unaltered sales-based ranking rules, albeit only for 100 ranks. For the UK, German and Dutch charts only the version including streaming is accessible after the respective metric changes.
2.1 Chart diversity - the negative effect of streaming
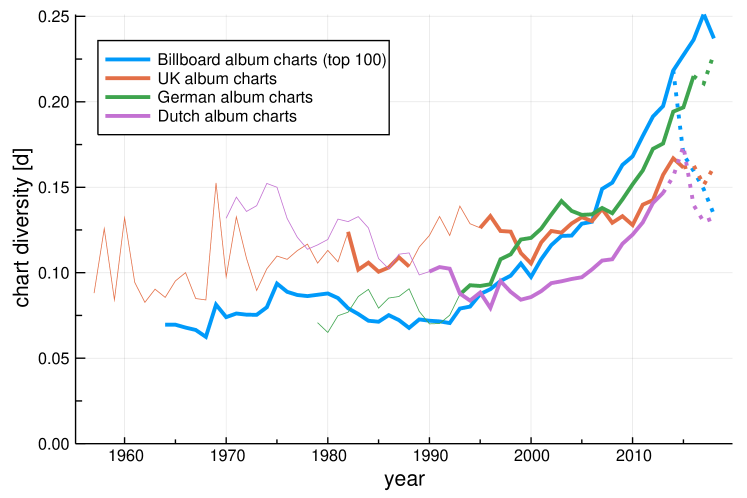
For a first understanding of the data we examine the evolution of the overall number of albums making it to the charts in a given year. As a gauge for the chart diversity we normalize the number of distinct albums listed in a given year by the overall number of available slots. A top 100 chart could list, to give an example, a maximum of distinct albums per year. The average number of weeks an album is listed in a given year is then just of the order of the inverse chart diversity, . The overall chart lifetime of albums will be discussed further below.
In Fig. 1 the evolution of the chart diversity is presented on a year to year basis. One notices that the US and German charts follow qualitatively and quantitatively similar trends and that the chart diversity increases rapidly since the early 1990s. The average number of weeks an album was listed in a given year in these two countries decreased correspondingly from about in 1990 to in 2014/15. For this instance cultural processes accelerated by a factor more than two.
The Billboard charts data was split in 2014/15, when the traditional sales-based ranking was supplemented by a multi-metric consumption rate that includes streaming. For the latter the trend to become more diverse reversed. Similar but less pronounced effects can be observed for the UK and the Dutch charts, but not for the German music charts. Note in this respect, that there are different routes, as detailed in the Appendix, on how to include streaming and song downloads.
Over their entire histories, the diversity of the British and Dutch music charts does not show pronounced trends. However, as visible in Fig. 1, a measurable increase in diversity is observed for the last two decades. The underlying reason for the otherwise distinct behaviors of the Dutch and UK charts with respect to the US and German charts is at present not evident.
2.2 Album lifetimes - a self-organized critical state in the making
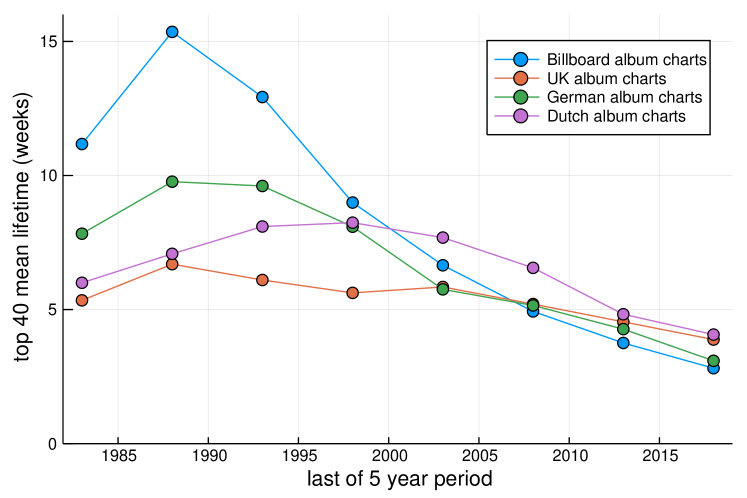
For all charts we have evaluated the number of weeks a given album remains within the listed range, the lifetime of an album. The lifetime is an absolute number which is not easily normalizable relative to the number of ranks available. In order to be able to compare the four charts over a comparatively long time span, we analyze only the top 40 albums. This restriction allows us to go back till 1979, the year when the Dutch charts increased their length to 40 ranks. For the Billboard charts we checked also the long-term evolution for the top 100 albums, finding very similar trends.
The mean album lifetime pooled over trailing 5-year periods is presented in Fig. 2. The top 40 lifetime is roughly inversely proportional to the chart diversity shown in Fig. 1, which is however normalized to the chart length on a yearly basis. For the Billboard charts the mean lifetime has seen a reduction by more than a factor two over the last 25 year.
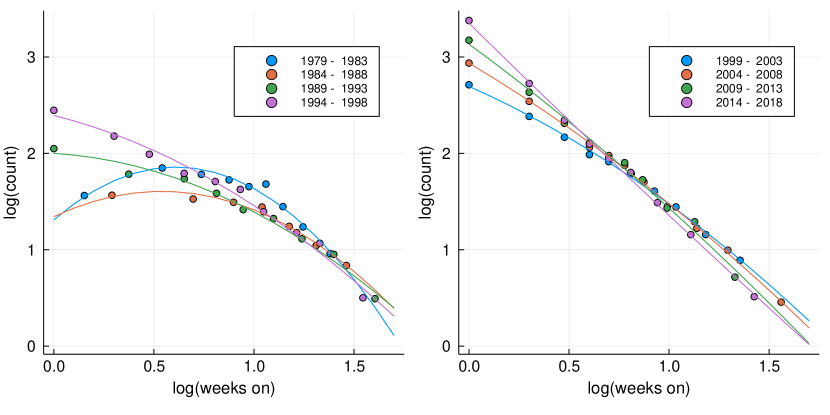
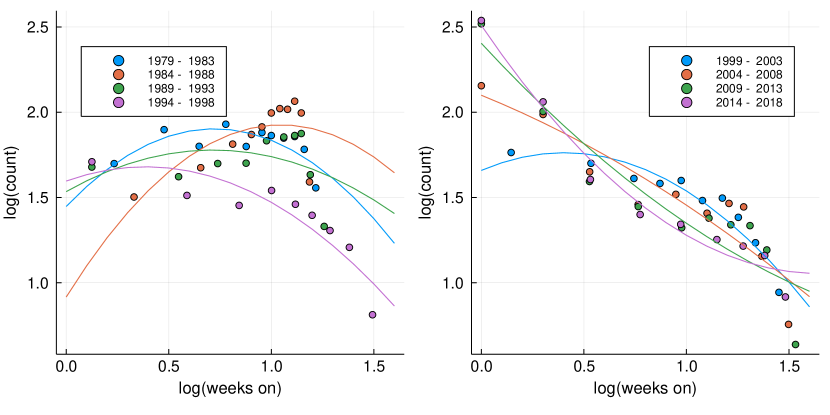
Our main focus is the lifetime distribution, which is defined as the probability for an album to remain listed weeks. We find that can be fitted quite accurately by a log-normal distribution,
| (1) |
as shown as a log-log plot in Fig. 3 for the US Billboard charts. One observes that the lifetime distribution evolves steadily over the course of roughly 4 decades, from a quadratic to a linear dependency in a log-log representation. The lifetime distribution reduces to a powerlaw in the limit , an indication of a critical state markovic2014power .
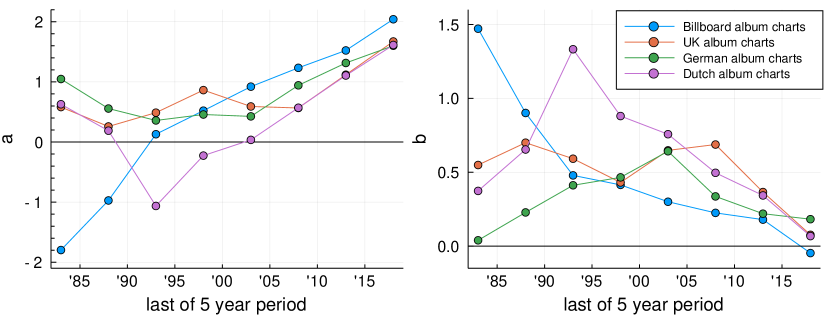
In Fig. 4 the evolution of the fit parameters and entering (1) are shown for all charts investigated. One observes that tends to become small, in particular for the last 30 years, with the exponent approaching . We note that an exponent of 2 is marginal, as the mean of diverges formally for and . Nearly marginal exponents are however not uncommon markovic2014power , with a well-known example being the in-degree of domains in the world wide web gros2012neuropsychological .
The occurrence of powerlaws in evolving systems indicates the emergence of a self-organized critical state bak1987self . In general it is to be expected that social systems, like the well studied network of scientific collaborations barabasi2002evolution , are characterized by evolving parameters. The data for the lifetime distribution presented in Figs. 3 and 4 is however unique, in the sense that it allows to examine not only the final state, but the entire self-organizing process. A derivation of (1) based on an information-theoretical analysis will be presented in Sect. 3.
2.3 Number one albums – the start determines the fate
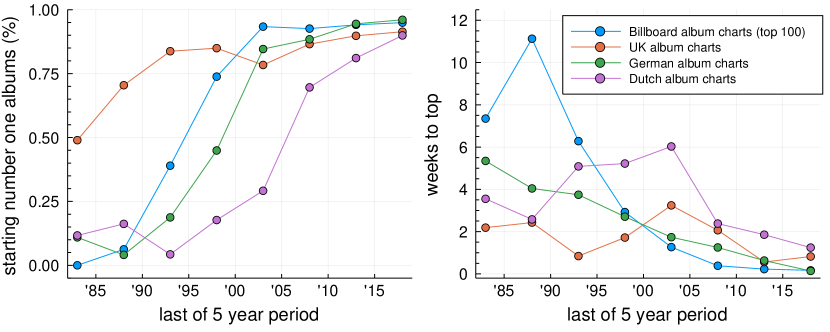
Commercial performance in terms of weekly sales varies vastly between albums. Of key importance is in this regard the first rank an album attains, the entry position. In Fig. 5 we present the probability that a number one album started as such. In the past essentially no album started on the top and albums succeeding to reach the top could take a month or more to do so. Today the situation is reversed, with the reversal being nearly complete for the US, the German and the Dutch charts, and somewhat reduced in magnitude for the UK charts. A time lag of about a decade is furthermore observable between the Billboard and the Dutch charts.
The rising predominance of number one entries is reflected in the number of weeks an album needs on the average to climb to the top, the climbing time. The zero for the data shown in Fig. 5 is set to the top, which implies that the climbing time for albums entering at the top is zero. It is quite remarkable that the average climbing time has seen, modulo fluctuations, a dramatic decrease both for the Billboard and the German music charts. This observation holds to a certain extend also for the Dutch charts, but not for the UK charts, which changed less over the last three decades. This more conservative evolution of the UK charts is consistent with the results for the chart diversity shown in Fig. 1. Overall we believe that the data presented in Fig. 5 provides convincing evidence that the market penetration of new albums is now very fast, taking on the average a week or less, depending on the country. Three decades ago, the same process took about 2-3 weeks in the UK and more than the double in the US.
In Table 1 we present for the Billboard album charts a compendium of statistical data that describes the dynamics of number one albums. For the order of the average first and second week ranks one observers a reversal in in the ordering. Before the mid-90s albums climbed, afterwards the rank could only decay. Also evident is a substantial shortening of the number of weeks at the top, which was defined here as the number of weeks from the first to the last time an album was listed with a rank of one, including hence interruptions, which are of the order of 10-20%. As of today, albums are given little time to stay at the top, as number of albums attaining the top rank in a given year has increased so strongly, by a factor 3-4 since the 80s, that the number of yearly number one albums starts to approach the maximum of 52, compare Table 1.
2.4 Entry and exit positions - ongoing symmetrization
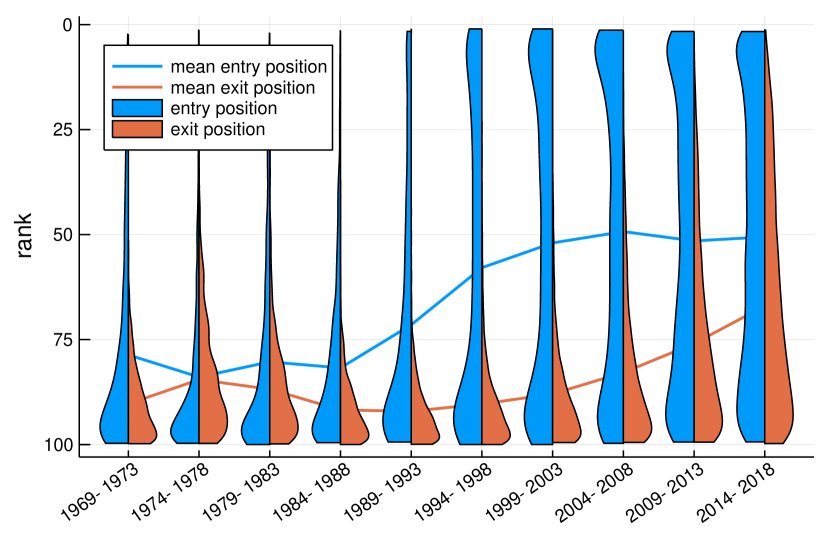
How likely is it, that a given album manages to climbs at all, once in the charts? The evolution of the mean entry ranks is shown in Fig. 6 for the Billboard charts, together with the mean exit positions. For the full entry and exit distributions, also included in Fig. 6, Gaussian-broaden violin graphs have been generated, with the horizontal width being proportional to the probability of finding an entry/exit position within the respective five-year period. The data for the UK, German and Dutch is similar, but in part less pronounced.
The first-listing ranks are due to external effects, such as the quality of the album and the size and the penetration speed of publicity campaigns. The distance of the average exit ranks to the bottom, located at one hundred in our case, is on the other side determined by the size of the average inner mobility, for which we will provide a specific definition in the next section. Here we point out that the exit ranks are in general rising, which means that the inner mobility is accelerating.
The full entry rank distribution presented in Fig. 6 is consistent with the data for number one albums shown in Fig. 5, in the sense that the probability of higher entry positions has been continuously increasing since the early 90s. A remarkable and somewhat astonishing result is the symmetry the entry distribution exhibits nowadays with respect to 50, the half-way rank between the bottom and the top. We checked that this observation holds also for the entry distribution of top 40 and top 200 albums.
1973 1978 1983 1988 1993 1998 2003 2008 2013 2018 #1 first R 43.7 45.4 34.8 43.8 21.5 7.5 3.4 1.6 1.4 1.8 #1 second R 17.6 22.1 20.2 26.3 10.1 6.3 5.0 4.4 5.0 8.1 #1 exit R 91.7 86.3 89.5 93.6 92.2 93.6 91.9 89.9 85.1 74.9 #1 climb W 5.4 7.1 7.2 11.1 6.3 2.9 1.3 0.4 0.2 0.2 #1 top W 4.4 4.0 5.7 5.4 4.4 2.4 2.2 1.5 1.5 1.3 #1 exit W 34.6 24.5 30.5 40.9 43.7 37.1 33.0 29.8 28.5 23.5 #1 albums 12.4 14.0 10.0 10.8 13.2 22.6 25.6 36.0 35.0 41.0 all first R 78.6 83.9 80.1 81.7 71.5 57.9 52.0 49.3 51.5 50.6 all exit R 90.2 84.9 86.4 91.7 92.2 90.3 88.1 83.0 76.3 67.6 all lifetime W 16.4 12.9 14.0 16.9 14.8 11.7 9.2 7.0 4.9 3.5
2.5 Inner mobility - accelerating rank decay
Once an album makes it to a chart, it may go up and down on a weekly basis. We define the relative inner mobility as
| (2) |
where is the rank a given album has in week , and where denotes the average over all albums within a certain period. Entry and exit weeks are not included. The max-function in (2) ensures that . For the sign we have two cases.
-
•
Climbing: . The contribution to (2) is , which is positive.
-
•
Descending: . The respective term is , which is negative.
Instead of one can study the absolute inner mobility , which would however weight an increase from 90 to 80 equal to an advancement from rank 11 to rank 1.
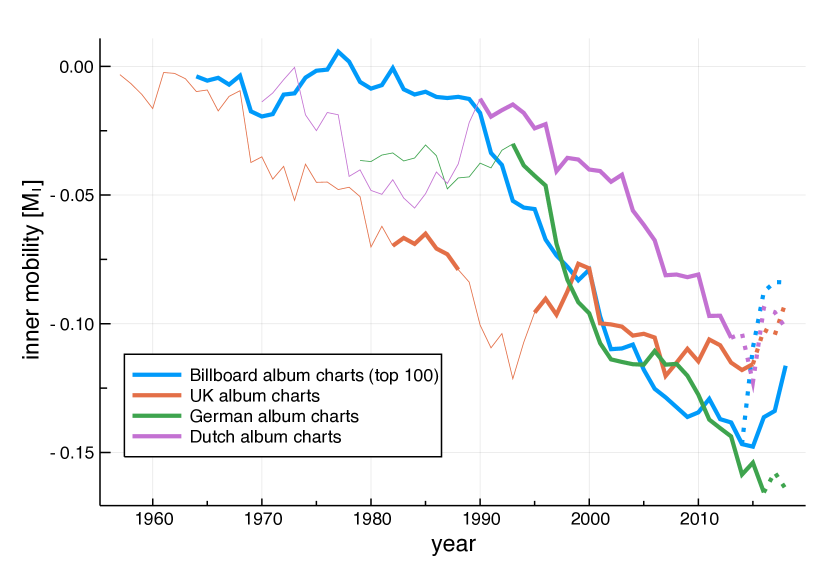
The data for the inner mobility presented in Fig. 7 shows that albums mostly lose rank on the average, namely that . It is also evident that the weekly rank loss tends to increase in size over time before streaming was included. Modulo substantial fluctuation, this is the case for all four charts investigated, with the German and the US charts trailing each other surprisingly close. Similar downward trends are also observable for the Dutch and the UK charts, which was not the case for the chart diversity shown in Fig. 1. The timeline for the Dutch music chart can be interpreted by a time lag of roughly a decade. For the UK charts decreased in contrast earlier, already during the 70s and 80s.
With being equivalent to a weekly decay rate, we can define the decay time , which measures the time scales of the inner dynamics. Between 1990 and 2010, increased by about a factor of three for the the Billboard, the German and the Dutch charts, with a similar acceleration happening for the UK charts 20 years earlier. In terms of the inner dynamics, all four charts indicate that cultural time has been accelerating, albeit not necessarily at the same time and at the same pace.
The observation that albums move down on the average implies that the average exit position is below the mean rank of first listings, which is consistent with the average entry and exit positions presented in Fig. 6. Recently a class of model describing unidirectional growth processes that are terminated by a hard reset has been studied biro2018unidirectional . It is an interesting question whether the inner mobility, as presented in Fig. 7, could be described by an analogous but inverse dynamics.
2.6 Billboard single charts - why airplay statistics differ
The Billboard single charts are based on a mix of sales data, jukebox playing and airplay, where the latter counts the number of times a song is aired by radio stations. The relative contributions have been adapted over the years, with a major change occurring in 2013, when streaming was included. We find that the Billboard album and single charts differ substantially with respect to their statistical properties, presumable because the single charts include airplay, whereas the album charts do not. Album sales are the result of a large number of individual decisions, whether to buy or not, which reflects an extended range of individual preferences. It is on the other side up to a relatively small group of radio operators to select the mix of songs that is likely to induce the targeted audience of the radio station to remain tuned in.
One can see that the lifetime distribution of singles and albums are distinct when comparing Figs. 3 and 8. The log-log plot of the top 40 single lifetimes presented in Figs. 8 shows that quadratic fits are very poor, which implies that single lifetimes cannot be described by (1) and that there is no evolution from a log-normal distribution to a powerlaw. A certain tendency for the data to become more straight is however present, possibly due to a crossover effect. Radio program directors will be aware, in general, of the commercial success of the respective albums. Songs from top ranked albums can hence be expected to enjoy a higher chance to be aired.
2.7 International statistical convergence
The picture emerging from our statistical analysis, like the inner mobility, see Fig. 7, is that the charts of two countries, Germany and the US, show very similar trends. This would be trivially the case if most of the songs making to the charts in Germany and in the US would be the identical. A previous comparative study of American, Dutch, French, and German popular music charts found however no evidence for an ongoing internationalization of popular music achterberg2011cultural . With regard to this question, which is not at the heart of our present investigation, we note that a comparison of the all-time most successful albums yields, as listed in Table 2 in the Appendix, a similar result. Among the all-time top five German albums two feature, to give an example, German ‘Schlager’, by Helene Fischer, with another one being a compilation of German action songs for the Kindergarten, ‘Die 30 besten Spiel…’. There is on the other side more overlap between the all-time top 5 of the UK and the US album charts, even though these two charts differ to a certain extend with respect to their overall statistical properties. A more thorough investigation of this subject is left to future studies.
3 Information theory of human activities
A large-scale study of the statistics of data files publicly available on the internet showed that the size distribution of formats having a time dimension, like videos and audio files, differs from static formats, such as jpeg and gif images gros2012neuropsychological . The difference is that videos and audio files are log-normal distributed, with the file-size distribution of images following a powerlaw. As a tentative explanation it was suggested that the time domain corresponds for data files to a second dimension, in addition to resolution, and that the statistical distributions resulting from human activities may be analyzed in many instances from an information-theoretical perspective gros2012neuropsychological . Here we suggest that the results presented in Figs. 3 and 4, namely that the statistics of album lifetimes evolved from a log-normal distribution to a powerlaw, may be analyzed along an analogous line of arguments.
Our underlying hypothesis is that there is a feedback loop between the activities carried out by a large number of individuals and the statistical ensembles produced by these activities. For the case of music charts this presumption implies that there is a feedback between the lifetime distribution, which results from people buying music, and the individual decision to acquire a certain album. E.g., the decision to go for an album maybe influenced by the number of weeks the album is already on the chart, and hence playing on the radio. If this hypothesis holds, it is reasonable to assume that the resulting distribution should maximize information in terms of Shannon’s information entropy gros2015complex .
3.1 Human logarithmic discounting generates powerlaws
The neurophysiological processes that give rise to the ability of the human brain to process and record information determine a subjective value one attributes to an information source hecht1924visual ; buzsaki2014log ; dehaene2003neural . This relation is known as the Weber-Fechner law. It states that the neural representations of sensory stimuli hecht1924visual , numbers nieder2003coding ; dehaene2003neural ; nieder2002representation , and time takahashi2005loss ; howard2018memory , scale logarithmically respectively with the intensity of the bare stimulus, the number of objects and the length of a time span.
The Weber-Fechner law determines which type of distribution, say of perceived stimuli , is perceived to carry maximal information. Consider that the neural working regime prefers a certain mean for the perceived stimulus intensity, . The probability distribution of perceived stimuli maximizing entropy is then an exponential, . The Weber-Fechner law implies that the external, the physical measurable stimulus , is logarithmically discounted, namely that , where is a characteristic scale. Using one then finds
| (3) |
for the maximal entropy distribution when expressed as a function of the afferent stimulus . Maximization of information entropy under a logarithmic cost function yields hence generically a powerlaw, as shown here for the case of a single relevant variable. This viewpoint is complementary to dynamical approaches, such as the reinforcement loop via preferential attachment, that is the ‘the rich get richer’ principle barabasi1999emergence . For the case of music charts one has in consequence that the lifetime distribution with the maximal information content is a powerlaw.
3.2 Entropy maximization with variable mean
A maximum entropy distribution is obtained by maximizing the objective function
| (4) |
where is the probability density of . The first contribution to is the entropy and the second the weighted average . The Lagrange parameter corresponds therefore to the relative weight of the average, the constraint. When is large the constraint dominates maximization of .
We now assume that individuals differ with respect to how much importance they give to album lifetimes , which will hence be reflected by the weight of the mean album lifetime . For this we introduce a hidden variable , such that individuals dispose of varying Lagrange parameters , where is a coupling parameter. The joint distribution is then
| (5) |
where is the distribution of , viz the distribution of individual preferences. If we are interested only in the marginal distribution , which is typically the case when the hidden variable is not observable, as in our case, we obtain
| (6) |
when assuming that is normal distributed with mean and standard deviation . We set and absorb the mean into the Lagrange multiplier , which can be done without loss of generality. One finds that a Gaussian leads to a Gaussian marginal ,
| (7) |
which turns into a log-normal distribution, see (1), once the Weber-Fechner log-discounting is taken into account.
This result, Eq. (7), suggest that distributions of observables generated by the activity of a large number of individuals are log-normal when there is a substantial variability of the perceived individual means . One may view (7) as an alternative interpretation of the well known result that Gaussians are maximum entropy distributions when both the first and the second moment, mean and variance, are given gros2015complex . A maximum entropy distribution with an optimized mean and variance is hence equivalent to a maximum entropy distribution for which the optimized mean is variable.
The log-normal distribution (7) evolves into a powerlaw for , viz in two cases, and . The first case, , implies that the hidden variable does not couple to the observable in first place, having hence no effect. All individuals are identical in the second case, . We note that is a functional of , which implies acts as a generating functional, akin to the role generating functionals take in the context of guided self-organization prokopenko2009guided ; gros2014generating , such af for attractor relict networks linkerhand2013generating and Hebbian learning rules echeveste2014generating .
3.3 Time horizons are less important when time accelerates
People differ substantially in behavioral relevant traits, such as the perception of time bartholomew2015analysis . The observation that individual likings are caused in general by a multitude of factors gravetter2016statistics suggests, that the distribution of preferences can be approximated by a Gaussian and that (6) constitutes a faithful representation of a maximum entropy distribution when individual expectations vary.
For the case of music charts, we concentrated on the album lifetime as our primary observable. Chart rankings and the lifetime are determined by weekly buying decisions that depend both on a range of external factors, such as prominent marketing campaigns, but also on the performance of albums on the chart. We postulate here that the hidden variable entering the information-theoretical interpretation via (6) is related to the individual perception of time, the time horizon. A log-normal distribution would then be observed when a substantial coupling to the individual time horizons is present. In this case it would matter, for a buying decision, how long the album in question has already been listed, and hence aired by radio stations and on the internet. A powerlaw is recovered on the other side when the coupling to the individual time horizons ceases to be relevant.
The presumption of a decreasing relevance of the time domain implies that one-time effects suffice increasingly to influence buying decisions. This scenario is not unlikely, given that the rise of the internet opened the possibility to buy music essentially on the spot, e.g. directly after one has heard or discovered a song, online or on the radio. There is no need to plan for a trip to the next music store on a free afternoon, an undertaking that easily led in the past to delays of days and weeks, and with this to a coupling between buying and the personal time horizon. We stress, however, that the arguments for a progressive decoupling of the time horizon are at present only circumstantial and that we cannot rule out that other drivings may cause the observed changes in the chart statistics.
Our argument, that personal time horizons may have seen a decoupling from buying decisions draws support also from the increasing relevance of top entry ranks, as shown in Fig. 5 for number one albums. Before 1990 only very few albums succeeded to enter the charts as number one, which implies that publicity and commercial success needed time, several weeks at least. The situation has changed since the advent of the internet, which allows news about new releases to spread very fast via social media channels. For most people buying an album will not affect the monthly budget substantially, which is hence a decision that can be carried out without further evaluation once taken. The influence of the time domain on buying albums is hence reduced.
4 Discussion: Political time scales and stability
One may ask whether the acceleration of the information flow observed here for the case of music charts may be the reverberation of an equivalent speedup of societal and political processes at large. In this regard we point out that democracies rely in general on a stable and continuous evolution of public opinion enns2013public and that it has been suggested that not only the content of the political discourse is what matters, but in particular also the speed at which public opinion changes gros2017entrenched .
Cultural and political processes condition each other street2015politics , which implies that the respective time scales couple rosa2005speed and that social acceleration will induce, if present and ongoing, a growing mismatch between political time delays, which are entrenched in a representative democracy by the electoral cycle, and the accelerating pace of opinion dynamics. This is an observation with potentially far reaching consequences, as it is known from dynamical systems theory that a mismatch of instantaneous and delayed feedback induces instabilities gros2015complex . The outlook is then, from a dynamical systems perspective, that modern democracies become inevitable unstable once the time scale of public opinion formation is shorter than the time delays characterizing the interaction between electorate and political decision making gros2017entrenched . Whether democracy as such is already in crisis is a question of debate plattner2015democracy ; schmitter2015crisis ; huq2018lose .
5 Conclusion
Book, music and other charts are compiled in order to satisfy the unabated interest fraiberger2018quantifying ; liu2018hot in the commercial and artistic success of music albums, as well as in other products of popular and classical culture. They provide a valuable source for long-term socio-artistic studies as their fundamental ranking criterion, success, has not changed over the last 50 years, albeit modulo technical adjustments. Given the continuity of the ranking metric, changes of the chart statistics occurring over the time span of several decades are therefore reflecting long-term socio-cultural developments.
We find three major trends. Firstly, one observes a substantial increase in the overall number of albums making it to the chart on a yearly basis, the chart diversity. The number of number one albums increased even stronger, it is nowadays around 40 per year for the Billboard album charts. Secondly, the route to become a number one hit has changed dramatically. Instead of climbing arduously from a modest entry rank, number one hits start nowadays as such. Finally we observe that the statistics of album lifetimes has seen a conspicuous change, evolving over the course of several decades towards a critical state. To our knowledge this is the first instance that the self-organization process as such may be studied explicitly markovic2014power ; gros2015complex . Within a proposed information-theoretical approach to human activities, the resulting powerlaw distribution of album lifetimes is due to the growing irrelevance of individuality, in the sense that the time necessary to form an opinion on whether to acquire an album, and to buy it, is now very low. It does not matter if somebody needs only a few minutes to decide to download an album, or as long as a few days, as both timescales are below the chart frequency of one week.
From an additional angle one can interpret the acceleration of chart processes found in this study as a measurable indication that the cultural and social exchange of information occurs nowadays at a substantially faster rate than it used to. While intuitive, this observation could imply that the pace of opinion formation may have accelerated likewise over the past five decades. This would be a worrisome result, as it has been reported that representative democracies need to deal with the growing mismatch between the time delays inherent in political decision making and an ever faster opinion dynamics gros2017entrenched , or face an uncertain future.
chart artist title weeks (all) weeks (con) top rank Billboard (200) Pink Floyd The Dark Side Of The Moon 939 593 1 Bob Marley And The Wailers Legend: The Best Of… 552 260 5 Journey Journey’s Greatest Hits 542 156 10 Metallica Metallica 513 281 1 Guns N’ Roses Greatest Hits 450 138 3 Billboard (100) Metallica Metallica 286 163 1 Adele 21 260 144 1 Bob Marley And The Wailers Legend: The Best Of… 247 31 5 Kendrick Lamar Good kid, m.A.A.d city 236 56 2 Imagine Dragons Night Visions 232 112 2 UK ABBA Gold - Greatest Hits 865 125 1 Queen Greatest Hits 838 224 1 Bob Marley And The Wailers Legend: The Best Of… 801 159 1 Fleetwood Mac Rumours 762 95 1 Meat Loaf Bat Out of Hell 520 203 9 German Andrea Berg Best Of 352 269 18 Helene Fischer Best Of Helene Fischer 337 301 2 ABBA Gold - Greatest Hits 317 60 1 S. S., K. G. & die Kita-Frösche Die 30 besten Spiel- und B.-lieder 290 33 43 Helene Fischer Farbenspiel 245 213 1 Dutch Adele 21 330 167 1 André Hazes De Hazes 100 303 196 2 Buena Vista Social Club Buena Vista Social Club 294 172 7 André Hazes Al 15 jaar gewoon André 257 58 3 Dire Straits Brothers In Arms 248 171 1
6 Appendix
In Table 2 the top 5 most successful albums are listed, according to the overall lifetime, the number of weeks on the respective charts. For the US Billboard charts which have a length of 200, the album lifetimes have been evaluated taking into account either 100 or 200 ranks. For the UK, the German and the Dutch album charts the respective entire data has been evaluated. Also given is the number of consecutive weeks and the respective highest rank reached.
Complementing the major rule updates given in Sect. 2, we present here for completeness an extended history of the Billboard album charts billboard_article_09 ; billboard_article_14 .
1963: The Billboard album charts start with top 150.
1967: Extension first to 175, and then to 200.
1991:
Data source changed from phone call sampling of record stores
to ‘Nielsen SoundScan’.
2010:
Catalog albums (older than 18 month, rank below 100, no single)
are included. Previously they were dropped.
2014:
Metrics changed from a sales-based ranking to one measuring
multi-metric consumption, which includes streaming.
Sales-based album chart takes the name ‘Top Album Sales’.
The weighting of streaming can be performed along several routes. When introduced for the Billboard album charts, 10 song sales or 1500 song streams from an album were treated as equivalent to one purchase of the album. This changed 2018, when 1250 premium audio streams, 3750 ad-supported streams, or 3750 video streams were consider to equal one album unit. For the UK charts only the 12 most streamed songs of an album contribute instead, and not all. The weekly revenue and not the number of downloads enter on the other side the German charts.
\ethics
Not applicable.
The paper deals with an analysis of music charts. The source of the data is given explicitly, references 25,26,27,28. Readers can access the data source, as it is publicly available.
Data acquisition and primary analysis by L.Schneider, study concept and interpretation by C.Gros.
Not applicable.
CG thanks Nathan Valentí for discussions.
Not applicable.
Not applicable.
References
- (1) Mauch M, MacCallum RM, Levy M, Leroi AM. 2015 The evolution of popular music: USA 1960–2010. Royal Society Open Science 2, 150081.
- (2) Lafrance M, Scheibling C, Burns L, Durr J. 2018 Race, gender, and the Billboard Top 40 charts between 1997 and 2007. Popular Music and Society 41, 522–538.
- (3) Flynn MA, Craig CM, Anderson CN, Holody KJ. 2016 Objectification in popular music lyrics: An examination of gender and genre differences. Sex roles 75, 164–176.
- (4) Ordanini A, Nunes JC. 2016 From fewer blockbusters by more superstars to more blockbusters by fewer superstars: How technological innovation has impacted convergence on the music chart. International Journal of Research in Marketing 33, 297–313.
- (5) Nishina Y. 2017 A study of pop songs based on the billboard corpus. International Journal of Language and Linguistics 4, 125–134.
- (6) Nunes JC, Ordanini A, Valsesia F. 2015 The power of repetition: repetitive lyrics in a song increase processing fluency and drive market success. Journal of Consumer Psychology 25, 187–199.
- (7) Achterberg P, Heilbron J, Houtman D, Aupers S. 2011 A cultural globalization of popular music? American, Dutch, French, and German popular music charts (1965 to 2006). American behavioral scientist 55, 589–608.
- (8) Interiano M, Kazemi K, Wang L, Yang J, Yu Z, Komarova NL. 2018 Musical trends and predictability of success in contemporary songs in and out of the top charts. Royal Society Open Science 5, 171274.
- (9) Monechi B, Gravino P, Servedio VD, Tria F, Loreto V. 2017 Significance and popularity in music production. Royal Society Open Science 4, 170433.
- (10) Rosa H. 2013 Social acceleration: A new theory of modernity. Columbia University Press.
- (11) Vostal F. 2017 Slowing down modernity: A critique. Time & Society p. 0961463X17702163.
- (12) Scheuerman WE. 2004 Liberal democracy and the social acceleration of time. JHU Press.
- (13) Goetz KH. 2014 A question of time: Responsive and responsible democratic politics. West European Politics 37, 379–399.
- (14) Ulferts H, Korunka C, Kubicek B. 2013 Acceleration in working life: An empirical test of a sociological framework. Time & Society 22, 161–185.
- (15) Rosa H. Private communication.
- (16) Marković D, Gros C. 2014 Power laws and self-organized criticality in theory and nature. Physics Reports 536, 41–74.
- (17) Hecht S. 1924 The visual discrimination of intensity and the Weber-Fechner law. The Journal of general physiology 7, 235–267.
- (18) Dehaene S. 2003 The neural basis of the Weber–Fechner law: a logarithmic mental number line. Trends in cognitive sciences 7, 145–147.
- (19) Howard MW. 2018 Memory as Perception of the Past: Compressed Time inMind and Brain. Trends in cognitive sciences 22, 124–136.
- (20) Billboard Charts. http://www.billboard.com/.
- (21) Official Charts. http://www.officialcharts.com.
- (22) Official German Charts. http://www.offiziellecharts.de.
- (23) Dutch Charts. http://dutchcharts.nl.
- (24) Gros C, Kaczor G, Marković D. 2012 Neuropsychological constraints to human data production on a global scale. The European Physical Journal B 85, 28.
- (25) Bak P, Tang C, Wiesenfeld K. 1987 Self-organized criticality: An explanation of the 1/f noise. Physical review letters 59, 381.
- (26) Barabâsi AL, Jeong H, Néda Z, Ravasz E, Schubert A, Vicsek T. 2002 Evolution of the social network of scientific collaborations. Physica A: Statistical mechanics and its applications 311, 590–614.
- (27) Biro TS, Neda Z. 2018 Unidirectional random growth with resetting. Physica A: Statistical Mechanics and its Applications 499, 335–361.
- (28) Gros C. 2015 Complex and adaptive dynamical systems: A primer. Springer.
- (29) Buzsáki G, Mizuseki K. 2014 The log-dynamic brain: how skewed distributions affect network operations. Nature Reviews Neuroscience 15, 264.
- (30) Nieder A, Miller EK. 2003 Coding of cognitive magnitude: Compressed scaling of numerical information in the primate prefrontal cortex. Neuron 37, 149–157.
- (31) Nieder A, Freedman DJ, Miller EK. 2002 Representation of the quantity of visual items in the primate prefrontal cortex. Science 297, 1708–1711.
- (32) Takahashi T. 2005 Loss of self-control in intertemporal choice may be attributable to logarithmic time-perception. Medical hypotheses 65, 691–693.
- (33) Barabási AL, Albert R. 1999 Emergence of scaling in random networks. science 286, 509–512.
- (34) Prokopenko M. 2009 Guided self-organization. .
- (35) Gros C. 2014 Generating functionals for guided self-organization. In Guided Self-Organization: Inception , pp. 53–66. Springer.
- (36) Linkerhand M, Gros C. 2013 Generating functionals for autonomous latching dynamics in attractor relict networks. Scientific reports 3, 2042.
- (37) Echeveste R, Gros C. 2014 Generating functionals for computational intelligence: the Fisher information as an objective function for self-limiting Hebbian learning rules. Frontiers in Robotics and AI 1, 1.
- (38) Bartholomew AJ, Meck WH, Cirulli ET. 2015 Analysis of genetic and non-genetic factors influencing timing and time perception. PLoS One 10, e0143873.
- (39) Gravetter FJ, Wallnau LB. 2016 Statistics for the behavioral sciences. Cengage Learning.
- (40) Enns PK, Koch J. 2013 Public Opinion in the US States: 1956 to 2010. State Politics & Policy Quarterly 13, 349–372.
- (41) Gros C. 2017 Entrenched time delays versus accelerating opinion dynamics: Are advanced democracies inherently unstable?. The European Physical Journal B 90, 223.
- (42) Street J, Inthorn S, Scott M. 2015 Politics and popular culture. In From entertainment to citizenship , . Manchester University Press.
- (43) Rosa H. 2005 The speed of global flows and the pace of democratic politics. New Political Science 27, 445–459.
- (44) Plattner MF. 2015 Is democracy in decline?. Journal of Democracy 26, 5–10.
- (45) Schmitter PC. 2015 Crisis and transition, but not decline. Journal of Democracy 26, 32–44.
- (46) Huq A, Ginsburg T. 2018 How to lose a constitutional democracy. UCLA L. Rev. 65, 78.
- (47) Fraiberger SP, Sinatra R, Resch M, Riedl C, Barabási AL. 2018 Quantifying reputation and success in art. Science 362, 825–829.
- (48) Liu L, Wang Y, Sinatra R, Giles CL, Song C, Wang D. 2018 Hot streaks in artistic, cultural, and scientific careers. Nature 559, 396.
- (49) Trust G. 2009 Billboard 200 Undergoes Makeover. Billboard Magazine 11/17.
- (50) Staff B. 2014 Billboard 200 Makeover: Album Chart to Incorporate Streams & Track Sales. Billboard Magazine 11/19.