HST spectra reveal accretion in MY Lupi ††thanks: Based on observations made with the NASA/ESA Hubble Space Telescope, obtained from the data archive at the Space Telescope Science Institute. STScI is operated by the Association of Universities for Research in Astronomy, Inc. under NASA contract NAS 5-26555. Also based on observations collected at the European Southern Observatory at Paranal, under programs 095.C-0134(A), and archive data of programmes 093.C-0476(A) and 093.C-0506(A).
The mass accretion rate is a crucial parameter for the study of the evolution of accretion discs around young low-mass stellar and substellar objects (YSOs). We revisit the case of MY Lup, an object where VLT/X-Shooter data suggested a negligible mass accretion rate, and show it to be accreting on a level similar to other Class II YSOs in Lupus based on Hubble Space Telescope (HST) observations. In our HST-Cosmic Origins Spectrograph (HST-COS) and -Space Telescope Imaging Spectrograph (HST-STIS) spectra, we find many emission lines, as well as substantial far-ultraviolet (FUV) continuum excess emission, which can be ascribed to active accretion. The total luminosity of the C iv 1549 Å doublet is 4.1 . Using scalings between accretion luminosity, , and C iv luminosity from the literature, we derive 2, which is more than an order of magnitude higher than the upper limit estimated from the X-Shooter observations. We discuss possible reasons for the X-Shooter-HST discrepancy, the most plausible being that the low contrast between the continuum excess emission and the photosphericchromospheric emission at optical wavelengths in MY Lup hampered detection of excess emission. The luminosity of the FUV continuum and C iv lines, strong H2 fluorescence, and a ”1600 A Bump” place MY Lup in the class of accreting objects with gas-rich discs. So far, MY Lup is the only peculiar case in which a significant difference between the HST and X-Shooter estimates exists that is not ascribable to variability. The mass accretion rate inferred from the revisited estimate is 1() yr-1. This value is consistent with the typical value derived for accreting YSOs of similar mass in Lupus and points to less clearing of the inner disc than indicated by near- and mid-infrared observations. This is confirmed by Atacama Large Millimeter Array (ALMA) data, which show that the gaps and rings seen in the sub-millimetre are relatively shallow.
Key Words.:
Stars: pre-main sequence, low-mass – Accretion, accretion disks – protoplanetary disks - single objects: MY Lup1 Introduction
A key issue in the study of planet formation is to explain how optically thick accretion discs surrounding the youngest low-mass (2.0) stars evolve into optically thin debris discs. The mass accretion rate onto a young star, , is a crucial parameter for the study of the evolution of accretion discs around young low-mass stellar and substellar objects (YSOs), because it sets important constraints for disc-evolution models (Hartmann et al. 1998; Hartmann, Herczeg & Calvet 2016) and disc-clearing mechanisms (Alexander et al. 2014; Ercolano & Pascucci 2017, and references therein), and is a key quantity for the studies of pre-main sequence (PMS) stellar evolution and planet formation (Morbidelli & Raymond 2016).
Transition discs (TDs) are protoplanetary discs that show evidence of inner holes and gaps, as observed in millimetre interferometric observations (e.g. Andrews et al. 2011; van der Marel et al. 2018; Andrews et al. 2018) and in the dip of the mid-infrared spectral energy distribution (MIR; SED) (e.g. Merín et al. 2008). Low-mass PMS stars with transitional discs accreting at very low rates are likely in the final stages of inner disc evolution, and have probably already formed proto-planets (Owen & Clarke 2012). Therefore, identifying and investigating such slow accretors may help us to understand planet formation. However, measurements of low are challenging. In practice, can be derived from the energy released in the accretion shock (accretion luminosity , see Gullbring et al. 1998; Hartmann 1998) given the stellar properties. Observationally, this requires measurements of excess flux in continuum and lines with respect to similar non-accreting stars. Such measurements are best performed at UV wavelengths ( 4000 Å), with the Balmer continuum excess emission and the Balmer jump being more easily seen in the spectra of late-type ( K5) YSOs than in the early types due to the higher contrast between photospheric emission and continuum emission (Herczeg & Hillenbrand 2008). Weak accretion, in general, is not easily detectable in the region of the Balmer jump. Some previous studies attempted measurements in TDs using other tracers. In the case of CVSO 224, a 10 Myr old PMS star with a TD, Espaillat et al. (2008) derived 7 yr-1 based on modelling of the H emission line observed at high spectral resolution. Other estimates of in samples of YSOs with TDs have been provided using the width, WH(10%), of the H line measured at the 10% of the line peak in intermediate-resolution spectra (Merín et al. 2010; Cieza et al. 2010). However, such estimates heavily depend on rather uncertain scaling relations between the line width and (see discussion in Alcalá et al. 2014).
We measured the UV excess continuum emission for a 90% complete sample of YSOs in the Lupus star-forming region (Alcalá et al. 2014, 2017) using the VLT/X-Shooter spectrograph (Vernet et al. 2011). This dataset allowed us to derive the stellar and accretion parameters in a self-consistent and homogeneous way (see also Manara et al. 2013, for the methods). In the sample of 81 systems, 12 are YSOs with TDs based on the dip of their MIR SEDs (Merín et al. 2008; Romero et al. 2012; Bustamante et al. 2015). Among these, we identified 5 objects (Lup 607, MY Lup, Sz65, Sz68, and SST c2dJ160830.7-382827) in which the UVB excess emission, ascribable to accretion, is barely evident. The analysis of the emission lines in the X-Shooter spectra of these objects showed that their excess emission is close to the chromospheric noise level as defined by Manara et al. (2013a, 2017, see also Ingleby et al. 2011). We therefore classified them as weak or non-accretors. Two of these (MY Lup and SST c2dJ160830.7-382827) were previously classified as transitional discs and their spectral type is earlier than K5. It was thus unclear whether the apparent low level of accretion in these objects is real or due to a very low contrast between the continuum excess emission and the photosphericchromospheric emission, which prevented a reliable assessment of accretion.
Observations in the far-ultraviolet (FUV) are particularly well suited for studies of accretion. Previous observations in the FUV have shown strong accretion-related emission features. For instance, strong emission of CO (e.g. France et al. 2011; Schindhelm et al. 2012) and H2 ascribed to gas in the inner regions (10 AU) of the disc of accreting YSOs (Johns-Krull et al. 2000; Herczeg et al. 2002; Calvet et al. 2004; France et al. 2011; Ingleby et al 2011; Yang et al. 2012; France et al. 2012; Hoadley et al. 2015; France et al. 2017; Arulanantham et al. 2018, and references therein). This is of particular importance for the studies of accretion in YSOs because these molecules trace the gas in the inner disc regions, indicating that molecular material persists within a few astronomical units of the star. In this work, we use UV-Hubble Space Telescope (HST) spectra to unambiguously confirm and investigate the accretion properties of MY Lup. In a forthcoming paper (Arulanantham et al. in prep.), an extended set of the same data is used to study the structure and distribution of the gas in the inner disc regions. In Section 2 we present an overview of MY Lup and previous spectroscopic observations used to provide intial estimates of mass accretion rate, . In Section 3 we report the HST observational data, their processing, and the main spectroscopic features in the near-ultraviolet (NUV) and FUV. In Section 4 we describe the analysis of the HST spectra and report the results on the accretion properties of MY Lup. In Section 5 we discuss the implications of the assessment of accretion in MY Lup and its disc. Finally, we present our conclusions in Section 6.
2 The target
MY Lup was first classified as a T Tauri star by Gregorio-Hetem et al. (1992) based on the presence of the H emission line and the Li i6708Å absorption line in an intermediate- resolution spectrum. It is a K0-type star with a mass of 1.1 (Alcalá et al. 2017; Frasca et al. 2017) in the Lupus IV cloud (Comerón 2008), surrounded by a highly inclined (73∘) disc (Ansdell et al. 2016; van der Marel et al. 2018; Andrews et al. 2018; Huang et al. 2018). Romero et al. (2012) classified MY Lup as a planet-forming TD disc candidate, claiming that its SED could be explained by a discontinuity in the grain size distribution rather than an inner opacity hole. Recent high-contrast high-resolution imaging in the near-infrared (NIR) with the Spectro-Polarimetric High-contrast Exoplanet REsearch (SPHERE) instrument by Avenhaus et al. (2018) confirmed a high inclination of 77∘ of the dusty disc. The SPHERE observation also revealed a flared-truncated disc structure with multiple rings on the surface, and the Disk Substructures at High Angular Resolution Project (DSHARP Andrews et al. 2018) also detected several annular substructures at 8, 20, 30, and 40 au from the central star (Huang et al. 2018), with no evidence of a large inner cavity.
The age of the relatively extincted (AV=1.3 mag, Alcalá et al. 2017) star has been estimated at about 17 Myr (c.f. Alcalá et al. 2017; Frasca et al. 2017), that is, a factor of six older than typical YSOs in Lupus, suggesting that the object may be more evolved than other Lupus YSOs or that the highly inclined disc occults part of the stellar light, making the object sub-luminous on the HR diagram. A tentative stellar rotational period of 2.5 days has been reported in Batalha et al. (1998).
2.1 Previous spectroscopy and estimates
Previous VLT spectroscopy of MY Lup includes two X-Shooter spectra, one by us (reported in Alcalá et al. 2017) and the other one obtained within ESO programme 095.C-0134 (PI. Caceres). In addition, a UVES spectrum was acquired within ESO programme 093.C-0476 (PI. Canovas). The latter was performed 6 days after the Caceres X-Shooter observation, while our X-Shooter spectrum was acquired about 1 year later. The ESO Phase-3 reduced data of both the Caceres X-Shooter and Canovas-UVES spectra are used here for comparison purposes.
Except for H and the Ca ii H & K and IRT emission lines, which appear superimposed on the corresponding photospheric absorption, no other emission lines are clearly seen in the VLT spectra of MY Lup. In both the X-Shooter spectra the He i 1082.9 nm appears as a very strong absorption with a possible but barely detectable emission, resembling a P-Cyg profile. When subtracting a photospheric template, still no other emission lines are evident; only the Pa, Pa, and Br lines are barely seen, but detected (the fluxes are given in Frasca et al. 2017). A possible explanation for why we see the lines in the red but no other lines in the blue may be that the highly inclined disc occults some of the emitting inner regions, with the lines bluer than H being more extincted and therefore remaining undetected.
We highlight the fact that the H line shows a complex profile, several hundred km s-1 wide (c.f. Figure 1). The width at 10% of the line peak measured in the UVES spectrum is 500 km s-1. This value is consistent with the one estimated by Romero et al. (2012) using other spectra. We also note that the X-Shooter spectrum we used in Alcalá et al. (2017) has the weakest H emission.
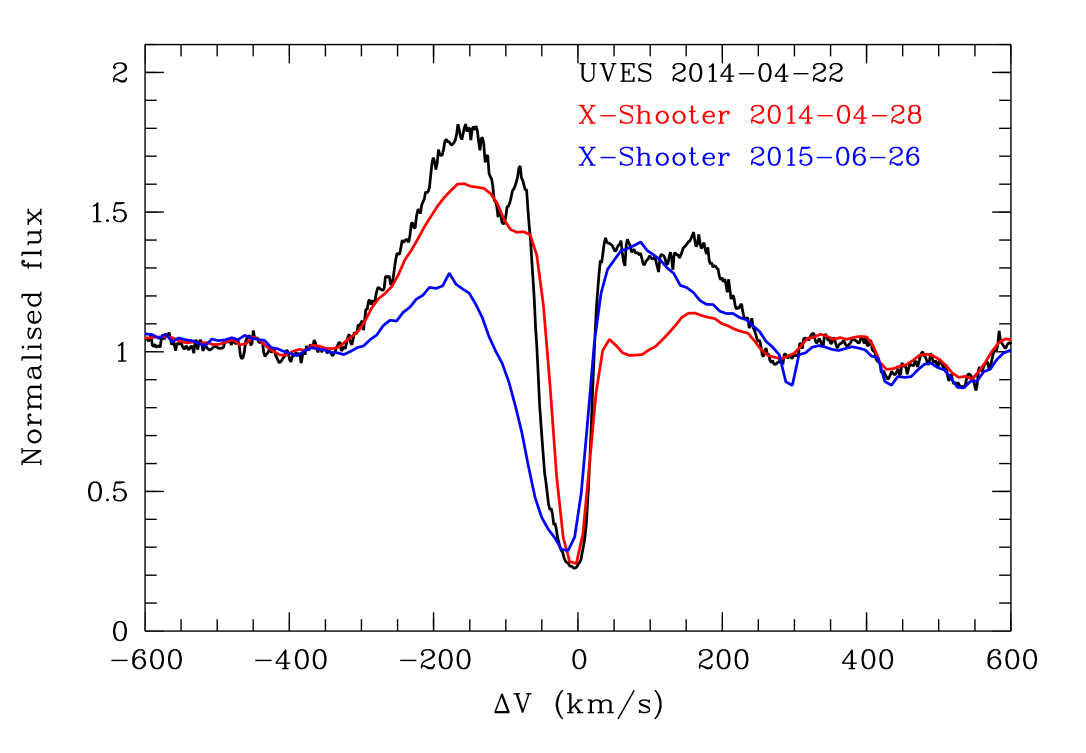
Variability of the H line profile is observed on a timescale of 1 year, but some variations are detected within a few days (see Figure 1). The type of profile is consistent with the model predictions by Kurosawa et al. (2006, see their Figure 13) for a high-inclination angle of accreting sources. In those models, the absorption feature becomes stronger as the inclination increases, mainly because of the geometrical configuration. A high inclination is in agreement with the disc inclination estimated from the Atacama Millimeter Array (ALMA) millimetre (Ansdell et al. 2016; van der Marel et al. 2018) and SPHERE NIR images (Avenhaus et al. 2018), and is consistent with the relatively high stellar rotation rate of 29 km s-1 (c.f. Frasca et al. 2017).
The U-excess continuum emission in MY Lup is not evident (see Figure E.8 in Alcalá et al. 2017) when using our methods (see Manara et al. 2013; Alcalá et al. 2014, 2017) to derive the accretion luminosity, . Based on that analysis, which basically measures the Balmer continuum excess emission with respect to the photospheric one, including also the chromospheric level from a non-accreting template, we estimated an upper limit on of 0.005 , which means an upper limit on yr-1, placing MY Lup very close to the chromospheric noise level, and more than an order of magnitude below the typical value for YSOs of similar mass in the Lupus star forming region. We have also verified that the estimates of the limit on derived from the Balmer continuum and the few emission lines detected are consistent (see Alcalá et al. 2017). According to the –WH(10%) scatter plot for the Lupus sample shown in Figure 9 of Alcalá et al. (2014), a WH(10%)500 km s-1 measured in the UVES spectrum would suggest for MY Lup, but the spread of versus WH(10%) is very large. Moreover, in the X-Shooter spectrum used in Alcalá et al. (2017), the H line was not in emission as much as in the UVES and the other X-Shooter spectrum (see Figure 1). All this may lead to the conclusion that MY Lup is not accreting. This has been claimed to be the case for several transition discs, and in principle would be in line with the expectation from photoevaporation models (Ercolano et al. 2017; Ercolano & Pascucci 2017, and references therein). However, it may be at odds with the detection of significant excess emission in the MIR and ALMA millimetre bands (see SED in Figure 2 of van der Marel et al. 2018, and in Figure 1 of Andrews et al. 2018). From radiative transfer modelling, which accounts for optical depth and disc inclination, Miotello et al. (2017) find a total dust mass of 173 MEarth.
3 HST data
3.1 Observations and data processing
The HST data used in this paper were acquired with the Cosmic Origins Spectrograph (COS) and the Space Telescope Imaging Spectrograph (STIS) onboard the HST as part of Cycle 24 General Observer program (PID 14604; PI: C.F. Manara). The data were acquired in September 8, 2017 (UT start 01:35:54; UT end 10:07:17), which is more than two years after our X-Shooter observation of June 26, 2015.
The data were collected in three different observing modes of HST-COS with the gratings G140L, G130M, and G160M, centred at 1280, 1291, and 1577, providing a resolving power 1500, 16000 and 16000, respectively (see Green et al. 2012), as well as in two observing modes of HST-STIS using gratings G430L and G230L, centred at 4300 and 2375, respectively, both with a resolving power of 1000 (see Woodgate et al. 1998, and references therein).
The G160M exposure time was 2592 sec through the primary science aperture, with observations split between the 1577 and 1611 cenwave settings to mitigate fixed pattern noise and provide continuous spectral coverage over the C iv, H2, and FUV continuum emitting wavelength regions. The velocity and flux calibration of the G160M spectra are 15 km s-1 and 5% absolute, respectively. The G130M and G140L spectra will be presented in a future work (Arulanantham et al. in prep).
The data processing has been done in the same way as described in Arulanantham et al. (2018). Briefly, individual flux-calibrated spectra generated by the COS pipeline are coadded using a cross-correlation algorithm (Danforth et al. 2010) that has been optimised for emission line sources (e.g. France et al. 2012). The data from different grating settings are then joined at the spectral overlap regions, with interpolated fluxes used to connect the observations from different gratings.
3.2 Ultraviolet HST spectra
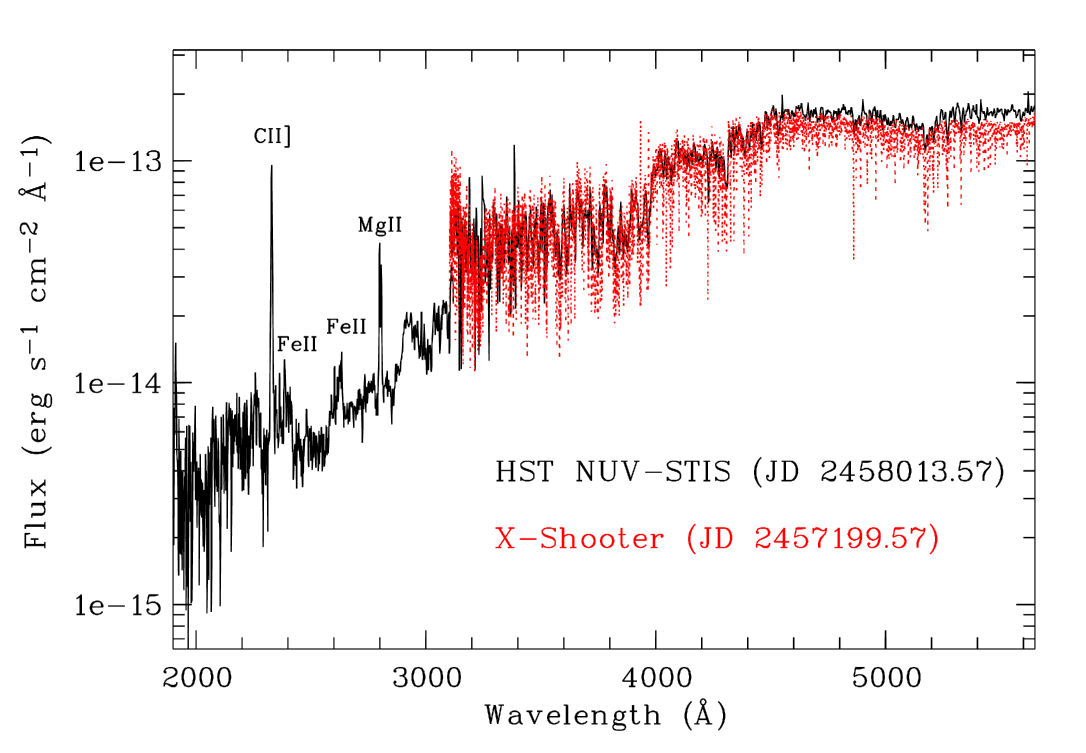
Figure 2 shows the HST STIS spectra. Our X-Shooter spectrum is overplotted as the red dotted line for comparison purposes. The spectra are corrected for reddening using A1.3 mag and adopting the extinction law by Cardelli et al. (1989) with R3.1 (however, see discussion on reddening in Calvet et al. 2004). We note that the fluxes of the HST-optical and X-Shooter spectra are very consistent, despite being acquired more than 2 years apart. The very small slope decrease in the reddest spectral range can be explained by an extinction change AV 0.2 mag. However, this is within the uncertainties of the X-shooter analysis. The other X-Shooter spectrum is also consistent with the HST data. Strong emission in the C ii] 2325 and Mg ii 2800 lines is also detected in the NUV spectrum. The latter line is related to accretion, but has also been observed in non-accreting stars, while the former is much stronger in accretors than in non-accretors (Ingleby et al 2011) and has been observed in other actively accreting sources (Calvet et al. 2004; Gómez de Castro & Ferro-Fontán 2005; Ingleby et al 2011). The tentative presence of the [O i] 6300 forbidden line may in principle lead to the idea that the semi-forbidden C ii] 2325 line in MY Lup might form in a less dense environment than in the accretion flows, possibly in an outflow. However, only an upper limit for the flux of the [O i] line could be derived in Nisini et al. (2018). Moreover, the outflow interpretation for the C ii] 2325 line is for stars that have strong outflows (Gómez de Castro & Ferro-Fontán 2005). Therefore, the C ii] 2325 emission line in MY Lup is mostly formed in the accretion flows.
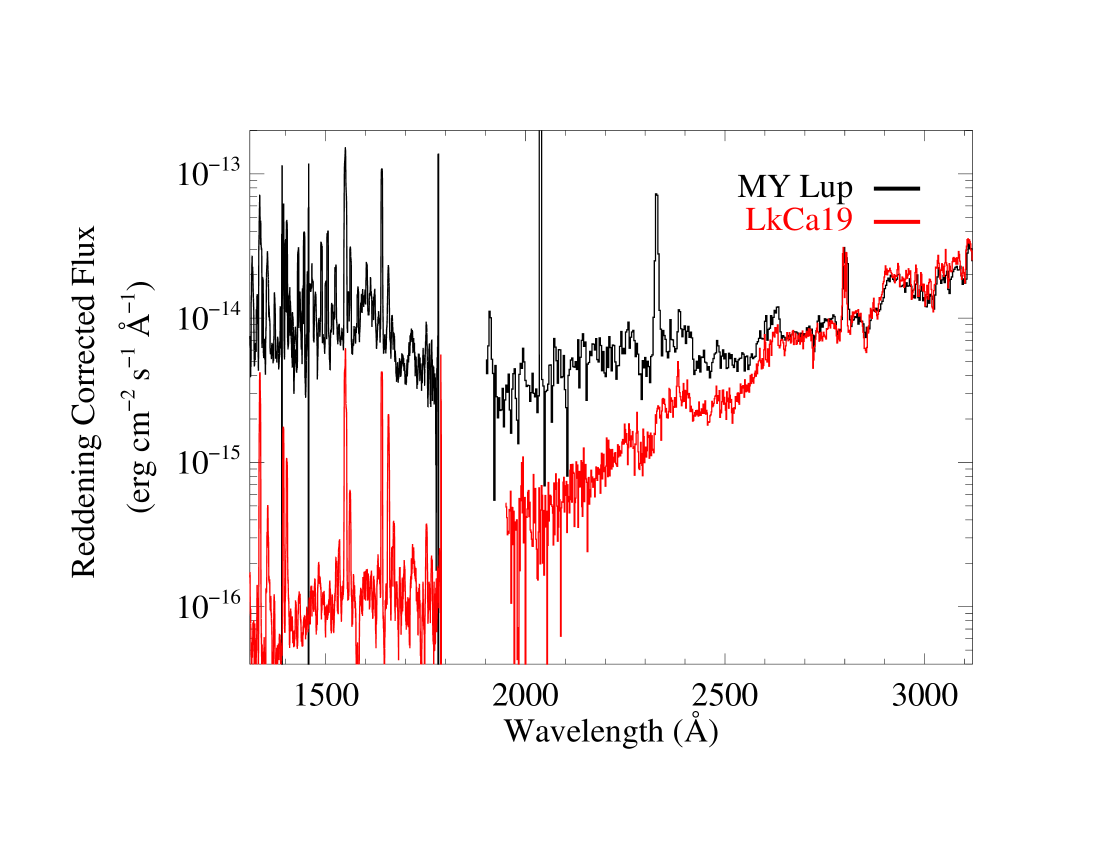
In Figure 3 the reddening corrected FUV spectrum, and part of the NUV spectrum, of MY Lup are shown. The spectra of the non-accreting YSO LkCa 19 are also overplotted as a red line for comparison. This star is also of K0-type, has a mass of 1.36 , similar within errors to MY Lup, and extinction A mag (see Kenyon & Hartmann 1995; Kraus & Hillenbrand 2009) 111We note that Herczeg & Hillenbrand (2014) adopt also a low value of A mag.. Its projected rotational velocity was measured at 18.6 km s-1 (Hartmann et al. 1987) and a rotational period of 2.2 days has been reported in Clarke & Bouvier (2000). It is confirmed that there are no signs of accretion in this star and therefore it can be used as a good comparison template to asses the accretion activity in MY Lup. The spectra of LkCa 19 (Ardila et al. 2013) were smoothed to 3Å spectral resolution to be comparable to the MY Lup spectrum.
A significant UV continuum excess emission and many emission lines tracing the inner disc (H2 and CO) and star–disc interaction region (N v, C iv, etc) are detected in MY Lup. In this work, we focus on a few lines that allow us to investigate the accretion properties, in particular, the C iv 1549 doublet, and the H2 1547 and C ii] 2325 lines. In a forthcoming paper (Arulanantham et al. in prep.), a more detailed analysis of the complete set of detected lines will be presented.
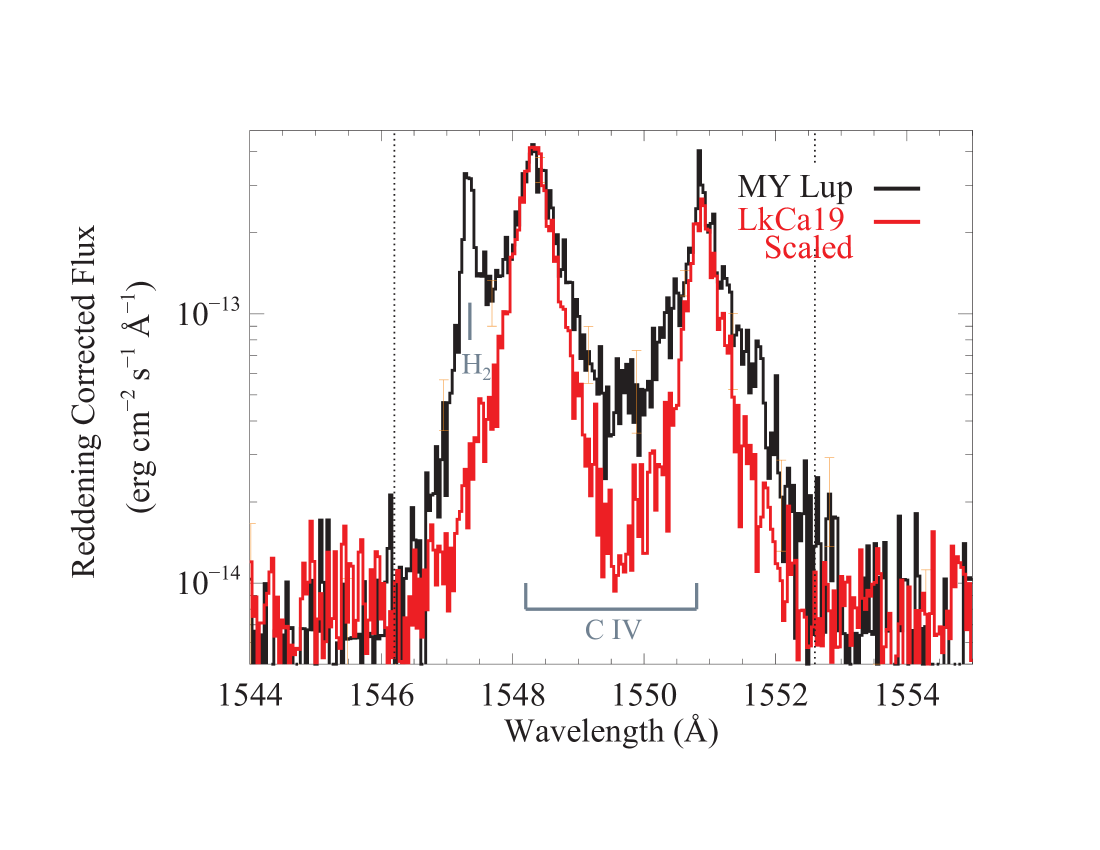
The FUV spectrum of MY Lup shows both the C iv 1549 doublet and dozens of H2 lines including the H2 1547 molecular emission (see Figure 4). The H2 lines are normally ascribed to gas-rich inner discs around accreting YSOs (see France et al. 2012; Ingleby et al 2011; Ardila et al. 2013; Hoadley et al. 2015, and references therein). H2 fluorescence is observed in all accreting protostars observed with HST to date, while no stars without dust discs displaying H2 emission have been discovered (France et al. 2012).
The spectrum of the non-accreting YSO LkCa 19 is also overplotted in Figure 4 as a red line for comparison. This comparison shows that the profiles of the C iv (1548.2, 1550.8) lines in MY Lup are broader than those of the non-accreting star, leading to the conclusion that MY Lup is accreting.
In summary, the presence of H2 lines, the higher level of FUV continuum flux with respect to that of the non-accreting star, and the presence of the strong C ii] 2325 line, as well as the H profile and its variability, all strongly suggest that MY Lup is an actively accreting object.
4 Analysis of HST-UV spectra
4.1 Ultraviolet continuum emission
We can use the slab model derived for MY Lup in Alcalá et al. (2017) and the spectrum of the non-accreting star to investigate by how much the UV excess emission is eventually underestimated.
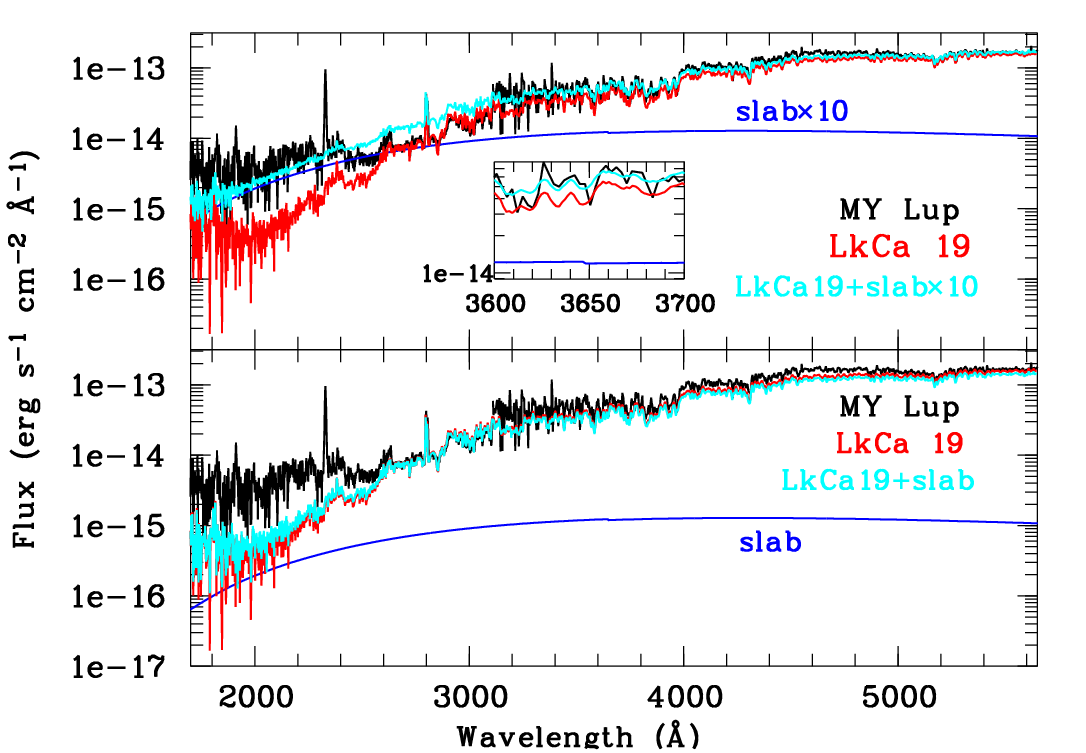
The lower panel of Figure 5 shows how the slab model derived from the X-Shooter data in our previous analysis, plus the spectrum of the non-accreting star, fail to match the level of NUV continuum flux from MY Lup, albeit still with a relative good match in optical bands. At about 2000Å this model yields at least a factor seven less flux than observed, and as shown in the upper panel of the same figure, a slab at least a factor ten brighter would be required to achieve the continuum flux in the NUV. This would imply an accretion luminosity of more than an order of magnitude higher than our estimates based on X-Shooter and is consistent with the results of the analysis of the C iv emission lines, as is described in the following sections. While in our previous analysis we used HBC 407 as a non-accreting template, also a K0-type star (Herczeg & Hillenbrand 2014), the optical spectrum is also well fitted when using LkCa 19 as a template.
As can be seen from the inset in Figure 5, the X-Shooter spectrum shows no significant Balmer jump, which may be reconciled by fitting the spectrum with an almost optically thick slab. However, the fit deviates from the photospheric features at short wavelengths, that is, the observed NUV spectrum is fainter than the slab fit over some wavelengths (2400 Å3000 Å). This may be because the fit is very sensitive to the depth of photospheric features and therefore to any mismatch between the spectral features of MY Lup and those of the templates.
4.2 The C iv 1549 doublet
The C iv 1549 line emission in YSOs has been shown to correlate with the accretion luminosity, and therefore with the mass accretion rate, indicating that it is most likely originated in the accretion shock and flows (Johns-Krull et al. 2000; Ingleby et al 2011; Ardila et al. 2013; France et al. 2014). To quantify how much of the C iv 1549 flux in MY Lup can be attributed to excess accretion emission, one should compare the fluxes to those of the non-accreting star, scaled to match the peak fluxes of the narrow components, because these are likely dominated by the magnetic activity in the transition region of the protostellar atmosphere.
| Line | Vcen (err) | Flux (err) | FWHM (err) |
|---|---|---|---|
| (km s-1) | ( erg s-1 cm-2) | (km s-1) | |
| H2 | 168.9 (0.7) | 5.5 (0.6) | 24.9 (2.1) |
| C iv(1548)-N | 29.7 (1.7) | 10.1 (0.9) | 75.8 (5.1) |
| C iv(1548)-B | 3.7 (4.1) | 27.2 (1.8) | 309.6 (16.5) |
| C iv(1550)-N | 517.9 (1.4) | 5.0 (0.6) | 41.1 (4.0) |
| C iv(1550)-B | 525.7 (2.6) | 17.5 (1.0) | 262.2 (9.7) |
: ”N” and ”B” stand for narrow and broad component, respectively
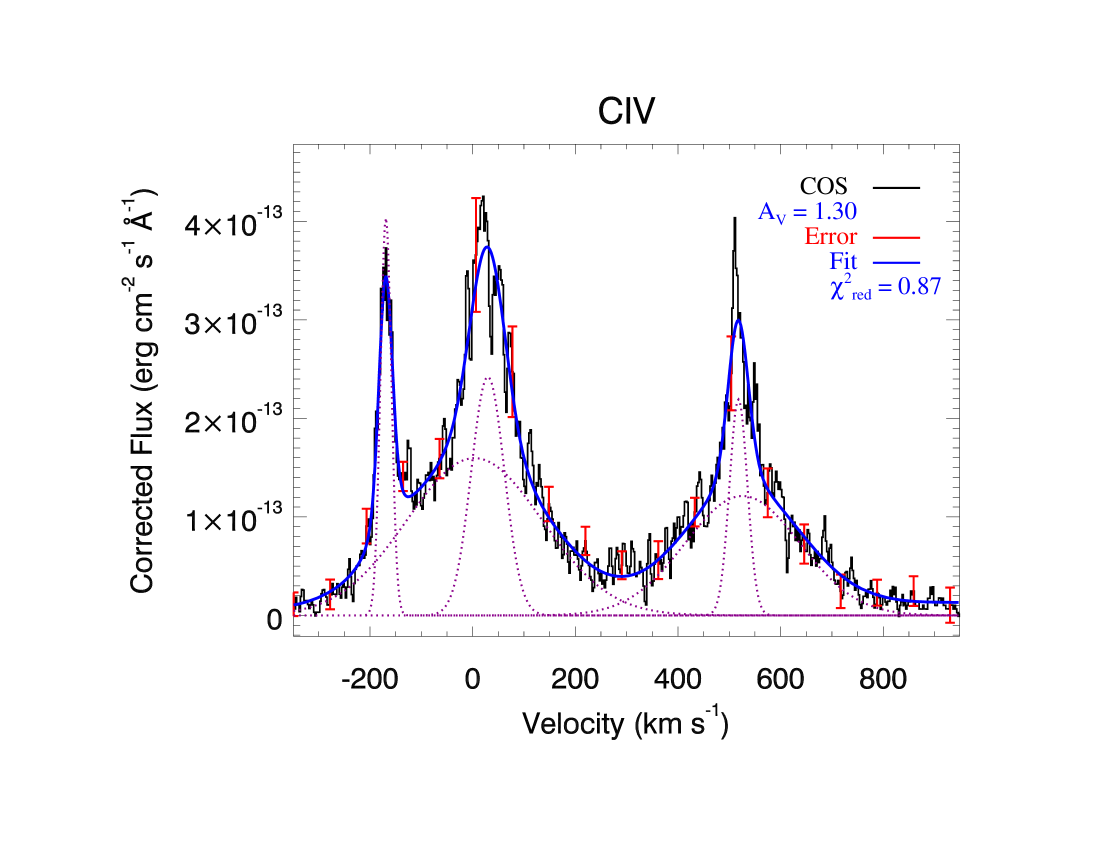
A line decomposition procedure, fitting the broad and narrow components of the C iv 1549 doublet (see Figure 6 and Table 1), yields a total extinction-corrected (A1.3 mag, Alcalá et al. 2017) flux of 6.0(0.3) erg s-1 cm-2. Subtracting the scaled C iv flux ( 4.6 erg s-1 cm-2) from the non-accreting young star LkCa 19 from the total flux in MY Lup we end up with an excess C iv flux of 1.4(0.3) erg s-1 cm-2. The extinction corrected flux of the H2 line is estimated at 5.5(0.6) erg s-1 cm-2. Likewise, the flux of the C ii] 2325, measured from the extinction corrected HST NUV spectrum is 6.0(0.5) erg s-1 cm-2.
The luminosity of the lines can be computed as , where pc is the Gaia DR2 distance (Gaia Collaboration 2018) and is the extinction-corrected flux. The total luminosity of the C iv lines is 4.1(0.2) , while the excess luminosity of the line, EC iv, with respect to the non-accreting star is 9.5(0.2) . The luminosity of the H2 line alone is 3.8(0.4) , and that of the C ii] 2325 line is 4.1(0.4) .
Ardila et al. (2013) demonstrated that the C iv line shape parameters (the velocity of the peak of the lines and width) do not correlate with accretion rate, but also that all accreting stars should show a broad component. The analysis of these latter authors also suggests that the accretion process first generates the broad component, with the narrow component becoming increasingly important at larger accretion rates. For low accretion rates (4 yr-1), the average narrow-component contribution to the luminosity is about 20%, while for high accretion rates it is about 40% on average. The decomposition procedure of the C iv lines in MY Lup provides velocities and FWHM for the components (Table 1) that are more consistent with those of accreting objects than with those of non-accreting stars. Also, the scale factor from the 1550 Å to the 1548 Å C iv line of MY Lup is 1.45, as in many accreting objects. The contribution of the narrow components in MY Lup to the total luminosity is 25%, that is, just above the limit for low accretors and is consistent with the narrow component contribution in other accreting objects with similar accretion rates to those of AA Tau and IP Tau (see Figure 8 in Ardila et al. 2013). This suggests that the C iv doublet in MY Lup is produced by accretion.
4.3 Accretion properties
According to the versus relationships by Ingleby et al (2011, their Figure 10) and Yang et al. (2012) the C iv luminosity of 4.1 in MY Lup would imply an accretion luminosity of 2, that is, more than an order of magnitude higher than the upper limit derived from the optical data. We note that the (C ii]) versus relationship derived by Ingleby et al. (2013, their Eq. 15) and the C ii] 2325 luminosity estimated in the previous section yield =1. Such values would be consistent with those of accreting YSOs in Lupus and yield a mass accretion rate (0.5–1) yr-1. The latter calculated as
| (1) |
assuming , where and are the YSO radius and inner-disc radius, respectively (see Gullbring et al. 1998; Hartmann 1998), and using the stellar parameters reported in Alcalá et al. (2017). A similar value of 8 yr-1 is derived when using the relationship between C iv luminosity and mass accretion rate provided by Ardila et al. (2013), that is, 0.8 .
It is important to stress that the relationships between C iv-luminosity and accretion properties show a significant scatter, mainly because of a combination of non-simultaneity and extinction errors. Considering the total C iv luminosity, and taking into account the scatter in the Ingleby et al (2011) and Yang et al. (2012) relationships, we estimate the accretion luminosity to be in the range (0.9-4.0) , which gives an accretion rate in the range (0.4–1.8) yr-1, implying a range of about 0.65 dex in . Similarly, when using the Ardila et al. (2013) relationship and taking into account uncertainties in the component subtraction procedure and extinction, we estimate the accretion rate to be in the range (0.5–2.5) yr-1, meaning a range of about 0.7 dex in . Although Ardila et al. (2013) find no significant difference when using all their data or only simultaneous data to derive their - relationship, they conclude that the exact relationship remains uncertain.
Using Eq. 2 by Johns-Krull et al. (2000), which considers correction for the presence of emission from the transition region, and the excess luminosity EC iv calculated in the previous section, we estimate a mass accretion rate of 2.4 yr-1, that is, a value in the high end of the ranges quoted above. Considering errors and the scatter of the relationships, the values are in fair agreement. The derived for MY Lup covers a range of values accounting for the spread in possible contribution of the transition region.
Another important source of error is represented by the uncertainty in extinction, which in the FUV is a factor of about 2.6 higher than in the optical. We estimated an uncertainty in AV of about 0.4–0.5 mag (Alcalá et al. 2014, 2017), which translates to a 0.4 dex error in . According to the versus relationships used above, this implies in the range (0.7–4.0) . Thus, the range of due to the effect of the uncertainty in AV is estimated to be (0.3–1.8) yr-1.
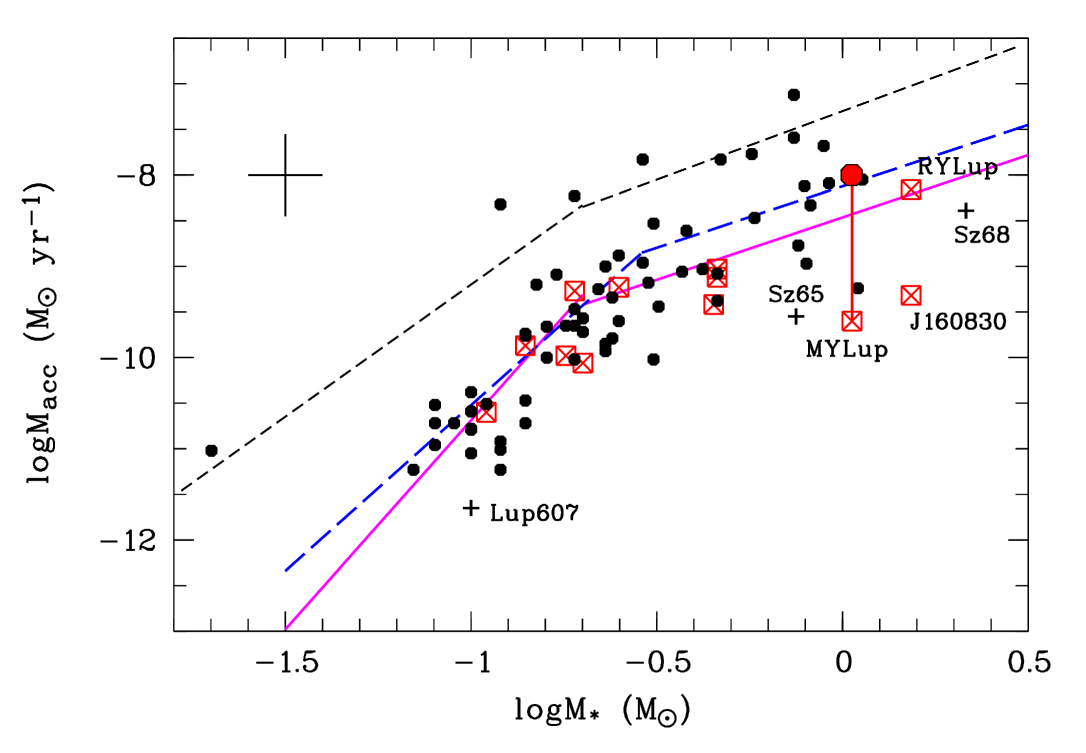
We conclude that a reasonable mass accretion rate for MY Lup is 1() yr-1. Beyond the relatively large uncertainty in , the luminosity of the C iv lines suggests similar values as those of bona fide accreting YSOs with comparable mass. This can be seen in Figure 8 in Appendix A, where the stellar mass and accretion rates of the Lupus sample are revisited using the distances drawn from Gaia DR2. It is worth noting that the updated value for the mass accretion rate is also consistent with the more luminous slab model described in Section 4.1.
5 Discussion
5.1 The X-Shooter–COS-STIS discrepancy on
Among the several objects where HST and X-Shooter data exist, MY Lup is the only star fo which a discrepancy has been observed so far. In fact, the several HST-based values found by Ingleby et al. (2013) and those found by Manara et al. (2014) are in good agreement. Also, an additional data set of the same observing program from which the MY Lup HST data are taken show good agreement between the HST and X-Shooter values for several stars (Arulanantham et al. in prep.). Therefore, MY Lup seems to be the only real outlier so far. The emission lines, and substantial FUV excess emission detected in the HST spectra of MY Lup strongly suggest that the star is an actively accreting object, whereas the X-Shooter data show weak or no accretion. MY Lup is peculiar in several respects. Besides being one of the most massive T Tauri stars in Lupus, it is an almost edge-on disc. Hence, both the effects of low contrast in photospheric versus continuum excess emission and the occultation of some accretion diagnostics may play different roles in the X-Shooter accretion diagnostics and in those of HST. In principle, the accretion flows might be obscured by the highly inclined disc hampering the detection of excess emission in the X-Shooter wavelength range, but such an effect would be much stronger for the C iv lines. We note however that Ardila et al. (2013) find no correlation between inclination and the C iv luminosity of accretion rate, hence conclude that there is no evidence that the disc or the accretion flow are obscuring the accretion diagnostics. In their interpretation, the C iv UV lines are not emitted from a particular place, but cover the whole star. On one hand, very weak or no accretion would imply very little gas content in the disc, consistent with the finding of a rather low gas-to-dust mass ratio from faint CO isotopologue ALMA observations by Miotello et al. (2017). Nonetheless, we highlight the fact that these authors also discuss the possibility of a normal gas-to-dust ratio but a disc highly depleted in CO, yielding artificially low gas mass estimates. On the other hand, the HST-UV tracers seem to point toward accretion more typical of Class II discs and of some transitional discs in Lupus and Chamaeleon I (Alcalá et al. 2017; Manara et al. 2017).
As in previous studies (c.f. Calvet et al. 2004; Ingleby et al 2011; Manara et al. 2014), this further confirms that FUV measurements represent a reliable way to establish the presence of accretion in low-accreting, early-type, intermediate-mass T Tauri stars. It is also worth stressing that the width of the H line in this type of object may already suggest active accretion (Romero et al. 2012 and see also the case of SR 21 in Manara et al. 2014). The complex H profile, which is consistent with the model prediction by Kurosawa et al. (2006, see their Figure 13) of a high-inclination angle, also supports the conclusion of significant UV excess emission due to accretion, and of a complex geometry of the infalling streams.
5.1.1 Possible stellar flare ?
One question that may arise is whether some of the emission lines observed in the COS data, in particular the H2 lines, could be produced by a strong flare and not by accretion. As discussed in Hoadley et al. (2015) and Arulanantham et al. (2018, and references therein), the H2 lines are formed by fluorescence of Ly- photons. In low-mass stars, just the chromospheric Ly- emission alone can generate detectable H2 fluorescence from the stellar atmosphere (Kruczek et al. 2017). However, a much more intense Ly- pumping would be needed to explain the bright H2 emission that we see at the distance of 156 pc of MY Lup. In the Sun and cool dwarfs, the H2 lines are produced by narrow Ly-alpha, while accretors have broad Ly- lines.
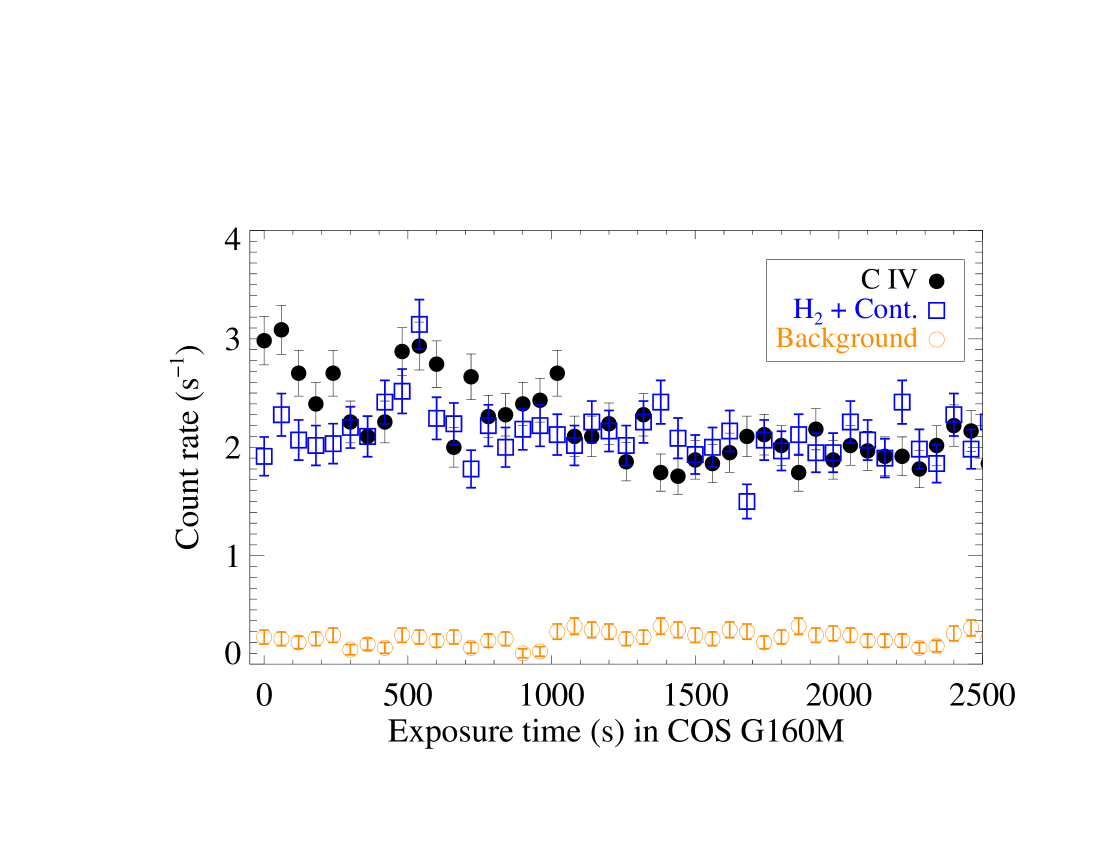
One argument against the flare scenario is that the COS G130M and G160M data were not acquired simultaneously; both show the same level of H2 emission, as do the G140L data. Furthermore, COS data is acquired in time-tag mode and light curves can be created as a function of wavelength. Figure 7 shows light curves for the H2 and C iv lines. The light curves of the G160M data did not show any signs of significant temporal variability. Therefore, we conclude that the emission lines observed in the COS data are not related to flare events, but that active accretion is the explanation of the UV emission.
5.1.2 Variability
MY Lup is a variable star by definition. Time series photometry gathered from the AAVSOnet Epoch Photometry Database333https://www.aavso.org/aavsonet-epoch-photometry-database shows that the maximum amplitude of variations in the -band is on the order of 0.6 mag, with the tendency for the source to become redder when fainter. The latter is consistent with a variable circumstellar extinction due to the edge-on geometry. We note however that the long-term light curves from the Digital Access to a Sky Century @ Harvard (DASCH)444http://dasch.rc.fas.harvard.edu/lightcurve.php suggest that events of up to 1.5 mag in extinction may occur in MY Lup. In any case, the comparison in Figure 2 shows that the flux of the X-Shooter spectrum and the STIS spectrum are not significantly different, despite being acquired more than 2 years apart. The very small slope difference in the reddest spectral range can indeed be explained by an extinction change A0.2 mag observed in the AAVSOnet data. Such variability would not explain an order of magnitude difference in the estimates.
The comparison in Figure 2 does not exclude, however, that larger variations in the UV, mostly unnoticed in the optical and due to variable accretion, may occur in other epochs. MY Lup was detected by GALEX in the NUV only, with an AB magnitude of 17.49 mag. A standard IDL software that converts spectra directly into a GALEX AB magnitude applied to our STIS spectrum of MY Lup yields an AB magnitude of 19.40 mag., suggesting a factor of 5–6 variability in the NUV flux, presumably related to accretion luminosity variability and/or inner disc occultation. Variability by factors of approximately five in FUV flux from accreting YSOs have previously been detected with HST, and these tend to be sources with variable disc attenuation like AA Tau, RW Aur, and T Cha (see for instance Schneider et al. 2015, for AA Tau). High variability has also been observed in multi-epoch UV HST observations of accreting low-mass stars (Robinson & Espaillat 2019). Thus, the comparison with GALEX shows that variations in the UV in MY Lup are in line with those observed in other accreting low-mass stars. Objects like FUOrs and EXOrs may exhibit much higher levels of variability, but most of these objects are more embedded and younger than T Tauri stars, and in the above-mentioned photometric data of MY Lup there is no evidence for a FUOri/EXLup type behaviour. We also stress that, except for the changes seen in the H profile (see Figure 1), no significant variability is observed among the two X-Shooter spectra available so far, either in flux or slope of the spectra.
5.1.3 Anomalous extinction
Other relevant effects that may have an important impact on the flux measurements of the continuum and lines at different wavelengths are represented by a possible deviation from a normal extinction law. Regarding anomalous extinction, and especially for high-inclination objects, if one exchanged part of the absorbing material that has R3.1 with material that has for example R4.0, this could lead to an underestimation of the C iv fluxes because the FUV reddening correction is smaller for higher RV. However, this change might go unnoticed in the optical when only part of the absorber is effected. Recent SPHERE observations in scattered light provide evidence of spatial segregation of dust grains and different (small/large) grain population and distributions in SST c2dJ160830.7-382827 (Villenave et al. 2019). This object is the other transitional disc found to show weak or no accretion based on the X-Shooter data (see Section 1) and is very similar in many respects to MY Lup. However, even assuming R5.5 would reduce the value of the extinction-corrected flux of the C iv lines by a factor of about four, but the resulting would still be higher than the X-Shooter estimate by about 0.8 dex in .
5.1.4 Other effects
The effects of scattering in the FUV may also be important. For instance, repeated observations of the T Tauri star AA Tau have shown that the C iv fluxes did not decrease as much as expected during the dim state (see details in Schneider et al. 2015).
5.1.5 Excess emission in the FUV
Previous works (Calvet et al. 2004; Ingleby et al 2011; Manara et al. 2014) have pointed out that the excess emission for intermediate-mass stars is hard to detect at wavelengths longer than 3000Å because the temperatures of the stellar photosphere and the regions of the photosphere heated by the accretion are similar. MY Lup is one of the hottest (K0-type) T Tauri stars in Lupus, and therefore the contrast between continuum excess emission with respect to the photospheric+chromospheric emission, which reduces in the objects with spectral type earlier than about K3, may hamper detection of excess emission in the X-Shooter wavelength range. The excess FUV continuum emission in MY Lup is evident, and is present in almost all accreting sources, as shown in France et al. (2017). This latter study of a sample of accreting T Tauri stars showed a strong correlation between the FUV continuum luminosity and the total luminosity of the C iv lines (see their Figure 6)555We note that this is the total integrated luminosity of the C iv lines, not only the one corresponding to the excess emission with respect to the non-accreting star.. We estimated the reddening-corrected FUV continuum luminosity in MY Lup to be 3.61030 erg s-1, while the total luminosity of the C iv lines is 1.61030 erg s-1, which places MY Lup in very good agreement on that correlation. In addition, the ”1600Å Bump” observed in almost all the accreting objects investigated in Ingleby et al (2009), France et al. (2017), and Espaillat et al. (2019), is also present in MY Lup (see Figure 3), further putting it in the class of gas-rich, accreting objects.
5.2 The MY Lup disc
The age estimate of 17 Myr for MY Lup (Alcalá et al. 2017; Frasca et al. 2017) is much higher than the average for the Lupus members, which is in principle consistent with a more evolved disc. Baraffe & Chabrier (2010) concluded that episodic strong accretion during PMS evolution of low-mass stars may produce objects with smaller radius, higher central temperature, and lower luminosity compared to the non-accreting counterparts of the same mass and age, resulting in low-luminosity objects. Also, Kunimoto et al. (2017) and Baraffe et al. (2017) conclude that accretion history may affect PMS evolution leading to a luminosity spread in the HR diagram. The age of MY Lup may however be overestimated because the highly inclined disc partially obscures the stellar photosphere. The star may appear underluminous on the HR diagram if the entire stellar surface is not subject to the same extinction and part of it is almost invisible. This effect, possibly due to a warped inner dusty disc, has been observed in other objects like V 354 Mon (see Schneider et al. 2018). Thus, MY Lup may indeed be much younger than what its position on the HR diagram would suggest. From the gravity derived by Frasca et al. (2017), and assuming the mass of 1.1, we estimate a radius of 2.2 for the star, and therefore a luminosity of 3.14, which is a factor of about four higher, placing MY Lup on the HR diagram in good agreement with the other Lupus members. This would imply a 1.6 yr-1. This value estimated from the HST-UV data is indeed similar to the average derived for Lupus Class II discs. The fact that MY Lup shows up as a Class II disc for the gas properties is in line with other results from X-Shooter (e.g. Manara et al. 2014) and HST observations (see the case of RY Lup in Arulanantham et al. 2018, but also other objects in Hoadley et al. 2015), and in many cases the gas is clearly present in the large dust cavities detected by ALMA (Miotello et al. 2017; van der Marel et al. 2018, and references therein). We also note that recent studies (Manara et al. 2014; Alcalá et al. 2014; Manara et al. 2017a; Alcalá et al. 2017; van der Marel et al. 2018) find no substantial differences among the stellar and accretion properties of both primordial and transition discs (but see also Najita et al. 2007, 2015, for a different result), with the exception that the dusty transition discs with large cavities (15 AU) in Lupus tend to be more massive than the Class II disc systems (van der Marel et al. 2018).
Combined studies of SEDs and millimetre data (Owen & Clarke 2012; Ercolano & Pascucci 2017) suggested two populations of transition discs: those with low disc masses and low or non-detectable accretion, in which the inner cavities are mainly due to photoevaporation, and those with large disc masses and high accretion rates, where the inner cavities are most likely created by giant planet formation. Also, the van der Marel et al. (2018) study suggested two different evolutionary paths for the evolution of protoplanetary discs: small, low-mass discs which dissipate slowly without forming large dust cavities, and massive, large discs that go through a transition phase of disc clearing by giant planets.
The analysis by van der Marel et al. (2018) suggested a large inner dust cavity of 25 AU in the MY Lup disc. However, the continuum visibilities in this study show only a tentative cavity at best, and the DSHARP results of Huang et al. (2018) show a rather centrally peaked continuum emission. Therefore, a particularly deep and large dust cavity in the inner disc region is not evident, casting doubts on the classification as a TD. Moreover, given the high mass accretion rate of 110-8 yr-1 measured from the UV-HST data, a large dusty cavity would not be easily explained in terms of photoevaporation models (see Figure 9 in van der Marel et al. 2018). Some X-ray photoevaporation models might explain large cavities of accreting YSOs by imposing very low C and O disc abundances (Ercolano et al. 2017). This would be in principle consistent with the Miotello et al. (2017) scenario of a disc highly depleted in CO, artificially leading to low gas-mass estimates. Yet, the estimated value of 8.0 for MY Lup is still high to be compatible with those models. Therefore, if there is an inner cavity in the disc of MY Lup, it may have been caused by giant planet formation.
We note that the SPHERE observations by Avenhaus et al. (2018) detected a ring in scattered light at a radius of about 120 AU from the star. Also, the annular substructures observed by DSHARP (Huang et al. 2018) are possible features reproduced in simulations of planet–disc interactions. Nevertheless, annular structures may not necessarily be the product of planet–disc interactions (see introduction in Huang et al. 2018, for other possibilities). Analysis of the ALMA and SPHERE data of MY Lup by C. Walsh (private communication) shows that the disc is rather flared, and the gaps and rings seen in the sub-millimetre DSHARP data are relatively shallow. Further detailed radiative transfer modelling of the disc using the data gathered within DSHARP (Andrews et al. 2018), as well as future direct imaging and observations at higher angular and spectral resolution of molecular lines, will provide additional information for determining the origin of the disc substructures in MY Lup.
6 Conclusions
We report new HST-COS and -STIS observations of MY Lup, found to be a very weak or even negligible accretor based on previous X-Shooter observations. The UV-HST spectra show many emission lines, as well as strong continuum excess emission in the FUV, ascribable to accretion. This confirms that MY Lup is actively accreting mass at a rate of 1() yr-1, that is, a value similar to the average derived for Lupus Class II discs, and more than an order of magnitude above the previous X-Shooter estimate. MY Lup is the only case so far for which a significant difference between the HST and X-Shooter estimates exists that is not ascribable to variability. Among the several possible reasons for the X-Shooter-HST discrepancy are anomalous extinction and effects of scattering in the FUV. Indeed, MY Lup is peculiar in many respects: it is an almost edge-on disc and one of the hottest (K0-type) T Tauri stars in Lupus. Hence, detection of excess emission in the X-Shooter wavelength range may be hampered both by occultation effects from optically thick disc material along the line of sight and by the low contrast between continuum excess and photospheric+chromospheric emission expected for early-type ( K3) objects. The high FUV continuum luminosity of 3.61030 erg s-1, and the total luminosity of the C iv lines of 1.61030 erg s-1, as well as the strong H2 fluorescence and 1600Å Bump, place MY Lup in the class of gas-rich accreting objects. The mass accretion rate and a previously suggested large cavity of the dusty disc cannot be easily explained in terms of photoevaporation models. In fact, reviewing all available data suggests that no compelling evidence for a large dust cavity exists and we conclude that giant planet formation is simply a plausible scenario for the dust rings in the disc of MY Lup.
Acknowledgements.
We thank the referee, Greg Herczeg, for his very useful and constructive comments which helped to improve a previous version of the paper. We thank Catherine Walsh and Nieke van der Marel for their very useful comments and discussions on the disc of MY Lup, and Antonio Frasca for help and discussion on the photospheric spectrum subtraction. This work has been supported by the project PRIN-INAF 2016 ”The Cradle of Life - GENESIS-SKA (General Conditions in Early Planetary Systems for the rise of life with SKA)” and the PRIN-INAF-MAIN-STREAM 2017 ”Protoplanetary disks seen through the eyes of new-generation instruments”. This research made use of the SIMBAD database, operated at the CDS (Strasbourg, France). CFM and AM acknowledge an ESO Fellowship. PCS acknowledges support from the Deutsches Zentrum für Luft- und Raumfahrt through project 50OR1706. HMG was supported by program HST-GO-15204.001, which was provided by NASA through a grant from the Space Telescope Science Institute, which is operated by the Associations of Universities for Research in Astronomy, Incorporated, under NASA contract NAS5-26555. This work has made use of data from the European Space Agency (ESA) mission Gaia (https://www.cosmos.esa.int/gaia), processed by the Gaia Data Processing and Analysis Consortium (DPAC, https://www.cosmos.esa.int/web/gaia/dpac/ consortium). Funding for the DPAC has been provided by national institutions, in particular the institutions participating in the Gaia Multilateral Agreement. This project has received funding from the European Union’s Horizon 2020 research and innovation programme under the Marie Skłodowska-Curie grant agreement No 823823 (DUSTBUSTERS). We acknowledge with thanks the variable star observations from the AAVSO International Database contributed by observers worldwide and used in this research. We also acknowledge the use of DASCH data: the DASCH project at Harvard is grateful for partial support from NSF grants AST-0407380, AST-0909073, and AST-1313370. This work was partly supported by the Deutsche Forschungs-Gemeinschaft (DFG, German Research Foundation) - Ref no. FOR 2634/1 TE 1024/1-1, by the DFG cluster of excellence Origin and Structure of the Universe (www.universe-cluster.de)References
- Alcalá et al. (2014) Alcalá, J. M., Natta, A., Manara, C., et al. 2014, A&A, 561, 2
- Alcalá et al. (2017) Alcalá, J. M., Manara, C., Natta, A., et al. 2017, A&A, 600, 20
- Alexander et al. (2014) Alexander, R. D., Pascucci, I., Andrews, S., Armitage, P., & Cieza, L. 2014, in Protostars and Planets VI, H. Beuther, R. S. Klessen, C. P. Dullemond, & T. Henning (eds.), University of Arizona Press, 475
- Ansdell et al. (2016) Ansdell, M., Williams, J. P., van der Marel, N., et al. 2016, ApJ, 828, 46
- Andrews et al. (2011) Andrews, S. M., Wilner, D. J., Espaillat, C., et al. 2011, ApJ, 732, 42
- Andrews et al. (2018) Andrews, S. M., Huang, J., Pérez, L. M. et al. 2018, ApJ, 869, 41
- Ardila et al. (2013) Ardila, D. R., Herczeg, G. J., Gregory, S. G. et al. 2013, ApJS, 207, 1
- Arulanantham et al. (2018) Arulanantham, N., France, K., Hoadley, K. et al. 2018, ApJ, 855, 98
- Arulanantham (2018a) Arulanantham, N. 2018a, in ”Take a Closer Look, 15-19 October”, 2018 in ESO-HQ, Garching b. München, Germany. (https://zenodo.org/record/1488765#.XG_3HJx7m50)
- Arulanantham et al. (in prep.) Arulanantham, N., et al., in preparation
- Avenhaus et al. (2018) Avenhaus, H., Quanz, S.P., Garufi, A. et al. 2018, ApJ, 863, 44
- Baraffe & Chabrier (2010) Baraffe, I., & Chabrier, G. 2010, å, 521, 44
- Baraffe et al. (2015) Baraffe, I., Homeier, D., Allard, F., & Chabrier, G. 2015, A&A, 577, 42
- Baraffe et al. (2017) Baraffe, I., Elbakyan, V.G., Vorobyov, E.I., Chabrier, G. 2017, A&A, 597, 19
- Batalha et al. (1998) Batalha, C. C., Quast, G. R., Torres, C. A. O. et al. 1998, A&A, 128, 561
- Biazzo et al. (2012) Biazzo, K., Alcalá, J. M., Covino, et al. 2012, A&A, 547, 104
- Bustamante et al. (2015) Bustamante, I., Merín, B., Ribas, Á., et al. 2015, A&A, 578, 23
- Calvet et al. (2004) Calvet, N., Muzerolle, J., Briceño, C. et al., 2004, AJ, 128,129
- Cardelli et al. (1989) Cardelli, J. A., Clayton, G. C., & Mathis, J. S. 1989, ApJ, 345, 245
- Cieza et al. (2010) Cieza, L. A., Schreiber, M. R., Romero, G. A. et al. 2010, ApJ, 712, 925
- Clarke & Bouvier (2000) Clarke, C. J., Bouvier, J. 2000, MNRAS, 319, 457
- Comerón (2008) Comerón, F. 2008, Handbook of Star Forming Regions, Volume II: The Southern Sky ASP Monograph Publications, Vol. 5, B. Reipurth (ed.), p. 295
- Costigan et al. (2012) Costigan, G., Scholz, A., Stelzer, B., et al. 2012, MNRAS, 427, 1344
- Costigan et al. (2014) Costigan, G., Vink, J. S., Jorick, S., et al. 2014, MNRAS, 440, 3444
- Danforth et al. (2010) Danforth, Ch. W., Keeney, B. A., Stocke, J. T., Shull, J. M., Yao, Y. 2010, ApJ, 720, 976
- Ercolano et al. (2017) Ercolano, B., Weber, M.L, & Owen, J.E. 2017, MNRAS, 473, 64
- Ercolano & Pascucci (2017) Ercolano, B., Pascucci, I. 2017, RSOS, 470114
- Espaillat et al. (2008) Espaillat, C., Muzerolle, J., Hernández, J. et al. 2008, ApJ, 689, 145
- Espaillat et al. (2019) Espaillat, C., Robinson, C., Grant, S., & Reynolds, M. 2019, ApJ, 876, 121
- France et al. (2011) France, K., Yang, H., Linsky, J. L., 2011, ApJ, 729, 7
- France et al. (2012) France, K., Schindhelm, E., Herczeg, G. J. et al. 2012, ApJ, 756, 171
- France et al. (2014) France, K., Herczeg, G. J., McJunkin, M., Penton, S. V. 2014, ApJ, 794, 160
- France et al. (2017) France, K., Roueff, E., Abgrall, H. 2017, ApJ, 844, 169
- Frasca et al. (2017) Frasca, A., Biazzo, K., Alcalá, J. M., et al. 2017, A&A, 602, 33
- Gaia Collaboration (2018) Gaia Collaboration (Brown, A. G. A., et al.) 2018, A&A, 616, 1
- Gómez de Castro & Ferro-Fontán (2005) Gómez de Castro, A. I., Ferro-Fontán, C., 2005, MNRAS, 362,569
- Green et al. (2012) Green, J. C., Froning, C. S., Osterman, S, et al. 2012, ApJ, 744, 60
- Gregorio-Hetem et al. (1992) Gregorio-Hetem, J., Lepine, J. R. D., Quast, G. R., Torres, C. A. O., & de La Reza, R. 1992, AJ, 103, 549
- Gullbring et al. (1998) Gullbring, E., Hartmann, L., Briceño, C., & Calvet, N. 1998, ApJ, 492, 323
- Hartmann (1998) Hartmann, L. 1998, in Accretion Processes in Star Formation, Cambridge University Press
- Hartmann et al. (1987) Hartmann L. W., Soderblom D. R., Stauffer J. R., 1987, AJ, 93, 907
- Hartmann et al. (1998) Hartmann, L. E., Calvet, N., Gullbring, E., & D’Alessio, P. 1998, ApJ, 495, 385
- Hartmann, Herczeg & Calvet (2016) Hartmann, L., Herczeg, G., Calvet, N. 2016, ARA&A, 54, 135
- Herczeg et al. (2002) Herczeg, G. J., Linsky, J. L., Valenti, J. A., Johns-Krull, C. M.; Wood, B. E. 2002, ApJ, 572, 310
- Herczeg et al. (2004) Herczeg, G. J.; Wood, B. E., Linsky, J. L., Valenti, J. A., Johns-Krull, C. M. 2004, ApJ, 607, 369
- Herczeg & Hillenbrand (2008) Herczeg, G., & Hillenbrand, L. A. 2008, ApJ, 681, 594
- Herczeg & Hillenbrand (2014) Herczeg, G., & Hillenbrand, L. A. 2014, ApJ, 786, 97
- Hoadley et al. (2015) Hoadley, K., France, K., Alexander, R. D., McJunkin, M., Schneider, P. C. 2015, ApJ, 812,41
- Huang et al. (2018) Huang, J., Andrews, S. M., Dullemond, C. P., et al. 2018, ApJ, 869, 42
- Ingleby et al (2009) Ingleby, L., Calvet, N., Bergin, E., et al. 2009, ApJ, 703, 137
- Ingleby et al (2011) Ingleby, L., Calvet, N., Bergin, E., et al. 2011, ApJ, 743, 105
- Ingleby et al. (2012) Ingleby, L., Calvet, N., Herczeg, G., Briceño, C. 2012, ApJ, 752,20
- Ingleby et al. (2013) Ingleby, L., Calvet, N., Herczeg, G. et al. 2013, ApJ, 767, 1121
- Johns-Krull et al. (2000) Johns-Krull, C. M., Valenti, J. A., Linsky, J. L., et al. 2000, ApJ, 539,815
- Kenyon & Hartmann (1995) Kenyon, S, J. & Hartmann, L. 1995, ApJS, 101,117
- Kraus & Hillenbrand (2009) Kraus, A.L., Hillendbrand, L. A. 2009, ApJ, 704, 547
- Kruczek et al. (2017) Kruczek, N., France, K., Evonosky, W. et al. 2017, ApJ, 845, 3
- Kunimoto et al. (2017) Kunitomo, M., Guillot, T., Takeuchi, T., Ida, S. 2017, A&A, 599, 49
- Kurosawa et al. (2006) Kurosawa, R., Harries, T. J., & Symington, N. H., 2006, MNRAS, 370, 580
- Manara et al. (2013) Manara, C. F., Beccari, G., Da Rio, N., et al. 2013, A&A, 558, 114
- Manara et al. (2013a) Manara, C. F., Testi, L., Rigliaco, E., et al. 2013a, A&A, 551, 107
- Manara et al. (2014) Manara, C. F., Testi, L., Natta, A., et al. 2014, A&A, 568, 18
- Manara et al. (2016) Manara, C. F., Fedele, D., Herczeg, G. J., Teixeira, P. S. 2016, A&A, 585, 136
- Manara et al. (2017) Manara, C. F., Frasca, A., Alcalá, J. M., Natta, A., Stelzer, B., Testi, L. 2017, A&A, 605, 86
- Manara et al. (2017a) Manara, C. F., Testi, L., Herczeg, G. J., et al. 2017, A&A, 604, 127
- Martin et al. (2005) Martin, D. C., Fanson, J., Schiminovich, D., et al. 2005, ApJ, 619, 1
- Merín et al. (2008) Merín, B., Jørgensen, J. K., Spezzi, L., et al. 2008, ApJS, 177, 551
- Merín et al. (2010) Merín, B., Brown, J. M., Oliveira, I., et al. 2010, ApJ, 718, 1200
- Miotello et al. (2017) Miotello, A., van Dishoeck, E. F., Williams, J. P. et al. 2017, A&A, 599, 113
- Morbidelli & Raymond (2016) Morbidelli, A., Raymond, S. N. 2016, JGRE, 121, 1962
- Morrissey et al. (2005) Morrissey, P., Schiminovich, D., Barlow, T. A. et al. 2005, ApJ, 619, 7
- Najita et al. (2007) Najita, J. R., Strom, S. E. & Muzerolle, J. 2007, MNRAS, 378, 369
- Najita et al. (2015) Najita, J. R., Andrews, S. M. & Muzerolle, J. 2015, MNRAS, 450, 3559
- Nisini et al. (2018) Nisini, B., Antoniucci, S., Alcalá, J. M., et al. 2018, A&A, 609, 89
- Owen & Clarke (2012) Owen, J. E., & Clarke, C. J. 2012, MNRAS, 426, L96
- Robinson & Espaillat (2019) Robinson, C., & Espaillat, C. 2019, in press (arXiv:1903.01987)
- Romero et al. (2012) Romero, G. A., Schreiber, M. R., Cieza, L. A., et al. 2012, ApJ, 749, 79 schindhelm12
- Schindhelm et al. (2012) Schindhelm, E., France, K., Burgh, E. B. et al. 2012, ApJ, 746, 97
- Schneider et al. (2015) Schneider, P. C., France, K., Günther, H. M., et al. 2015, A&A, 584, 51
- Schneider et al. (2018) Schneider, P. C., Manara, C., Fachini, S., et al. 2018, A&A, 614, 108
- Siess et al. (2000) Siess, L., Dufour, E., & Forestini, M. 2000, A&A, 358, 593
- Valenti et al. (2000) Valenti, J. A., Johns-Krull, C. M., & Linsky, J. L. 2000, ApJS, 129, 399
- van der Marel et al. (2018) van der Marel, N., Williams, J. P., Ansdell, M., et al. 2018, ApJ, 854, 177
- Venuti et al. (2014) Venuti, L., Bouvier, J., Flaccomio, E., et al. 2014, A&A, 570, 82
- Vernet et al. (2011) Vernet, J., Dekker, H., D’Odorico, S., et al. 2011, A&A, 536, 105
- Villenave et al. (2019) Villenave, M., Benisty, M., dent, W. R. F. et al. 2011, A&A, in press
- Vorobyov & Basu (2009) Vorobyov, E. I., & Basu, S. 2009, ApJ, 703, 922
- Woodgate et al. (1998) Woodgate, B. E., Kimble, R. A., Bowers, C. W. et al. 1998, PASP, 110, 1183
- Yang et al. (2012) Yang, H., Herczeg, G. J., & Linsky, J. L. et al. 2012, ApJ, 744, 121
Appendix A Revisited stellar and accretion properties for the Lupus sample
Table LABEL:stell_acc_prop_gdr2 lists some of the stellar and accretion properties for the Lupus T Tauri stars in the Alcalá et al. (2017) sample as updated using the distances drawn form the Gaia DR2 (Gaia Collaboration 2018). The and values are derived using both the Baraffe et al. (2015) and Siess et al. (2000) evolutionary tracks, and are respectively labelled as B15 and S00 in the table. The distances of the individual objects are not significantly different from those adopted in Alcalá et al. (2017) and therefore changes in the stellar and accretion properties are small. The main difference is that the YSOs in the Lupus III cloud are on the average at a distance of 159 pc and not 200 pc as previously assumed, while most of the YSOs in the other clouds are also at a distance of about 160 pc and not 150 pc. There are three problematic objects namely Sz102, SSTc2dJ160703.9-391112 and 2MASSJ16085373-3914367. The former is flagged with large parallax error, while the second has no measurement, and the third one has astrometric excess noise larger than 5. For these three we adopt the average value of 159 pc.
Figure 8 shows the updated – plot. To generate this plot we use the results from the Siess et al. (2000) tracks for masses 0.1 and those of Baraffe et al. (2015) for the three objects with lower values (see discussion in Section 4.1 of Alcalá et al. 2017, for the similarities of the tracks depending on mass).
The plot shows that the accretion properties of MY Lup, after the new and estimate based on HST data (values in bold characters in Table LABEL:stell_acc_prop_gdr2), are similar to those of transitional and Class II discs of similar mass. The general conclusion on the bi-modal behaviour of the – relationship remains basically the same as in Alcalá et al. (2017) and Manara et al. (2017). Interestingly, the transitional discs fall in general in the lower envelope of the distribution of points in the diagram.
| Object | SpT | (B15) | (B15) | (S00) | (S00) | Notes | |||||
| [K] | [mag.] | [pc] | [] | [] | [] | [yr-1] | [] | [yr-1] | |||
| Sz66 | M3 | 3415 | 1.00 | 157 | 0.22 | -1.76 | 0.29 | -8.50 | 0.31 | -8.53 | |
| AKC2006-19 | M5 | 3125 | 0.00 | 153 | 0.02 | -4.08 | 0.14 | -10.97 | 0.12 | -10.92 | |
| Sz69 | M4.5 | 3197 | 0.00 | 155 | 0.09 | -2.77 | 0.20 | -9.48 | 0.19 | -9.47 | |
| Sz71 | M1.5 | 3632 | 0.50 | 156 | 0.33 | -2.17 | 0.41 | -9.02 | 0.42 | -9.03 | |
| Sz72 | M2 | 3560 | 0.75 | 156 | 0.27 | -1.77 | 0.37 | -8.60 | 0.38 | -8.61 | |
| Sz73 | K7 | 4060 | 3.50 | 157 | 0.46 | -0.96 | 0.78 | -8.12 | 0.79 | -8.12 | |
| Sz74 | M3.5 | 3342 | 1.50 | 159 | 1.16 | -1.45 | 0.30 | -7.81 | 0.29 | -7.83 | |
| Sz83 | K7 | 4060 | 0.00 | 160 | 1.49 | -0.25 | 0.67 | -7.08 | 0.74 | -7.12 | |
| Sz84 | M5 | 3125 | 0.00 | 153 | 0.13 | -2.68 | 0.17 | -9.23 | 0.19 | -9.27 | td |
| Sz130 | M2 | 3560 | 0.00 | 160 | 0.18 | -2.14 | 0.39 | -9.09 | 0.37 | -9.06 | |
| Sz88A | M0 | 3850 | 0.25 | 158 | 0.31 | -1.40 | 0.61 | -8.49 | 0.58 | -8.47 | |
| Sz88B | M4.5 | 3197 | 0.00 | 159 | 0.07 | -3.30 | 0.20 | -10.05 | 0.19 | -10.02 | |
| Sz91 | M1 | 3705 | 1.20 | 159 | 0.20 | -2.00 | 0.51 | -9.07 | 0.46 | -9.03 | td |
| Lup713 | M5.5 | 3057 | 0.00 | 174 | 0.02 | -3.62 | 0.11 | -10.40 | 0.10 | -10.38 | |
| Lup604s | M5.5 | 3057 | 0.00 | 160 | 0.04 | -3.89 | 0.12 | -10.56 | 0.11 | -10.51 | |
| Sz97 | M4 | 3270 | 0.00 | 158 | 0.11 | -3.11 | 0.24 | -9.88 | 0.23 | -9.85 | |
| Sz99 | M4 | 3270 | 0.00 | 159 | 0.05 | -2.80 | 0.23 | -9.73 | 0.19 | -9.65 | |
| Sz100 | M5.5 | 3057 | 0.00 | 137 | 0.08 | -3.33 | 0.14 | -9.87 | 0.14 | -9.87 | td |
| Sz103 | M4 | 3270 | 0.70 | 160 | 0.12 | -2.60 | 0.23 | -9.33 | 0.24 | -9.34 | |
| Sz104 | M5 | 3125 | 0.00 | 166 | 0.07 | -3.36 | 0.16 | -10.03 | 0.16 | -10.00 | |
| Lup706 | M7.5 | 2795 | 0.00 | 159 | 0.002 | -5.00 | 0.06 | -11.90 | sl, ost | ||
| Sz106 | M0.5 | 3777 | 1.00 | 162 | 0.06 | -2.68 | 0.57 | -10.07 | 0.49 | -10.00 | sl |
| Par-Lup3-3 | M4 | 3270 | 2.20 | 159 | 0.15 | -3.10 | 0.23 | -9.77 | 0.24 | -9.79 | |
| Par-Lup3-4 | M4.5 | 3197 | 0.00 | 151 | 0.002 | -4.35 | 0.17 | -11.81 | 0.16 | -11.78 | sl |
| Sz110 | M4 | 3270 | 0.00 | 160 | 0.18 | -2.20 | 0.23 | -8.84 | 0.25 | -8.88 | |
| Sz111 | M1 | 3705 | 0.00 | 158 | 0.21 | -2.40 | 0.51 | -9.47 | 0.45 | -9.42 | td |
| Sz112 | M5 | 3125 | 0.00 | 160 | 0.12 | -3.39 | 0.17 | -9.94 | 0.18 | -9.98 | td |
| Sz113 | M4.5 | 3197 | 1.00 | 163 | 0.04 | -2.28 | 0.19 | -9.12 | 0.17 | -9.09 | |
| 2MASSJ16085953-3856275 | M8.5 | 2600 | 0.00 | 150 | 0.01 | -4.85 | 0.02 | -11.02 | ost | ||
| SSTc2d160901.4-392512 | M4 | 3270 | 0.50 | 164 | 0.10 | -3.17 | 0.23 | -9.95 | 0.23 | -9.93 | |
| Sz114 | M4.8 | 3175 | 0.30 | 162 | 0.21 | -2.68 | 0.19 | -9.17 | 0.22 | -9.25 | |
| Sz115 | M4.5 | 3197 | 0.50 | 158 | 0.11 | -2.91 | 0.20 | -9.57 | 0.20 | -9.57 | |
| Lup818s | M6 | 2990 | 0.00 | 157 | 0.02 | -4.31 | 0.08 | -10.96 | 0.10 | -11.05 | |
| Sz123A | M1 | 3705 | 1.25 | 159 | 0.13 | -2.00 | 0.55 | -9.21 | 0.46 | -9.12 | td |
| Sz123B | M2 | 3560 | 0.00 | 159 | 0.03 | -2.90 | 0.40 | -10.24 | 0.32 | -10.13 | sl |
| SST-Lup3-1 | M5 | 3125 | 0.00 | 165 | 0.04 | -3.77 | 0.16 | -10.53 | 0.14 | -10.47 | |
| Sz65 | K7 | 4060 | 0.60 | 155 | 0.89 | -2.57 | 0.70 | -9.52 | 0.75 | -9.55 | |
| AKC2006-18 | M6.5 | 2935 | 0.00 | 149 | 0.01 | -4.60 | 0.07 | -11.23 | ost | ||
| SSTc2dJ154508.9-341734 | M5.5 | 3060 | 5.50 | 155 | 0.06 | -1.77 | 0.14 | -8.36 | 0.12 | -8.32 | |
| Sz68 | K2 | 4900 | 1.00 | 154 | 5.42 | -1.18 | 2.15 | -8.39 | obt | ||
| SSTc2dJ154518.5-342125 | M6.5 | 2935 | 0.00 | 152 | 0.04 | -4.29 | 0.08 | -10.72 | 0.10 | -10.79 | |
| Sz81A | M4.5 | 3200 | 0.00 | 160 | 0.25 | -2.44 | 0.19 | -8.92 | 0.23 | -9.00 | |
| Sz81B | M5.5 | 3060 | 0.00 | 160 | 0.12 | -3.14 | 0.15 | -9.61 | 0.16 | -9.66 | |
| Sz129 | K7 | 4060 | 0.90 | 162 | 0.43 | -1.13 | 0.78 | -8.30 | 0.82 | -8.33 | |
| SSTc2dJ155925.2-423507 | M5 | 3125 | 0.00 | 147 | 0.02 | -4.42 | 0.14 | -11.29 | 0.12 | -11.23 | |
| RYLup | K2 | 4900 | 0.40 | 159 | 1.87 | -0.85 | 1.53 | -8.16 | td, obt | ||
| SSTc2dJ160000.6-422158 | M4.5 | 3200 | 0.00 | 161 | 0.10 | -3.04 | 0.20 | -9.73 | 0.20 | -9.72 | |
| SSTc2dJ160002.4-422216 | M4 | 3270 | 1.40 | 164 | 0.18 | -2.92 | 0.23 | -9.56 | 0.25 | -9.60 | |
| SSTc2dJ160026.1-415356 | M5.5 | 3060 | 0.90 | 164 | 0.08 | -3.22 | 0.14 | -9.76 | 0.14 | -9.76 | |
| MYLup | K0 | 5100 | 1.30 | 157 | 0.85 | -0.65 | 1.09 | -8.01 | 1.06 | -7.99 | td? |
| Sz131 | M3 | 3415 | 1.30 | 160 | 0.15 | -2.34 | 0.30 | -9.18 | 0.30 | -9.18 | |
| Sz133 | K5 | 4350 | 1.80 | 153 | 0.07 | -1.78 | sl, bz | ||||
| SSTc2dJ160703.9-391112 | M4.5 | 3200 | 0.60 | 159 | 0.003 | -5.40 | 0.16 | -12.76 | sl, obt | ||
| Sz90 | K7 | 4060 | 1.80 | 160 | 0.42 | -1.79 | 0.78 | -8.96 | 0.80 | -8.97 | |
| Sz95 | M3 | 3415 | 0.80 | 158 | 0.26 | -2.70 | 0.29 | -9.40 | 0.32 | -9.44 | |
| Sz96 | M1 | 3705 | 0.80 | 157 | 0.42 | -2.51 | 0.45 | -9.37 | 0.46 | -9.38 | |
| 2MASSJ16081497-3857145 | M5.5 | 3060 | 1.50 | 159 | 0.01 | -3.60 | 0.10 | -10.60 | 0.11 | -10.60 | td |
| Sz98 | K7 | 4060 | 1.00 | 156 | 1.53 | -0.71 | 0.67 | -7.54 | 0.74 | -7.59 | |
| Lup607 | M6.5 | 2935 | 0.00 | 175 | 0.05 | -5.02 | 0.09 | -11.60 | 0.10 | -11.65 | |
| Sz102 | K2 | 4900 | 0.70 | 159 | 0.01 | -2.20 | sl, bz | ||||
| SSTc2dJ160830.7-382827 | K2 | 4900 | 0.20 | 156 | 1.84 | -2.02 | 1.53 | -9.32 | td | ||
| SSTc2dJ160836.2-392302 | K6 | 4205 | 1.70 | 154 | 1.15 | -1.03 | 0.83 | -8.04 | 0.92 | -8.09 | |
| Sz108B | M5 | 3125 | 1.60 | 169 | 0.11 | -3.05 | 0.17 | -9.62 | 0.18 | -9.65 | |
| 2MASSJ16085324-3914401 | M3 | 3415 | 1.90 | 168 | 0.21 | -3.25 | 0.29 | -10.00 | 0.31 | -10.02 | |
| 2MASSJ16085373-3914367 | M5.5 | 3060 | 4.00 | 159 | 0.00 | -3.90 | 0.10 | -10.94 | 0.12 | -11.01 | |
| 2MASSJ16085529-3848481 | M6.5 | 2935 | 0.00 | 158 | 0.05 | -4.31 | 0.09 | -10.72 | 0.10 | -10.78 | |
| SSTc2dJ160927.0-383628 | M4.5 | 3200 | 2.20 | 159 | 0.07 | -1.50 | 0.20 | -8.25 | 0.19 | -8.23 | |
| Sz117 | M3.5 | 3340 | 0.50 | 159 | 0.28 | -2.30 | 0.25 | -8.91 | 0.29 | -8.96 | |
| Sz118 | K5 | 4350 | 1.90 | 164 | 0.72 | -1.97 | 1.04 | -9.21 | 1.10 | -9.24 | |
| 2MASSJ16100133-3906449 | M6.5 | 2935 | 1.70 | 193 | 0.19 | -3.43 | 0.14 | -9.74 | obt | ||
| SSTc2dJ161018.6-383613 | M5 | 3125 | 0.50 | 159 | 0.04 | -4.00 | 0.15 | -10.76 | 0.14 | -10.72 | |
| SSTc2dJ161019.8-383607 | M6.5 | 2935 | 0.00 | 159 | 0.04 | -4.10 | 0.08 | -10.52 | 0.10 | -10.59 | |
| SSTc2dJ161029.6-392215 | M4.5 | 3200 | 0.90 | 163 | 0.11 | -3.38 | 0.20 | -10.05 | 0.20 | -10.06 | td |
| SSTc2dJ161243.8-381503 | M1 | 3705 | 0.80 | 160 | 0.39 | -2.19 | 0.45 | -9.07 | 0.46 | -9.08 | |
| SSTc2dJ161344.1-373646 | M5 | 3125 | 0.60 | 160 | 0.04 | -2.49 | 0.16 | -9.24 | 0.15 | -9.20 | |
| Sz75 | K6 | 4205 | 0.70 | 152 | 1.48 | -0.69 | 0.80 | -7.63 | 0.89 | -7.68 | |
| Sz76 | M4 | 3270 | 0.20 | 160 | 0.18 | -2.55 | 0.23 | -9.18 | 0.25 | -9.23 | td |
| Sz77 | K7 | 4060 | 0.00 | 155 | 0.59 | -1.67 | 0.75 | -8.76 | 0.76 | -8.77 | |
| RXJ1556.1-3655 | M1 | 3705 | 1.00 | 158 | 0.26 | -0.85 | 0.49 | -7.85 | 0.47 | -7.83 | |
| Sz82 | K5 | 4350 | 0.90 | 159 | 2.60 | -1.05 | 0.95 | -7.98 | 1.13 | -8.05 | |
| EXLup | M0 | 3850 | 1.10 | 158 | 0.76 | -0.91 | 0.53 | -7.74 | 0.57 | -7.77 |
td: transitional disc
sl: sub-luminous YSO
bz: sub-luminous object falling below the zero-age main sequence on the HR diagram
ost: outside mass range of the S00 tracks
obt: outside mass range of the B15 tracks