Investigation of 13C Isotopic Fractionation of CCH in Two Starless Cores: L1521B and L134N
Abstract
We have carried out observations of CCH and its two 13C isotopologues, 13CCH and C13CH, in the 84 – 88 GHz band toward two starless cores, L1521B and L134N (L183), using the Nobeyama 45 m radio telescope. We have detected C13CH with a signal-to-noise (S/N) ratio of 4, whereas no line of 13CCH was detected in either the dark clouds. The column densities of the normal species were derived to be () cm-2 and () cm-2 () in L1521B and L134N, respectively. The column density ratios of (C13CH)/(13CCH) were calculated to be and in L1521B and L134N, respectively. The characteristic that 13CCH is less abundant than C13CH is likely common for dark clouds. Moreover, we find that the 12C/13C ratios of CCH are much higher than those of HC3N in L1521B by more than a factor of 2, as well as in Taurus Molecular Cloud-1 (TMC-1). In L134N, the differences in the 12C/13C ratios between CCH and HC3N seem to be smaller than those in L1521B and TMC-1. We discuss the origins of the 13C isotopic fractionation of CCH and investigate possible routes that cause the significantly high 12C/13C ratio of CCH especially in young dark clouds, with the help of chemical simulations. The high 12C/13C ratios of CCH seem to be caused by reactions between hydrocarbons (e.g., CCH, C2H2, -C3H) and C+.
1 Introduction
Exotic unsaturated carbon-chain molecules are one of the crucial constituents of approximately 200 molecules detected in the interstellar medium (ISM) and circumstellar shells. In fact, they account for around 40% of the interstellar molecules. Therefore, it is important for astrochemists to understand carbon-chain chemistry.
These carbon-chain species have long been associated with young starless cores such as Taurus Molecular Cloud-1 (TMC-1; Suzuki et al., 1992; Kaifu et al., 2004). They are formed by gas-phase ion-molecule reactions and neutral-neutral reactions before carbon atoms are converted into CO molecules. Besides the classical carbon-chain chemistry, an ion-molecule chemistry occurring at somewhat higher temperatures, and starting from gaseous methane (CH4), named warm carbon-chain chemistry (WCCC; Sakai & Yamamoto, 2013), was found to occur around low-mass Class 0/I protostars such as L1527. In particular, methane sublimated from dust grains reacts with ionic carbon (C+) in the gas phase, which is a trigger of successive carbon-chain formation. It was recently found that formation of cyanopolyynes (HC2n+1N, ) occurs in the warm dense gas around high-mass protostellar objects (Taniguchi et al., 2018, 2019b).
The formation and destruction mechanisms of carbon-chain molecules were investigated mainly by astrochemical simulations (e.g., Suzuki et al., 1992). In these early stages, it was unclear what specific reactions significantly contribute to the formation of carbon-chain species. Another method to investigate the main formation pathways of carbon-chain molecules consists of observations of the 13C isotopic fractionation (e.g., Takano et al., 1998).
The first hint of 13C isotopic fractionation for carbon-chain molecules was found in HC5N toward TMC-1 using the Nobeyama 45 m radio telescope (Takano et al., 1990). However, signal-to-noise ratios were not high enough to confirm the differences in abundances among its five 13C isotopologues and such studies were left for future work. The confirmation of the 13C isotopic fractionation was achieved for HC3N in TMC-1 (Takano et al., 1998). Other observations including fractionation studies targeting different carbon-chain molecules were carried out in TMC-1. These species include CCS (Sakai et al., 2007), CCH (Sakai et al., 2010), C3S and C4H (Sakai et al., 2013), HC5N (Taniguchi et al., 2016a), and HC7N (Burkhardt et al., 2018).
Based on the observations mentioned in the preceding paragraph, some possible main formation pathways of cyanopolyynes were investigated (Takano et al., 1998; Taniguchi et al., 2016a; Burkhardt et al., 2018). In the case of HC3N, the abundances of H13CCCN and HC13CCN are similar to each other, and HCC13CN is more abundant than the others. From the results, the reaction between C2H2 and CN was suggested as the main formation pathway of HC3N (Takano et al., 1998). On the other hand, there is no significant difference in abundance among the five 13C isotopologues of HC5N. Reactions between hydrocarbon ions (C5H, ) and nitrogen atoms followed by dissociative recombination reactions were found to be the most plausible route to explain the observed 13C isotopic fractionation of HC5N (Taniguchi et al., 2016a). These proposed reactions were supported by the 14N/15N ratios of HC3N and HC5N (Taniguchi & Saito, 2017). In the case of HC7N, the fractionation results and proposed main formation mechanism are similar to those of HC5N (Burkhardt et al., 2018).
The main formation mechanisms of HC3N were investigated in other sources including the L1527 low-mass star-forming core and the G28.28–0.36 high-mass star-forming core (Taniguchi et al., 2016b), as well as two starless cores (L1521B and L134N; Taniguchi et al., 2017). Except for the case of L134N, the reaction between C2H2 and CN has been proposed as its main formation mechanism (Taniguchi et al., 2016b, 2017), while the reaction between CCH and HNC could explain the observed 13C isotopic fractionation in L134N (Taniguchi et al., 2017). The proposed main formation pathway of HC3N in the star-forming cores L1527 and G28.28–0.36 is consistent with model calculations for WCCC (Hassel et al., 2008) and for hot cores (Taniguchi et al., 2019a). The differences among starless cores are probably caused by their different ages; L134N is considered to be more evolved than L1521B and TMC-1 (Taniguchi et al., 2017).
Another interesting feature involving carbon isotopes was the observation that the 12C/13C ratios of carbon-chain molecules are higher than the elemental ratio in the local interstellar medium (; Milam et al., 2005), an effect known as the dilution of the 13C species111In this paper, we define the dilution of the 13C species as the 12C/13C ratios higher than 70, which is the mean 12C/13C ratio in the local interstellar medium.. This dilution is considered to be caused at least in part by the low 13C+ abundance which occurs via the reaction:
| (1) |
a reaction that is efficient especially in low-temperature conditions (Langer et al., 1984). The importance of this reaction stems from the fact that the initial step in the formation of carbon-chain molecules in dark clouds occurs via gas-phase ion-molecule reactions or neutral-neutral reactions with C+ or C. Hence, the loss of the 13C+ abundance leads to the high 12C/13C ratios of carbon-chain molecules. However, the different degrees of the dilution of the 13C species among carbon-chain molecules found in TMC-1 cannot be explained only by reaction (1) (Taniguchi et al., 2016a).
In this paper, we report the observations of the transition lines of CCH and its two 13C isotopologues in L1521B ( pc) and L134N ( pc) using the Nobeyama 45 m radio telescope. We describe our observations in Section 2. The results and derived parameters with the methods utilized are presented in Section 3. The differential fractionation between the two 13C-containing CCH isotopologues in L1521B and L134N and possible mechanisms causing the heavy dilution of 13C-containing species especially of CCH in dark clouds are discussed with the help of a chemical simulation in Sections 4.1 and 4.2, respectively. Our conclusions are summarized in Section 5.
2 Observations
The observations were carried out in 2019 January with the Nobeyama 45-m radio telescope (Proposal ID: CG181003, PI: Kotomi Taniguchi, 2018-2019 season). The transition lines of CCH and its two 13C isotopologues in the 84 – 88 GHz band were observed simultaneously with the T70 receiver. The beam size and main beam efficiency () were 19″and 55%, respectively. The system temperatures were between 170 and 270 K depending on the weather conditions and elevation. We used the SAM45 FX-type digital correlator in the frequency setup whose bandwidth and frequency resolution were 125 MHz and 30.52 kHz, respectively. The frequency resolution corresponds to the velocity resolution of 0.1 km s-1 at 86 GHz. We conducted the 2-channel binning in the final spectra, and thus the velocity resolution of the final spectra is 0.2 km s-1.
The position-switching mode was employed. The observed positions were (, ) = (04h24m1267, +26°36′528) and (15h54m1272, -02°49′474) for L1521B and L134N, respectively. The off position for L1521B was set to be (, ) = (+4′, +4′) away from the on-source position, and that for L134N was set at away in the right ascension. The scan pattern was 20 s and 20 s for on-source and off-source positions, respectively. The chopper-wheel calibration method was adopted and hence the absolute calibration error was approximately 10%.
We checked the pointing accuracy by observations of the SiO () maser lines from NML Tau at (, ) = (03h53m2886, +11°24′224) and WX-Ser at (, ) = (15h27m4705, +19°33′518) during the observations of L1521B and L134N, respectively. The pointing observations were conducted using the H40 receiver every 1.5 hour. The pointing accuracy was within 3″.
3 Results and Analyses
3.1 Results
| Species | Transition | FrequencyaaTaken from the Cologne Database for Molecular Spectroscopy, CDMS (Müller et al., 2005). | a,ba,bfootnotemark: | ccThe numbers in parentheses represent the standard deviation in the Gaussian fit. The errors are written in units of the last significant digit. | ccThe numbers in parentheses represent the standard deviation in the Gaussian fit. The errors are written in units of the last significant digit. | ddThe errors were 0.2 km s-1, corresponding to the velocity resolution of the final spectra. | ccThe numbers in parentheses represent the standard deviation in the Gaussian fit. The errors are written in units of the last significant digit. | rmseeThe rms noises were evaluated in emission-free region in the scale. |
|---|---|---|---|---|---|---|---|---|
| (GHz) | (K) | (km s-1) | (km s-1) | (K km s-1) | (mK) | |||
| L1521B | ||||||||
| CCH | 87.284156 | 0.17 | 0.588 (9) | 0.423 (8) | 6.5 | 0.265 (6) | 4.7 | |
| 87.316925 | 1.67 | 1.165 (12) | 0.459 (5) | 6.4 | 0.569 (9) | 4.7 | ||
| 87.328624 | 0.83 | 0.843 (10) | 0.4223 (6) | 6.5 | 0.379 (7) | 4.7 | ||
| 87.402004 | 0.83 | 1.13 (2) | 0.405 (9) | 6.4 | 0.485 (14) | 5.6 | ||
| 87.407165 | 0.33 | 0.865 (15) | 0.408 (8) | 6.4 | 0.375 (10) | 5.6 | ||
| 87.446470 | 0.17 | 0.678 (12) | 0.405 (8) | 6.4 | 0.292 (8) | 5.6 | ||
| 13CCHffThe upper limits of the peak intensities correspond to the limits and those of the integrated intensities were derived from the upper limits of peak intensities assuming that the line widths are equal to the average values of the normal species (0.42 km s-1 and 0.33 km s-1 in L1521B and L134N, respectively). | 84.119329 | 2.00 | … | … | 3.2 | |||
| 84.124143 | 1.22 | … | … | 3.0 | ||||
| 84.151352 | 0.66 | … | … | 2.9 | ||||
| C13CHffThe upper limits of the peak intensities correspond to the limits and those of the integrated intensities were derived from the upper limits of peak intensities assuming that the line widths are equal to the average values of the normal species (0.42 km s-1 and 0.33 km s-1 in L1521B and L134N, respectively). | 85.229326 | 2.00 | 0.026 (13) | 0.31 (19) | 6.5 | 0.0084 (7) | 3.8 | |
| 85.232792 | 1.25 | 0.025 (7) | 0.53 (16) | 6.5 | 0.0139 (6) | 3.8 | ||
| 85.247708 | 0.65 | 0.016 (5) | 0.7 (3) | 6.4 | 0.0129 (6) | 3.5 | ||
| 85.256952 | 1.28 | … | … | 3.6 | ||||
| L134N (L183) | ||||||||
| CCH | 87.284156 | 0.17 | 0.358 (11) | 0.311 (12) | 2.6 | 0.118 (6) | 4.8 | |
| 87.316925 | 1.67 | 0.853 (8) | 0.379 (4) | 2.5 | 0.344 (5) | 4.8 | ||
| 87.328624 | 0.83 | 0.637 (12) | 0.339 (8) | 2.5 | 0.229 (7) | 4.8 | ||
| 87.402004 | 0.83 | 0.777 (11) | 0.335 (5) | 2.5 | 0.277 (6) | 5.4 | ||
| 87.407165 | 0.33 | 0.538 (16) | 0.320 (12) | 2.5 | 0.183 (9) | 5.4 | ||
| 87.446470 | 0.17 | 0.415 (15) | 0.303 (14) | 2.5 | 0.134 (8) | 5.4 | ||
| 13CCHffThe upper limits of the peak intensities correspond to the limits and those of the integrated intensities were derived from the upper limits of peak intensities assuming that the line widths are equal to the average values of the normal species (0.42 km s-1 and 0.33 km s-1 in L1521B and L134N, respectively). | 84.119329 | 2.00 | … | … | 3.1 | |||
| 84.124143 | 1.22 | … | … | 3.1 | ||||
| 84.151352 | 0.66 | … | … | 2.9 | ||||
| C13CHffThe upper limits of the peak intensities correspond to the limits and those of the integrated intensities were derived from the upper limits of peak intensities assuming that the line widths are equal to the average values of the normal species (0.42 km s-1 and 0.33 km s-1 in L1521B and L134N, respectively). | 85.229326 | 2.00 | 0.016 (6) | 0.7 (3) | 2.6 | 0.011 (6) | 3.4 | |
| 85.232792 | 1.25 | 0.020 (6) | 0.42 (14) | 2.5 | 0.009 (4) | 3.3 | ||
| 85.247708 | 0.65 | … | … | 3.6 | ||||
| 85.256952 | 1.28 | … | … | 3.7 |
We conducted the data reduction using Java NEWSTAR, which is the software for data reduction and analyses of the Nobeyama data. The total on-source integration times were 18.75 hr and 23.5 hr for L1521B and L134N, respectively. We fitted the spectra with a Gaussian profile, and the obtained spectral line parameters are summarized in Table 1.
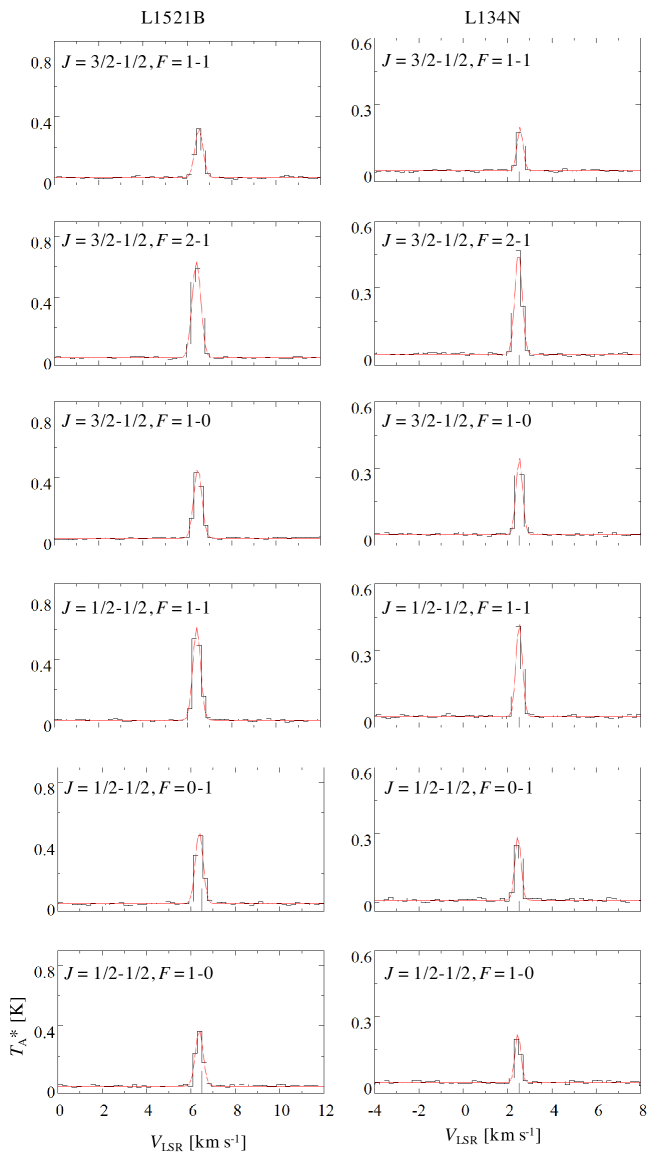
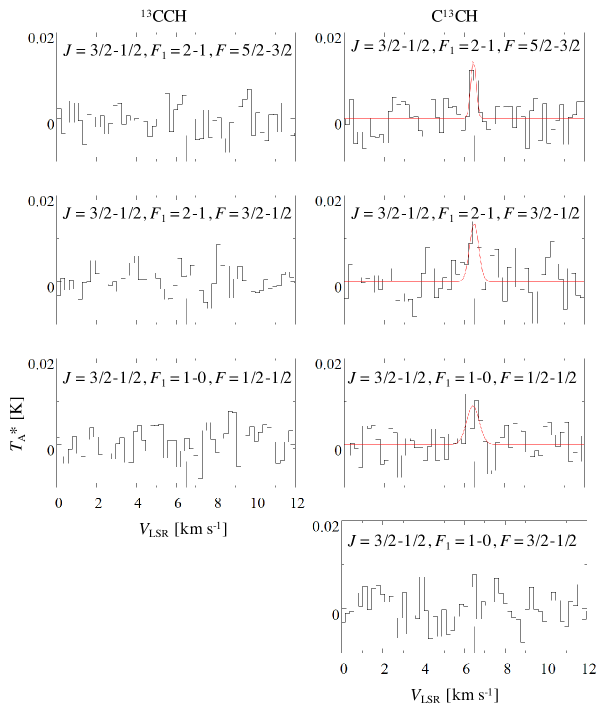
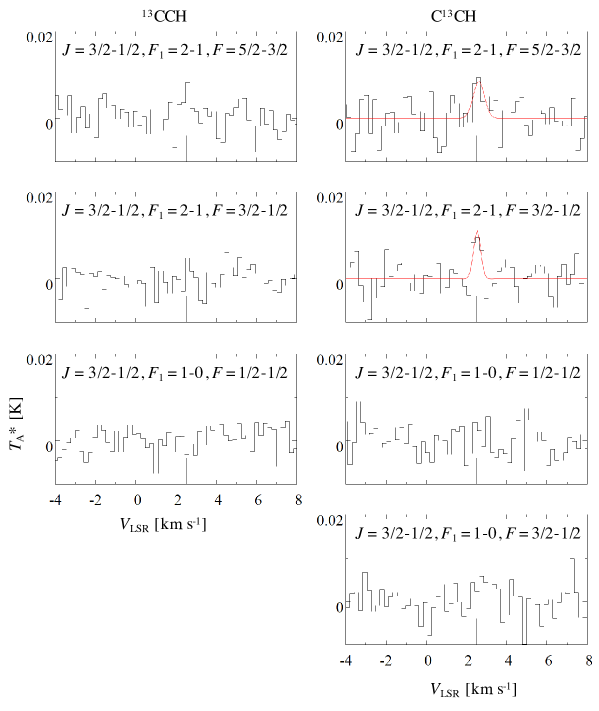
Figure 1 shows the spectra of the normal species of CCH in L1521B and L134N. The black vertical lines indicate the systemic velocities of each source, which are 6.5 km s-1 and 2.5 km s-1 in L1521B and L134N, respectively. The velocity components of all the transition lines are consistent with the systemic velocities of each source within their errors of 0.2 km s-1. Figures 2 and 3 show the spectra of the isotopomers 13CCH (left panels) and C13CH (right panels) in L1521B and L134N, respectively. In either the sources, no line of 13CCH was detected. Two strong transition lines ( and ) of C13CH were detected in L1521B and L134N with a signal-to-noise (S/N) ratio of 4. In addition, the weaker transition line () was tentatively detected with an S/N ratio of 3 in L1521B.
3.2 Analyses
| Parameters | L1521B | L134N |
|---|---|---|
| (CCH) [cm-2]aaThe values were derived assuming that is cm-3 with the non-LTE method. | () | () |
| (13CCH) [cm-2] | ||
| (C13CH) [cm-2] bbIntrinsic line strength. | () | () |
| (CCH)/(13CCH)ccWe assumed that the absolute calibration error is cancelled out because all of the lines were observed simultaneously when we derive their errors. This assumption means that the errors of the 12C/13C ratios would not be affected by the absolute calibration error. | ||
| (CCH)/(C13CH) ccWe assumed that the absolute calibration error is cancelled out because all of the lines were observed simultaneously when we derive their errors. This assumption means that the errors of the 12C/13C ratios would not be affected by the absolute calibration error. | ||
| (H2) [cm-2] | ||
| (CCH) | () | () |
Note. — The errors indicate the standard deviation.
We derived the column densities and excitation temperatures of the normal species with the non-LTE code RADEX (van der Tak et al., 2007). The gas kinetic temperature is assumed to be 10 K, which is a typical value in dark clouds (Hirota et al., 1998). The collision rate coefficients were taken from Spielfiedel et al. (2012). We calculated the parameters using two H2 densities () in each source. The assumed H2 densities are cm-3 (Hirota et al., 1998) and cm-3 (Hirota et al., 2004) in L1521B, and cm-3 (Hirota et al., 1998) and cm-3 (Dickens et al., 2000) in L134N.
We derived the column densities and excitation temperatures from the intensities of the two weakest hyperfine components by a least-squares method (Sakai et al., 2010)222The derived excitation temperatures and optical depths of each hyperfine component are summarized in Table 5 in Appendix B.. The derived column densities and excitation temperatures of CCH are () cm-2 and K () for cm-3, and () cm-2 and K for cm-3 in L1521B. For L134N, the column densities and excitation temperatures of CCH were derived to be () cm-2 and K for cm-3, and () cm-2 and K for cm-3, respectively. Because an excitation temperature of K is consistent with typical values of carbon-chain molecules in dark clouds (Suzuki et al., 1992) and the critical density of the transition of CCH is cm-3 (Kauffmann et al., 2017), we employ the values obtained with cm-3 in the following sections. The excitation temperature of K is lower than the gas kinetic temperature, but such low excitation temperatures have been derived in prestellar cores (e.g., Padovani et al., 2009).
We derived the column densities of the 13C isotopologues assuming the LTE condition using the following formulae (Taniguchi et al., 2016a):
| (2) |
where
| (3) |
and
| (4) |
In equation (2), is the peak intensity (Table 1) and is the optical depth. and are the excitation temperature and the cosmic microwave background temperature (2.73 K), respectively. We assumed that the excitation temperatures of the 13C isotopologues of CCH are equal to those of the normal species. We then used the excitation temperatures of K and K in L1521B and L134N, respectively. J(T) in equation (3) is the effective temperature equivalent to that in the Rayleigh-Jeans law. In equation (4), N denotes the column density, the line width (FWHM), the line strength, the rotational partition function, the permanent electric dipole moment, and the energy of the lower rotational energy level. The permanent electric dipole moment is 0.769 Debye for both the 13C isotopologues (Woon, 1995). Taking into account the evaluation of the Gaussian fitting, we derived the column densities of C13CH from the line of in L1521B and the line of in L134N. In the case of 13CCH, we derived the upper limits of column density from the upper limits of the peak intensities. We used the average line widths of the normal species: 0.42 km s-1 and 0.35 km s-1 in L1521B and L134N, respectively. We summarize the column densities derived in each source in Table 2.
Table 2 summarizes the H2 column density, (H2), at the observed positions. We obtained the (H2) value in L1521B from the fits file of the column density map333Taken from http://www.herschel.fr/cea/gouldbelt/en/Phocea/Vie_des_labos/Ast/ast_visu.php?id_ast=66. The map was made using the Herschel data (70, 160, 250, 350, and 500 m; Palmeirim et al., 2013). We derived the H2 column density in L134N from the archival data of the 1.2 mm dust continuum emission obtained by the MAMBO bolometer array installed on the IRAM 30 m telescope444Taken from http://cdsweb.u-strasbg.fr/cgi-bin/qcat?J/A+A/487/993, using the following formula (Kauffmann et al., 2008):
| (5) |
where is the flux intensity in unit of mJy beam-1. The flux intensity is 17.9 mJy beam-1 at the observed position, and the derived H2 column density is cm-2 using equation (5). The fractional abundances of CCH, (CCH)(CCH)/(H2), are calculated at () and () in L1521B and L134N, respectively.
4 Discussion
4.1 13C Isotopic Fractionation of CCH in L1521B and L134N
In this section, we compare the column densities between the two 13C isotopologues of CCH, namely the fractionation between the two 13C isotopomers, in the observed two starless cores. Because we could not detect 13CCH with an S/N ratio above 3 in the two observed starless cores, we derived lower limits of the (C13CH)/(13CCH) ratio, which are and in L1521B and L134N, respectively555These lower limits have the errors of 0.3, which are derived from the standard deviation of (C13CH).. In both sources, the 13CCH isotopomer is less abundant than the C13CH isotopomer. This result is the same as found for TMC-1 and L1527 by Sakai et al. (2010), where the C13CH/13CCH abundance ratios were derived to be and () respectively. Based on these results, it may be common that 13CCH tends to be less abundant in starless cores.
Two possible mechanisms causing the 13C isotopomer fractionation in CCH have been proposed: fractionation via the formation pathway (Sakai et al., 2010) and via an isotopomer-exchange reaction (Furuya et al., 2011). Sakai et al. (2010) discussed the formation pathways of CCH that could cause its 13C isotopic fractionation. They considered the following three reactions:
| (6) |
| (7) |
and
| (8) |
Among the above three reactions, only reaction (8) is able to cause the 13C isotopic fractionation in CCH, because the two carbon atoms are not clearly equivalent. Hence, Sakai et al. (2010) deduced that the observed differences in the abundances between 13CCH and C13CH would reflect the significant contribution of reaction (8). However, the contributions of each reaction to the overall formation of CCH were not investigated in detail.
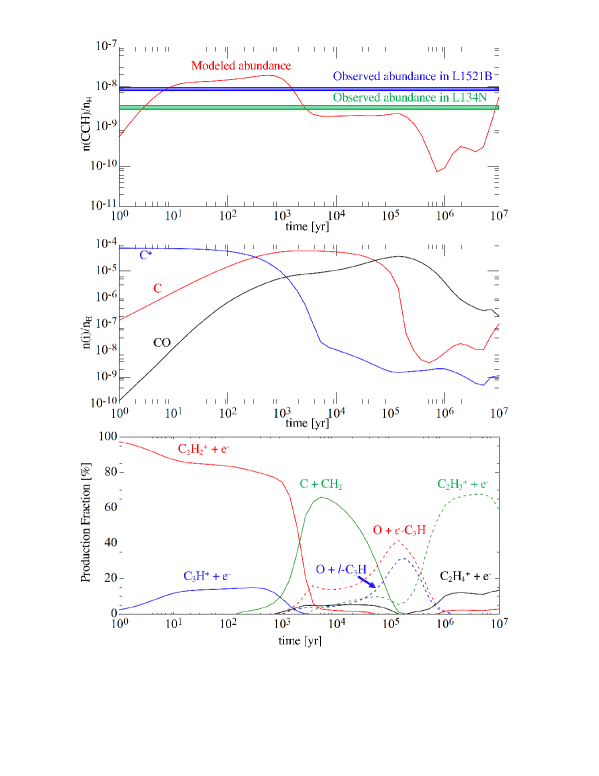
We chose to calculate the contributions of each formation pathway of CCH using the astrochemical code Nautilus (Ruaud et al., 2016). Our model calculation and the reaction network utilized are described in Appendix A. Figure 4 shows the results of the model calculation. The upper panel shows the CCH abundance with respect to total hydrogen as a function of time, as well as horizontal lines for the observed abundances in L1521B and L134N. Given the standard level of agreement between calculated and observed abundances in dark clouds, it can be argued that the modeled abundance shows substantial agreement with the observed abundances in both sources over significant periods of time. In addition, estimates of dark cloud ages based on the agreement between observed and calculated abundances for large numbers of molecular species indicate a much tighter constraint on ages centered on the so-called “early time” of yr (Wakelam et al., 2006).
The lower panel of Figure 4 shows the contribution of each major reaction to the rate of formation of CCH. We exclude reactions which have fractions below 10%. Before yr, reaction (6) is the major formation pathway of CCH. The C2H ion has two equivalent carbon atoms, so this reaction cannot explain the differences in abundances between the two 13C isotopologues of CCH. The following reaction has the second highest contribution in this time range:
| (9) |
The three carbon atoms in C3H+ are not equivalent, and this can explain the 13C isotopic fractionation, unless scrambling of the carbon atoms occurs efficiently during the electron recombination reaction. However, this reaction contributes a significantly smaller amount to the formation of CCH than reaction (6), and we cannot conclude that reaction (9) significantly contributes to the observable 13C isotopic fractionation of CCH. In addition, although unlikely in such a small system, a scrambling of carbon atoms may occur during ion-molecule reaction that produces C3H+ (Taniguchi et al., 2016a). In that case, we would not recognize clear differences in abundances among the 13C isotopologues. The contribution of reaction (9) to the 13C isotopic fractionation of CCH is still unclear.
After yr, reaction (8) has the largest contribution to the formation of CCH. As first explained by Sakai et al. (2010), this reaction can result in 13C fractionation because the carbon atoms are not identical. Another way of looking at the problem is that unless the insertion of a carbon atom into the C-H bond occurs at the same rate as its addition to the C of CH2 and the C atoms can scramble, fractionation will occur. The dominant contribution of reaction (8) extends from somewhat greater than 103 yr to almost 105 yr, which is a much longer period than the time range when reaction (6) is dominant. Moreover, its range of dominance coincides more closely with the age range determined in multi-molecule fits to abundances in dark clouds (Wakelam et al., 2006). This reaction should therefore contribute to the differences in abundances between 13CCH and C13CH, as mentioned before.
Now consider the case of the isotopomer-exchange reaction:
| (10) |
which is exothermic as written from left-to-right so that the net effect is to increase the abundance of the 12C13CH isotopomer at the expense of 13C12CH isotopomer. Furuya et al. (2011) used cm3 s-1 as the rate coefficient of the forward reaction of the isotopomer-exchange reaction in their calculation. They also applied 8.1 K to the zero-point energy difference of 13CCH and C13CH. The efficiency of this process depends upon a number of factors including whether the exothermicity of 8.1 K is sufficient to cause the difference in observed abundance, whether the abundance of atomic hydrogen is large enough, and whether or not a barrier to reaction exists. The differences in abundances between 13CCH and C13CH can be seen even at the early stages (Figure 3 in Furuya et al., 2011). This isotopomer-exchange reaction appears to be able to explain at least partially the 13C isotopic fractionation in both L1521B and L134N.
In summary, we found that C13CH is more abundant than 13CCH in L1521B and L134N from our observations. This tendency agrees with the previous observations in TMC-1 and L1527 (Sakai et al., 2010). The higher abundance of C13CH compared with 13CCH may indeed be common for dark clouds. Both reaction (8) and the isotopomer-exchange reaction likely contribute to the 13C isotopic fractionation of CCH both in L1521B and L134N.
4.2 The Dilution of the 13C Species in Dark Clouds
4.2.1 Comparisons of the 12C/13C Ratios between CCH and HC3N among Dark Clouds
| Species | L1521B | L134N | TMC-1 |
|---|---|---|---|
| 13CCH | aaTaken from Sakai et al. (2010). | ||
| C13CH | aaTaken from Sakai et al. (2010). | ||
| H13CCCN | bbThe errors were calculated from the errors in integrated intensity. We calculated the errors in integrated intensity from the following equation: , where , , and are rms noise level, the number of channel, and the velocity resolution, respectively. | bbTaken from Taniguchi et al. (2017). | ccTaken from Takano et al. (1998). |
| HC13CCN | bbTaken from Taniguchi et al. (2017). | bbTaken from Taniguchi et al. (2017). | ccTaken from Takano et al. (1998). |
| HCC13CN | bbTaken from Taniguchi et al. (2017). | bbTaken from Taniguchi et al. (2017). | ccTaken from Takano et al. (1998). |
It is interesting to compare the 12C/13C ratios of CCH and HC3N among the three dark clouds L1521B, L134N, and TMC-1. Table 3 summarizes the 12C/13C ratios of CCH and HC3N in the three dark clouds and Figure 5 shows the comparisons. In the local interstellar medium, the elemental 12C/13C ratio has been determined to be (e.g., Milam et al., 2005), which we indicate as the yellow range in Figure 5.
From Figure 5, we find that the dilution of the 13C species in carbon-chain molecules holds for the three observed dark clouds. In addition, the 12C/13C ratios of CCH tend to be higher than those of HC3N in all of the dark clouds. It had already been suggested that the degrees of the dilution are different among carbon-chain species in TMC-1 (Taniguchi et al., 2016a). We now can confirm the different degrees of the dilution among the carbon-chain species in the other dark clouds from our observations.
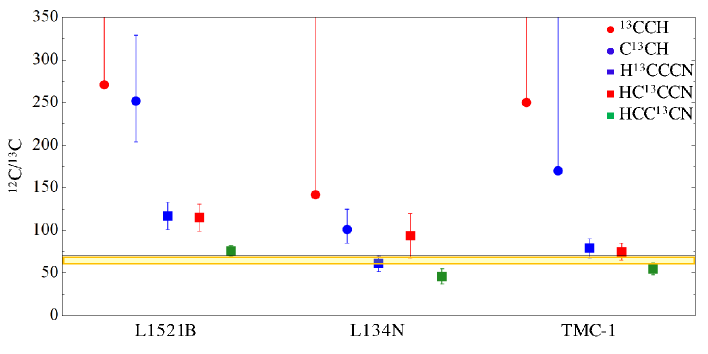
As mentioned in Section 1, the reaction between CCH and HNC was proposed as the main formation pathway of HC3N in L134N (Taniguchi et al., 2017). In this reaction, the carbon atom in HNC attacks the carbon atom with an unpaired electron in CCH forming HC3N via HCCCNH (Fukuzawa & Osamura, 1997). In that case, we can distinguish all the carbon atoms and trace them during the reaction scheme. We would expect that HC3N/HC13CCN is equal to CCH/13CCH and HC3N/H13CCCN is equal to CCH/C13CH. We indicated for the former pair (HC13CCN/HC3N and 13CCH/CCH) with red symbols and for the latter pair with blue symbols in Figure 5. The latter pair agree within their error bars (CCH/C13CH and HC3N/H13CCCN ) taking the errors into consideration. The former pair may marginally lie within the error bars (CCH/13CCH and HC3N/HC13CCN ), taking the error into consideration, but we cannot strongly confirm it due to the non-detection of 13CCH. We need data with higher sensitivity in order to reach this conclusion.
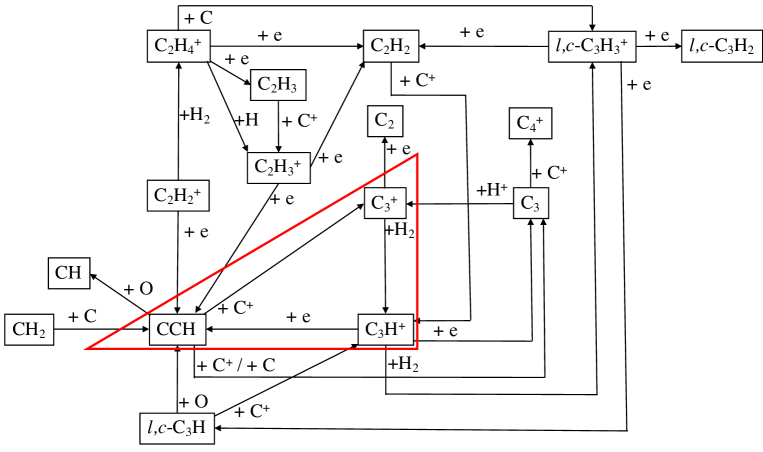
In L1521B and TMC-1, the 12C/13C ratios of CCH are higher than those of HC3N by more than a factor of 2. The reaction between C2H2 and CN was proposed as the main formation pathway of HC3N in both the dark clouds (Takano et al., 1998; Taniguchi et al., 2017), and the carbon atom which is next to the nitrogen atom in HC3N should originate from CN, while the other two carbon atoms in HC3N should come from C2H2 (Fukuzawa & Osamura, 1997). Taking these points into consideration, the 12C/13C ratios of H13CCCN and HC13CCN could reflect those of C2H2. The C2H2 molecule is mainly formed by the electron recombination reaction of C2H, which is formed by the reaction between C2H and H2 (Figure 6). The C2H ion also forms CCH via its electron recombination reaction. Hence, the 12C/13C ratio of C2H2 is expected to be similar to those of CCH, if the 12C/13C ratios are determined during their bottom-up formation from C+ and/or C. However, the observational results show discrepancies in the 12C/13C ratio between CCH and C2H2. This suggests that the different degrees of the dilution of the 13C species are not induced during the carbon-chain growth from C+ and/or C, but during reactions occurring after their production. In the following subsection, we discuss possible routes which could cause the significantly high 12C/13C ratios of CCH, especially at a young dark cloud stage.
4.2.2 Possible Routes to Produce the Significantly High 12C/13C Ratios in CCH
From our model calculation, we uncovered efficient formation and destruction pathways of small hydrocarbons as shown in Figure 6. These pathways were found as we searched for possible routes which cause the high 12C/13C ratio in CCH.
An important cycle, which seems to be efficient in increasing the 12C/13C ratio in CCH in stages as early as yr, is highlighted as a red triangle in Figure 6. In this cycle, more than 80% of CCH is destroyed by the reaction with C+ to form C before yr. CCH is reformed by the reaction of C with H2 followed by the dissociative recombination of C3H+. If 13C+ is diluted due to reaction (1), the 12C/13C ratios of CCH will become higher during the cycle because this cycle involves 13C+. Another possible route to produce the high 12C/13C ratio in CCH involves the following reaction:
| (11) |
The C3H+ product once again reacts dissociatively with electrons to form CCH + C. If the 12C/13C ratio of C3H+ is high, the ratio of CCH also should be high. The following ion-neutral bimolecular reaction could transfer the high 12C/13C ratio to C3H+:
| (12) |
The high 12C/13C ratio of C3H+ may increase the 12C/13C ratio of -C3H. However, most electron recombination reactions of -C3H lead to the formation of -C3H2 and -C3H. In that case, the high 12C/13C ratio of -C3H will not significantly affect the ratio of C2H2. Therefore, the high 12C/13C ratio of C3H+ will not significantly affect the ratio of C2H2, but produce the high ratio of CCH.
Furuya et al. (2011) plotted the temporal variation of the 12C+/13C+ ratio. In fact, this ratio takes extremely high value of around yr with the assumed density of cm-3 (Figure 1 in Furuya et al., 2011). Therefore, there is a possibility that the above reactions cause the significantly high 12C/13C ratios in CCH at an early time.
After yr, the abundance of ionic carbon (C+) rapidly decreases (see the middle panel of Figure 4), and the reactions with C+ are suppressed. In addition, the 12C+/13C+ ratio becomes lower in the later stage (12C+/13C+ at yr; Furuya et al., 2011). Hence, the 12C/13C ratios of CCH would not increase due to the above reactions. These model results may support the lower 12C/13C ratios of CCH in L134N compared to younger clouds of L1521B and TMC-1(Hirota et al., 2004; Dickens et al., 2000; Taniguchi et al., 2017).
Furuya et al. (2011) computed and displayed the temporal variation of the 12C/13C ratio of CCH. The modeled ratio takes its peak value of at a time around yr and quickly decreases to 100 – 60. The predicted peak value is still lower than the observed value in L1521B, and their prediction is not consistent with the observational results quantitatively. However, the observed results that the 12C/13C ratios of CCH in the chemically evolved dark cloud (L134N) are lower compared to the chemically young dark clouds, L1521B and TMC-1, are qualitatively consistent with the simulation (Furuya et al., 2011). As they pointed out, Furuya et al. (2011) may lack some mechanisms which cause the dilution of the 13C species. For example, Furuya et al. (2011) did not take the selective photodissociation into consideration, but it will increase the 12C/13C ratios. If the selective photodissociation of CCH occurs, the 13C isotopologues are destroyed in denser regions where the normal species can survive. CCH seems to be optically thick because the optical thickness of the weakest hyperfine components are around 0.2 in L1521B.
5 Conclusions
We have carried out observations of the transition lines of CCH and its two 13C isotopologues toward two starless cores, L1521B and L134N, using the Nobeyama 45 m radio telescope. The isotopologue of C13CH is detected with an S/N ratio of 4, while the other isotopologue, 13CCH, could not be detected with an S/N ratio above 3. The (C13CH)/(13CCH) ratios are derived to be and in L1521B and L134N, respectively. The characteristic that C13CH is more abundant than 13CCH seems to be common for cold dark clouds. Such a difference in abundances between the two 13C isotopologues, namely the 13C isotopic fractionation, of CCH could be caused during its formation pathway and by the isotopomer-exchange reaction after the molecule is formed.
The derived 12C/13C ratios of CCH in L1521B and L134N are higher than the elemental ratio in the local interstellar medium. We compared the 12C/13C ratios of CCH and HC3N among the three dark clouds. The 12C/13C ratios of CCH are higher than those of HC3N by more than a factor of 2 in L1521B and TMC-1, while the differences in the 12C/13C ratios between CCH and HC3N seem to be smaller in L134N. We discussed possible routes to produce the significantly high 12C/13C ratios only in CCH based on the chemical network simulation. We found a possible cycle which occurs efficiently in the early stage of dark clouds. The previous study shows that the 12C+/13C+ ratio becomes extremely high above 450 in the early time of dark cloud (Furuya et al., 2011). Taking the predicted 12C+/13C+ into account, the 12C/13C ratio of CCH will also become high in the cycle because this cycle involves C+. Besides, the reactions of “C2H2 + C+” and “-C3H + C+” can contribute to the high 12C/13C ratios in CCH.
Appendix A Model Calculation
We calculated the abundance of CCH and the contributions of each formation/destruction pathway using the astrochemical code Nautilus (Ruaud et al., 2016). The initial elemental abundances with respect to total hydrogen are taken from (Acharyya & Herbst, 2017) as summarized in Table 4. Initially, all of hydrogen is the form in H2. The initial form of hydrogen does not affect our discussion. We ran the model calculation including 7646 gas-phase reactions and 498 gas-phase species, mainly taken from the Kinetic Database for Astrochemistry (KIDA)666http://kida.obs.u-bordeaux1.fr. There are 5323 grain-surface reactions and 431 grain-surface species including suprathermal species (Shingledecker & Herbst, 2018). The surface reactions come mainly from Garrod (2013), with additional data taken from Bergantini et al. (2018) and Hudson & Moore (2018). The self shielding effects of H2 (Lee et al., 1996), CO (Visser et al., 2009), and N2 (Li et al., 2013) are included.
The assumed density, gas temperature, visual extinction (), and cosmic-ray ionization rate () are cm-3, 10 K, 10 mag, and s-1, respectively. We assume that the dust temperature is equal to the gas temperature. These values are considered to be the typical values for dark clouds (McElroy et al., 2013).
| Element | Abundance |
|---|---|
| H2 | 0.5 |
| He | 0.09 |
| C+ | |
| N | |
| O | |
| F | |
| Si+ | |
| S+ | |
| Fe+ | |
| Na+ | |
| Mg+ | |
| Cl+ | |
| P+ |
Note. — Taken from the AL model in Acharyya & Herbst (2017).
Appendix B Excitation temperature and optical depth of each hyperfine component
Table 5 summarizes the excitation temperatures and optical depths of CCH of each hyperfine component derived by the RADEX.
| L1521B | L134N | |||||||||
|---|---|---|---|---|---|---|---|---|---|---|
| Line | (K)aa cm-3. | aa cm-3. | (K)bb cm-3. | bb cm-3. | (K)aa cm-3. | aa cm-3. | (K)cc cm-3. | cc cm-3. | ||
| 0.17 | 6.8 | 0.16 | 5.4 | 0.26 | 6.6 | 0.10 | 4.1 | 0.33 | ||
| 1.67 | 6.5 | 0.38 | 5.1 | 0.73 | 6.4 | 0.27 | 4.0 | 1.30 | ||
| 0.83 | 6.3 | 0.27 | 4.9 | 0.52 | 6.3 | 0.20 | 3.8 | 0.95 | ||
| 0.83 | 6.2 | 0.40 | 5.0 | 0.75 | 6.1 | 0.27 | 3.9 | 1.21 | ||
| 0.33 | 6.3 | 0.29 | 5.0 | 0.51 | 6.2 | 0.17 | 3.9 | 0.70 | ||
| 0.17 | 6.5 | 0.20 | 5.3 | 0.33 | 6.3 | 0.13 | 4.1 | 0.41 | ||
References
- Acharyya & Herbst (2017) Acharyya, K., & Herbst, E. 2017, ApJ, 850, 105
- Bergantini et al. (2018) Bergantini, A., Góbi, S., Abplanalp, M. J., & Kaiser, R. I. 2018, ApJ, 852, 70
- Burkhardt et al. (2018) Burkhardt, A. M., Herbst, E., Kalenskii, S. V., et al. 2018, MNRAS, 474, 5068
- Dickens et al. (2000) Dickens, J. E., Irvine, W. M., Snell, R. L., et al. 2000, ApJ, 542, 870
- Fukuzawa & Osamura (1997) Fukuzawa, K., & Osamura, Y. 1997, ApJ, 489, 113
- Furuya et al. (2011) Furuya, K., Aikawa, Y., Sakai, N., & Yamamoto, S. 2011, ApJ, 731, 38
- Garrod (2013) Garrod, R. T. 2013, ApJ, 765, 60
- Hassel et al. (2008) Hassel, G. E., Herbst, E., & Garrod, R. T. 2008, ApJ, 681, 1385
- Hirota et al. (2004) Hirota, T., Maezawa, H., & Yamamoto, S. 2004, ApJ, 617, 399
- Hirota et al. (1998) Hirota, T., Yamamoto, S., Mikami, H., & Ohishi, M. 1998, ApJ, 503, 717
- Hudson & Moore (2018) Hudson, R. L., & Moore, M. H. 2018, ApJ, 857, 89
- Kaifu et al. (2004) Kaifu, N., Ohishi, M., Kawaguchi, K., et al. 2004, PASJ, 56, 69
- Kauffmann et al. (2008) Kauffmann, J., Bertoldi, F., Bourke, T. L., Evans, N. J., II, & Lee, C. W. 2008, A&A, 487, 993
- Kauffmann et al. (2017) Kauffmann, J., Goldsmith, P. F., Melnick, G., et al. 2017, A&A, 605, L5
- Langer et al. (1984) Langer, W. D., Graedel, T. E., Frerking, M. A., & Armentrout, P. B. 1984, ApJ, 277, 581
- Lee et al. (1996) Lee, H.-H., Herbst, E., Pineau des Forets, G., Roueff, E., & Le Bourlot, J. 1996, A&A, 311, 690
- Li et al. (2013) Li, X., Heays, A. N., Visser, R., et al. 2013, A&A, 555, A14
- McElroy et al. (2013) McElroy, D., Walsh, C., Markwick, A. J., et al. 2013, A&A, 550, A36
- Milam et al. (2005) Milam, S. N., Savage, C., Brewster, M. A., Ziurys, L. M., & Wyckoff, S. 2005, ApJ, 634, 1126
- Müller et al. (2005) Müller, H. S. P., Schlöder, F., Stutzki, J., & Winnewisser, G. 2005, Journal of Molecular Structure, 742, 215
- Padovani et al. (2009) Padovani, M., Walmsley, C. M., Tafalla, M., et al. 2009, A&A, 505, 1199
- Palmeirim et al. (2013) Palmeirim, P., André, P., Kirk, J., et al. 2013, A&A, 550, A38
- Ruaud et al. (2016) Ruaud, M., Wakelam, V., & Hersant, F. 2016, MNRAS, 459, 3756
- Sakai et al. (2007) Sakai, N., Ikeda, M., Morita, M., et al. 2007, ApJ, 663, 1174
- Sakai et al. (2013) Sakai, N., Takano, S., Sakai, T., et al. 2013, Journal of Physical Chemistry A, 117, 9831
- Sakai et al. (2010) Sakai, N., Saruwatari, O., Sakai, T., Takano, S., & Yamamoto, S. 2010, A&A, 512, A31
- Sakai & Yamamoto (2013) Sakai, N., & Yamamoto, S. 2013, Chemical Reviews, 113, 8981
- Shingledecker & Herbst (2018) Shingledecker, C. N., & Herbst, E. 2018, Physical Chemistry Chemical Physics (Incorporating Faraday Transactions), 20, 5359
- Spielfiedel et al. (2012) Spielfiedel, A., Feautrier, N., Najar, F., et al. 2012, MNRAS, 421, 1891
- Suzuki et al. (1992) Suzuki, H., Yamamoto, S., Ohishi, M., et al. 1992, ApJ, 392, 551
- Takano et al. (1998) Takano, S., Masuda, A., Hirahara, Y., et al. 1998, A&A, 329, 1156
- Takano et al. (1990) Takano, S., Suzuki, H., Ohishi, M., et al. 1990, ApJ, 361, L15
- Taniguchi et al. (2019a) Taniguchi, K., Herbst, E., Caselli, P., et al. 2019a, arXiv e-prints, arXiv:1906.11296
- Taniguchi et al. (2017) Taniguchi, K., Ozeki, H., & Saito, M. 2017, ApJ, 846, 46
- Taniguchi et al. (2016a) Taniguchi, K., Ozeki, H., Saito, M., et al. 2016a, ApJ, 817, 147
- Taniguchi & Saito (2017) Taniguchi, K., & Saito, M. 2017, PASJ, 69, L7
- Taniguchi et al. (2016b) Taniguchi, K., Saito, M., & Ozeki, H. 2016b, ApJ, 830, 106
- Taniguchi et al. (2018) Taniguchi, K., Saito, M., Sridharan, T. K., & Minamidani, T. 2018, ApJ, 854, 133
- Taniguchi et al. (2019b) Taniguchi, K., Saito, M., Sridharan, T. K., & Minamidani, T. 2019b, ApJ, 872, 154
- van der Tak et al. (2007) van der Tak, F. F. S., Black, J. H., Schöier, F. L., Jansen, D. J., & van Dishoeck, E. F. 2007, A&A, 468, 627
- Visser et al. (2009) Visser, R., van Dishoeck, E. F., & Black, J. H. 2009, A&A, 503, 323
- Wakelam et al. (2006) Wakelam, V., Herbst, ER., & Selsis, F. 2006, A&A, 451, 551
- Woon (1995) Woon, D. E. 1995, Chemical Physics Letters, 244, 45