Anisotropic strain effects in small-twist-angle graphene on graphite
Abstract
The direct experimental probing of locally varying lattice parameters and anisotropic lattice deformations in atomic multilayers is extremely challenging. Here, we develop a new combined numerical/graphical method for the analysis of irregular moiré superstructures measured by scanning tunneling microscopy (STM) on a small-twist-angle (0.6∘) graphene on highly oriented pyrolytic graphite (gr/HOPG). We observe distorted moiré patterns with a spatially varying period in annealed gr/HOPG. The nanoscale modulation of the moiré period observed by STM reflects a locally strained (and sheared) graphene with anisotropic variation of the lattice parameters. We use a specific algorithm based on a rigid lattice Fourier method, which is able to reconstruct the irregular and distorted moiré patterns emerging from strain induced lattice deformations. Our model is universal and can be used to study different moiré patterns occurring in two-dimensional van der Waals heterostructures. Additionally, room temperature scanning tunneling spectroscopy measurements show electronic states at the Dirac point, localized on moiré hills, which increase significantly the apparent corrugation of the moiré pattern. The measured topography is compared to classical molecular dynamics simulations. Density functional theory (DFT) calculations confirm that an AAB stacked trilayer region itself can contribute electronic states near the Fermi-level, in agreement with the measured peak in the local density of states. Furthermore CMD calculations reveal direction dependent bond alternations (0.5%) around the stacking regions, induced by shear strain, which could influence electronic properties.
I Introduction
Graphene and other two-dimensional (2D) materials are intensively studied from the perspective of building new van der Waals heterostructures Novoselov et al. (2016) by stacking one layer on top of the other Ponomarenko et al. (2011); Haigh et al. (2012); Britnell et al. (2012); Dean et al. (2012); Georgiou et al. (2013). The resulting new materials can reveal unusual properties and new phenomena Geim and Grigorieva (2013); Withers et al. (2015); He et al. (2014); Fogler et al. (2014); Lin et al. (2015). Therefore it is important to understand the interaction between stacked 2D layers and to study the resulting electronic properties. Already the interaction between two superimposed graphene layers implies rich physics and determines the properties of the stacked system Li et al. (2010); Luican et al. (2011); Yan et al. (2012); Ohta et al. (2012). Moiré patterns can appear when two similar crystalline layers are superimposed, with a spatial period depending on the misfit and the rotation angle between the lattice parameters of the two layers Zeller and Günther (2014). This moiré superstructure introduces not only a slight geometric corrugation in graphene, but also modulates the local density of states (DOS) Li et al. (2010); Luican et al. (2011); Yan et al. (2012). It was also shown that a moiré pattern can act as a perturbative periodic potential which induces secondary Dirac points in the graphene band structure Wallbank et al. (2013); Yan et al. (2013); Yankowitz et al. (2012). Graphene layers superimposed with small twist angle (1∘) are of peculiar interest due to the decreased Fermi velocity and charge localization Trambly de Laissardiere et al. (2010a), the emergence of flat electronic bands Morell et al. (2010); Bistritzer and MacDonald (2011a); Kim et al. (2017), and also due to the role of electron-electron interaction Kim et al. (2017). Recently, unconventional superconductivity and correlated insulator behavior was revealed for twist angles of around 1.1∘ Cao et al. (2018a, b). Furthermore, geometric and electronic effects induced by heterostrain in twisted graphene layers near this magic angle were reported very recently Qiao et al. (2018); Huder et al. (2018).
In this paper we investigate a small-twist-angle graphene on highly oriented pyrolytic graphite (HOPG) by scanning tunneling microscopy (STM) and show that the measured moiré superstructure reflects a locally strained graphene with anisotropic variations of the lattice parameter. Owing to the magnifying property of the moiré pattern, the system is perfectly suitable for studying strain effects and deformations. In theory, as the lattice mismatch and the twist angle between two adjacent layers tend to zero, the moiré wavelength tends to infinity, meaning that atomic scale deformations can be observed on the 10-100 nm scale moiré patterns. Indeed, this phenomenon is visible in our STM results, as the measured moiré becomes progressively irregular in one region of the sample (Fig. 1a). This is possible because in the measured system both magnifying criteria are fulfilled: the lattice mismatch is very small, and the twist angle is below 1∘.
In addition, we show that the corrugation of the observed moiré pattern depends on the bias voltage used. Scanning tunneling spectroscopy (STS) measurements reveal a local DOS peak at the Dirac point, which is localized at the protruding sites of the moiré pattern. This induces increased moiré corrugation when imaging at a bias voltage close to the Dirac point (electronic effect). The results may have implications in the nanoscale engineering of the atomic and electronic properties of graphene and graphene based van der Waals heterostructures.
The paper is organized as follows. In Sec. II we summarize the experimental details of sample preparation as well as the applied density functional theory (DFT) methodology. The STM results and their interpretation is presented in Sec. III A, while in Sec. III B we provide a model to reconstruct the observed distorted patterns. In Sec. III C we discuss the charge localization observed at the moiré protrusions, which is the main reason for the measured large apparent corrugation. We compare the results with DFT calculations performed on AAB stacked trilayer graphene and a small-twist-angle moiré coincident cell. In Sec. III D we provide classical molecular dynamics (CMD) simulations for the observed small-twist-angle graphene on graphite system. The geometric corrugation obtained from simulations is compared to the experimental STM topography data. Finally, the conclusions are presented in Sec. IV.
II Methods
Graphene grown by chemical vapor deposition on copper foil Pálinkás et al. (2016) was transferred onto HOPG substrate using thermal release tape (TRT). An etchant mixture consisting of CuCl2 aqueous solution (20%) and hydrochloric acid (37%) in 4:1 volume ratio was used to etch the copper foil. After etching, the TRT/graphene was rinsed in distilled water, then dried and pressed onto freshly cleaved HOPG. The TRT/graphene/HOPG stack was placed on a hot plate and heated to 100∘C, above the release temperature (90∘C) of the TRT. Thus, after one minute the TRT was easily removed, leaving behind the graphene on top of the HOPG. The sample was annealed at 650∘C in argon atmosphere for two hours, in order to remove residual contaminations from the TRT and to improve the adhesion of graphene to the HOPG. The graphene/HOPG system was investigated by STM and STS, using a DI Nanoscope E operating under ambient conditions. The STM measurements were performed in constant current mode.
DFT methodology: We used different levels of theroretical DFT methods for the simple trilayer graphene (TLG) calculations, and for the large scale calculation (commensurate moiré coincidence bilayer supercell including 33076 atoms).
a) For the AAB-TLG and ABA-TLG calculations (150 atoms/unit cell, aligned layers, zero twist) the accurate self-consistent DFT/GGA(PBE) method has been used used (Monkhorts-Pack 51x51x1, DZP numerical basis set, 300 Ry mesh cutoff, self-consistent field (SCF) tolerance is set to , SIESTA code Soler et al. (2002)). The periodic geometry of the ABA and AAB structures have been optimized by a conjugate gradient (cg) minimizer together with a supercell relaxation (variable cell method).
b) For the commensurate moiré coincidence bilayer (MCB) unit cell the non-self-consistent DFT/Harris functional (real space mesh cutoff 150 Ry Soler et al. (2002)) has been used with a single k-point (-point calculation), which is sufficient for such a large system in which the Brillouin-zone and the reciprocal lattice become extremly small. This approach includes a single matrix diagonalization with fully calculated DFT matrix elements which provide the necessary eigenvalues for DOS calculation. The calculation of the projected DOS is extremely time-consuming for the MCB system, therefore we calculated only the total DOS, which is adequately informative on the features near the Fermi level. In both cases (a-b) the periodic superlattice structures have been pre-optimized (relaxed) using classical molecular statics (lammps code Plimpton (1995), see section III D). We used the lcbop/Kolgomorov-Crespi-z (lcbop/KC) hybrid potential Los and Fasolino (2003); Kolmogorov and Crespi (2005) which includes the necessary van der Waals interaction term via the KC potential. The lcbop potential accurately describes graphitic systems in the planes and the inter-plane interaction has been simulated by the KC force-field (cohesive energy is in the range of a few tens of meV/C atom).
III Results
III.1 STM investigation of small-twist-angle graphene on HOPG
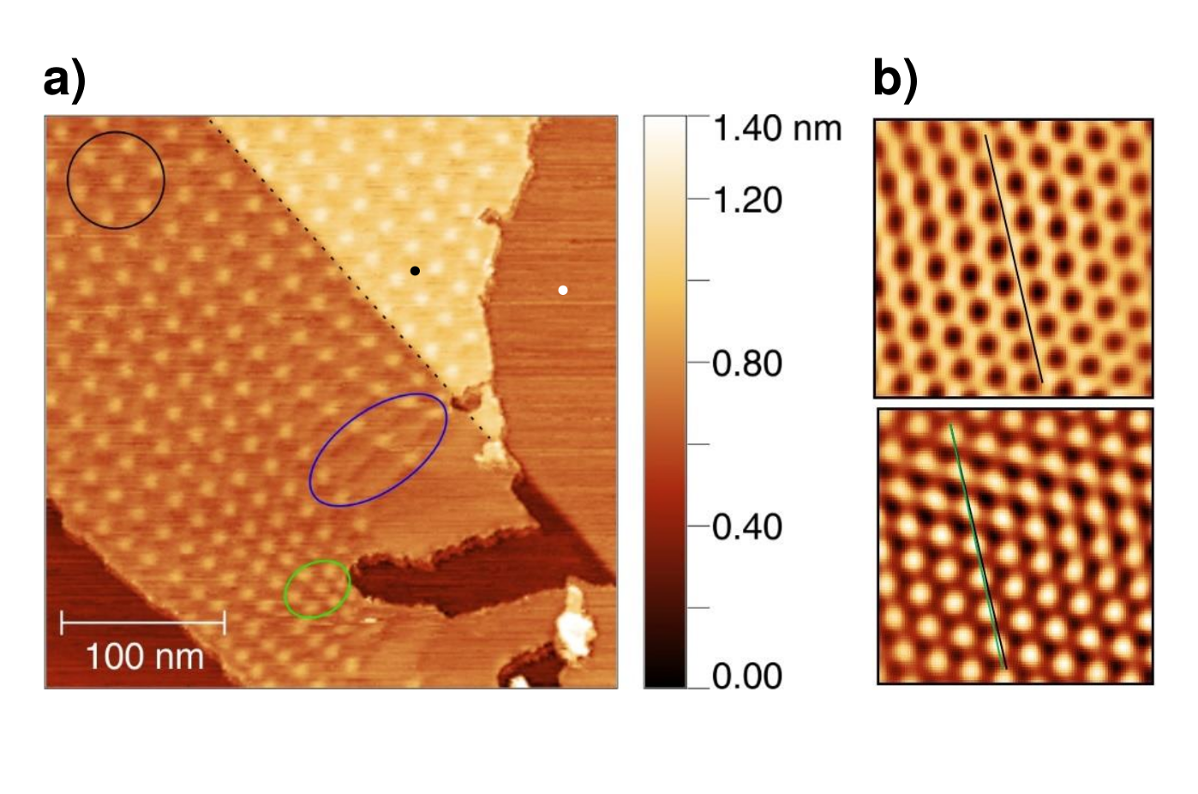
An STM image of a graphene flake transferred onto HOPG is shown in Fig. 1 a. The graphene passes over an atomic step of HOPG, which is marked with dashed line. A prominent feature of the STM image is the observed moiré pattern, the periodicity of which is around 22 nm (black circle) in most graphene areas. According to the formula used for rotated graphene layers Beyer et al. (1999); Hermann (2012), where = 0.246 nm is the graphene lattice constant, such a moiré period forms at a twist angle of =0.64∘. Experimentally, we observe that the zig-zag orientations of graphene are nearly parallel with the zig-zag orientations of the HOPG substrate (Fig. 1 b), which is in very good agreement with the above small twist angle. As one notices in Fig. 1 a, the moiré periodicity is position dependent. There are areas where it decreases to 11-12 nm (green ellipse), and also where increases up to 52 nm (blue ellipse). This increase (decrease) is anisotropic, it occurs predominantly in one direction. Note that although the graphene edges have a shadow image due to a double STM tip, the moiré parameters are not affected (see Supplemental Material 49 (49), Fig. S1).”
III.2 Reconstruction of the distorted moiré patterns using a rigid lattice Fourier method
In order to better understand the observed anisotropy, we developed a rigid lattice Fourier method (RLFM) to visualize the dependence of the moiré pattern on the spatial distribution of the graphene lattice constants. A model of a spatially varying anisotropic Moiré pattern can be found in Qiao et al. (2018). In their model the Authors used uniaxial strain with a varying twist angle as an approximation to heterostrain in a very specific setup. In our case, however, we have a random strain field, that arised from the transfer and annealing of the graphene layer. Therefore our model had to be very general. It can be used with any kind of lattices, with any type of strains, and can handle arbitrary lattice parameter gradients (see Fig. 2 b) through our graphical method (see later). In the following we describe our model in detail.
A regular moiré pattern () can be defined by its Fourier-serie:
| (1) |
where are the reciprocal Moiré-vectors. We call the trigonal pattern isotropic when the angle between the reciprocal moiré vectors is 120∘ and their length is the same. Deviations from these criteria make the pattern anisotropic. On a larger scale, , can have spatial dependence , , in which case we call the pattern to be irregular. The real space moiré vectors corresponding to are labeled . According to Ref. Hermann, 2012, the linear transformation between and the graphene lattice vectors , is:
| (2) |
As Eq. 2 shows, any anisotropy in the graphene lattice induces anisotropy also in the moiré pattern. In the work of Hermann Hermann (2012), the theory is restricted to the case when anisotropy comes only from the length differences between , . There, the angle between graphene lattice vectors and the angle between the substrate (HOPG) lattice vectors were considered to be the same (), meaning that the author restricted the theory only to the cases where the same type of lattices are put above each other (e.g: hexagonal on hexagonal, rectangular on rectangular etc.). Here, however, we wanted to fully capture the anisotropic effects, therefore we allowed and to be different. Taking this into account we recalculated the matrix , which was found to be:
| (3) |
where is:
| (4) |
, , and and is the twist angle between the graphene and the HOPG. We assume that there are no irregularities in the substrate, i.e. every deformation comes from the graphene (see Supplemental Material 49 (49), Fig. S2). Thus, are the known equilibrium lattice vectors of graphite, and . Next, we consider the graphene lattice vectors as slowly varying, continuous functions of space: , . In this continuum model of graphene we have a well-defined lattice parameter in every point of the (x,y) plane. If and are known, one can construct the moiré vectors , using Eq. 2. Then, the moiré vectors are transformed to reciprocal space to get , and the model moiré pattern is obtained by building up the Fourier-serie of Eq. 1. The simplest moiré contains six Fourier-components with equal coefficients.
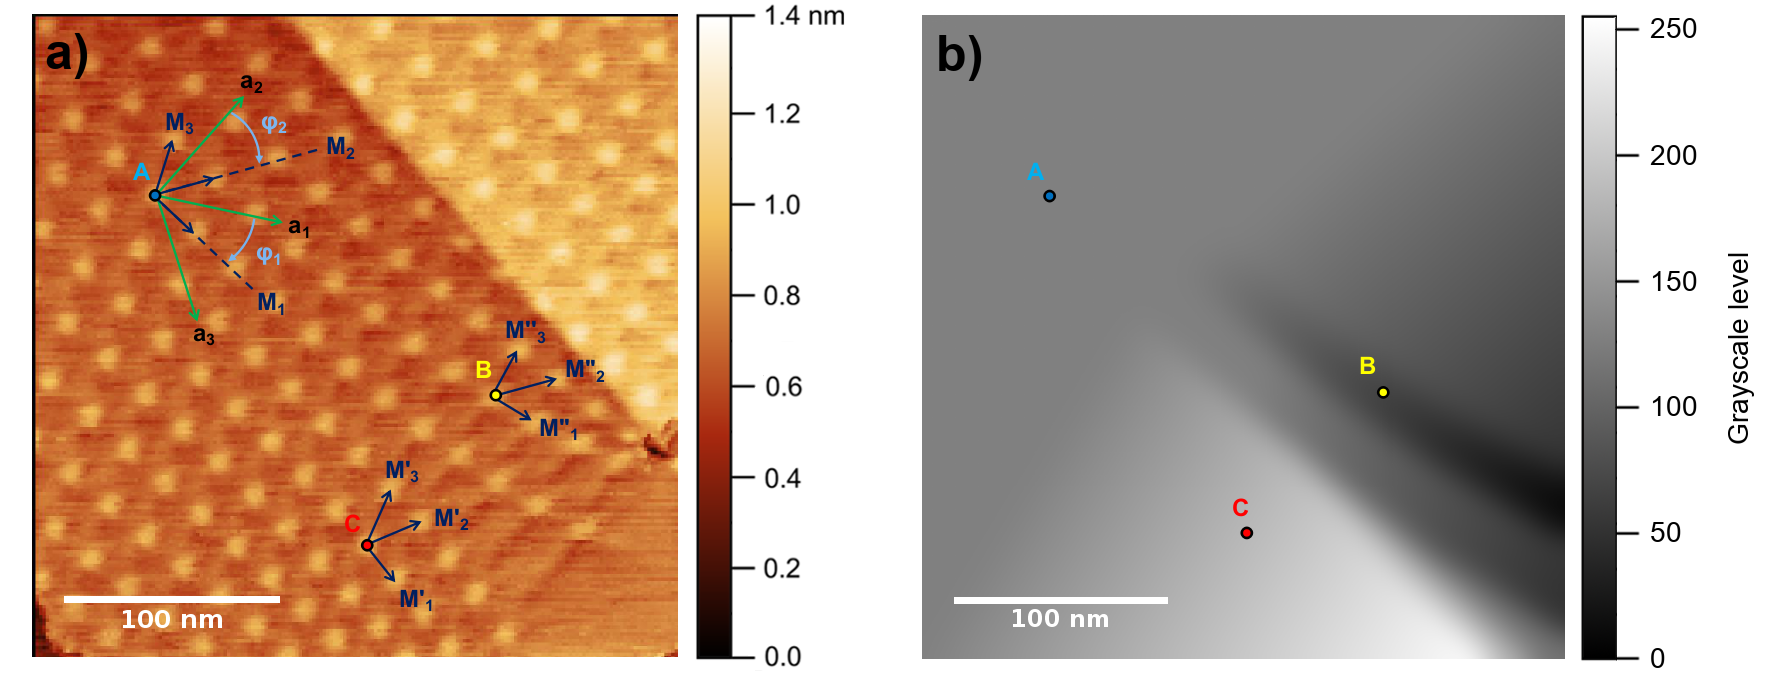
The matrix depends on the twist angle , which cannot be extracted directly from STM experiments. The measurable quantities which provide input for our model are the moiré wavelengths in different directions, and the moiré angle, , measured between the graphene zig-zag direction and the direction determined by neighboring moiré bumps. Furthermore, the moiré pattern is very sensitive on the parameter. It cannot be measured accurately enough from STM images, therefore we consider also an unknown parameter. To get around this problem of unknown parameters we implemented the least square fitting algorithm of Powell Powell (1964). The fitting parameters were , (the length of the graphene lattice parameters), , . The fitting data were the moiré wavelengths , , , and two moiré angles (Fig. 2 a) (hereinafter moiré parameters). These quantities can be calculated from the vectors for a particular set of , , , (hereinafter graphene parameters), which can be fitted onto the measured data.
| A | B | C | ||||
| STM | fit | STM | fit | STM | fit | |
| - | 2.461 | - | 2.467 | - | 2.461 | |
| - | 2.458 | - | 2.457 | - | 2.459 | |
| - | 2.459 | - | 2.459 | - | 2.455 | |
| - | 59.99 | - | 59.93 | - | 59.87 | |
| - | 0.59 | - | 0.62 | - | 0.72 | |
| 231 | 230.92 | 220 | 218.42 | 228 | 229.89 | |
| 225 | 225.03 | 195 | 194.87 | 187 | 185.66 | |
| 252 | 252.04 | 270 | 271.34 | 224 | 222.32 | |
| 28 | 28.29 | 20 | 18.71 | 35 | 35.46 | |
| 31 | 30.71 | 32 | 25.81 | 21 | 27.41 | |
In particular, we measured the moiré parameters in three different locations marked with in the STM topography image of Fig. 2 a. The three locations were chosen to capture the basic irregularity of the moiré pattern: the bending of the moiré rows in opposite directions. In the pattern is slightly anisotropic, but it is regular. As one goes along a straight path from to , the pattern is rotating with a positive angle, while it is rotating with negative angle through a path from to . This makes the pattern highly irregular in the region between and .
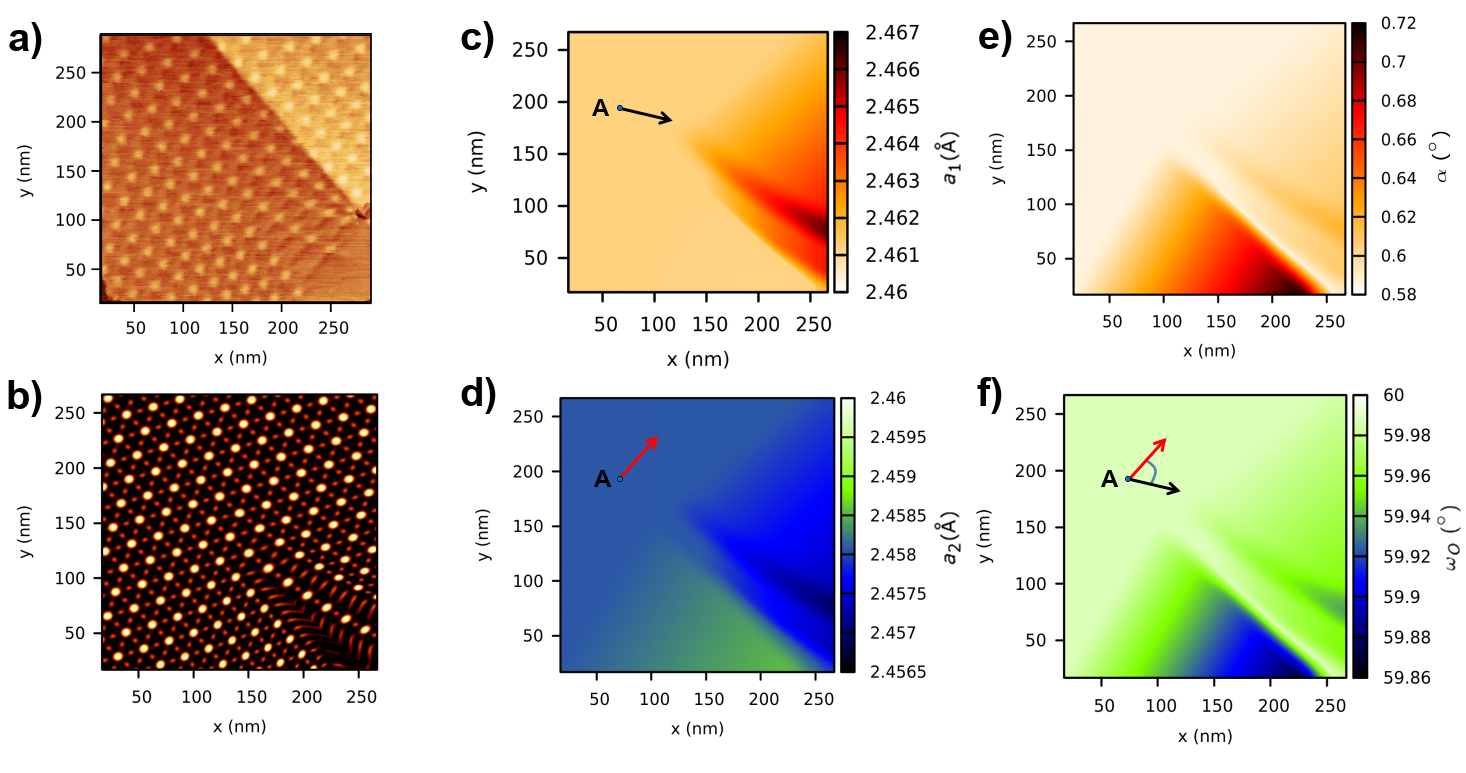
Once the moiré parameters are known, the graphene parameters are fitted in each location. Then, the spatial dependence of these graphene parameters has to be built. If these are known, and and can be formulated, and the anisotropic, irregular moiré pattern model can be visualized. Our approach here was the following: a grayscale spatial map was generated using gradient tools in a graphic editor software (Fig. 2 b), and in a separate step, linear interpolation was used in our developed code to assign every grayscale level of the pixels a graphene parameter value, such that the fitted values in the points were preserved. In this way we were able to conjecture the spatial distribution of the graphene parameters, i.e. the distortion in the graphene lattice. As an approximation, we used the same grayscale map for each graphene parameter (with different parameter-grayscale-level interpolation), meaning that we assumed the same basic spatial distribution for the lattice parameters and for the twist angle. The moiré pattern was then constructed from using Eq. 1. The next step was to manually fine-tune the grayscale map in a trial and error manner by comparing the simulated moiré pattern with the STM image until a high level of agreement was attained. The simulated moiré pattern is shown in Fig. 3 b. As a result of our model the deformation of the graphene is revealed in details in Fig. 3 c-f.
It can be seen that the deformations of the lattice parameters are highly anisotropic (Fig. 3 c-d). For example, between points and , there is a contraction of 0.21% in , but a dilatation of 0.27% in . We were able to determine the spatial dependence of the twist angle (Fig. 3 e), which is not a trivial task for irregular and anisotropic patterns. For an isotropic and regular moiré pattern with wavelength of 22.2 nm the twist angle is 0.64∘ in equilibrium. We found slightly different values in points , , and , namely 0.58∘, 0.62∘, and 0.72∘, respectively. The deviations from the equilibrium value are clearly very small, however they represent a crucial factor in the deformation of the moiré pattern. Because of the strong magnifying property in this special system, very small changes in the graphene parameters induce prominent effects on the scale of tens of nanometers. To illustrate this, we recalculated the whole moiré pattern by changing in the points and by a small amount, but keeping the other graphene parameters at their fitted value. A change of only 0.1∘ in the twist angle resulted in a deflection of the moiré rows by 8∘, which is a significant effect. A similar sensitivity is true for as well. We found that is slightly less than 60∘: 59.98∘, 59.93∘, and and 59.86∘ in the points , , and , respectively. If was 60∘, as it would be in graphene without shear deformation, the deflection of moiré rows would change by 7∘. This clearly shows the sensitivity of the moiré pattern on the graphene parameters. The calculated graphene parameters for the points , , and are summarized in Table 1, were additionally, the calculated moiré parameters are compared with the measured ones. The observed deformations and deviations from equilibrium values are ascribed to local strain and twist inhomogenity in graphene, probably induced during annealing.
III.3 Charge localization on moiré hills
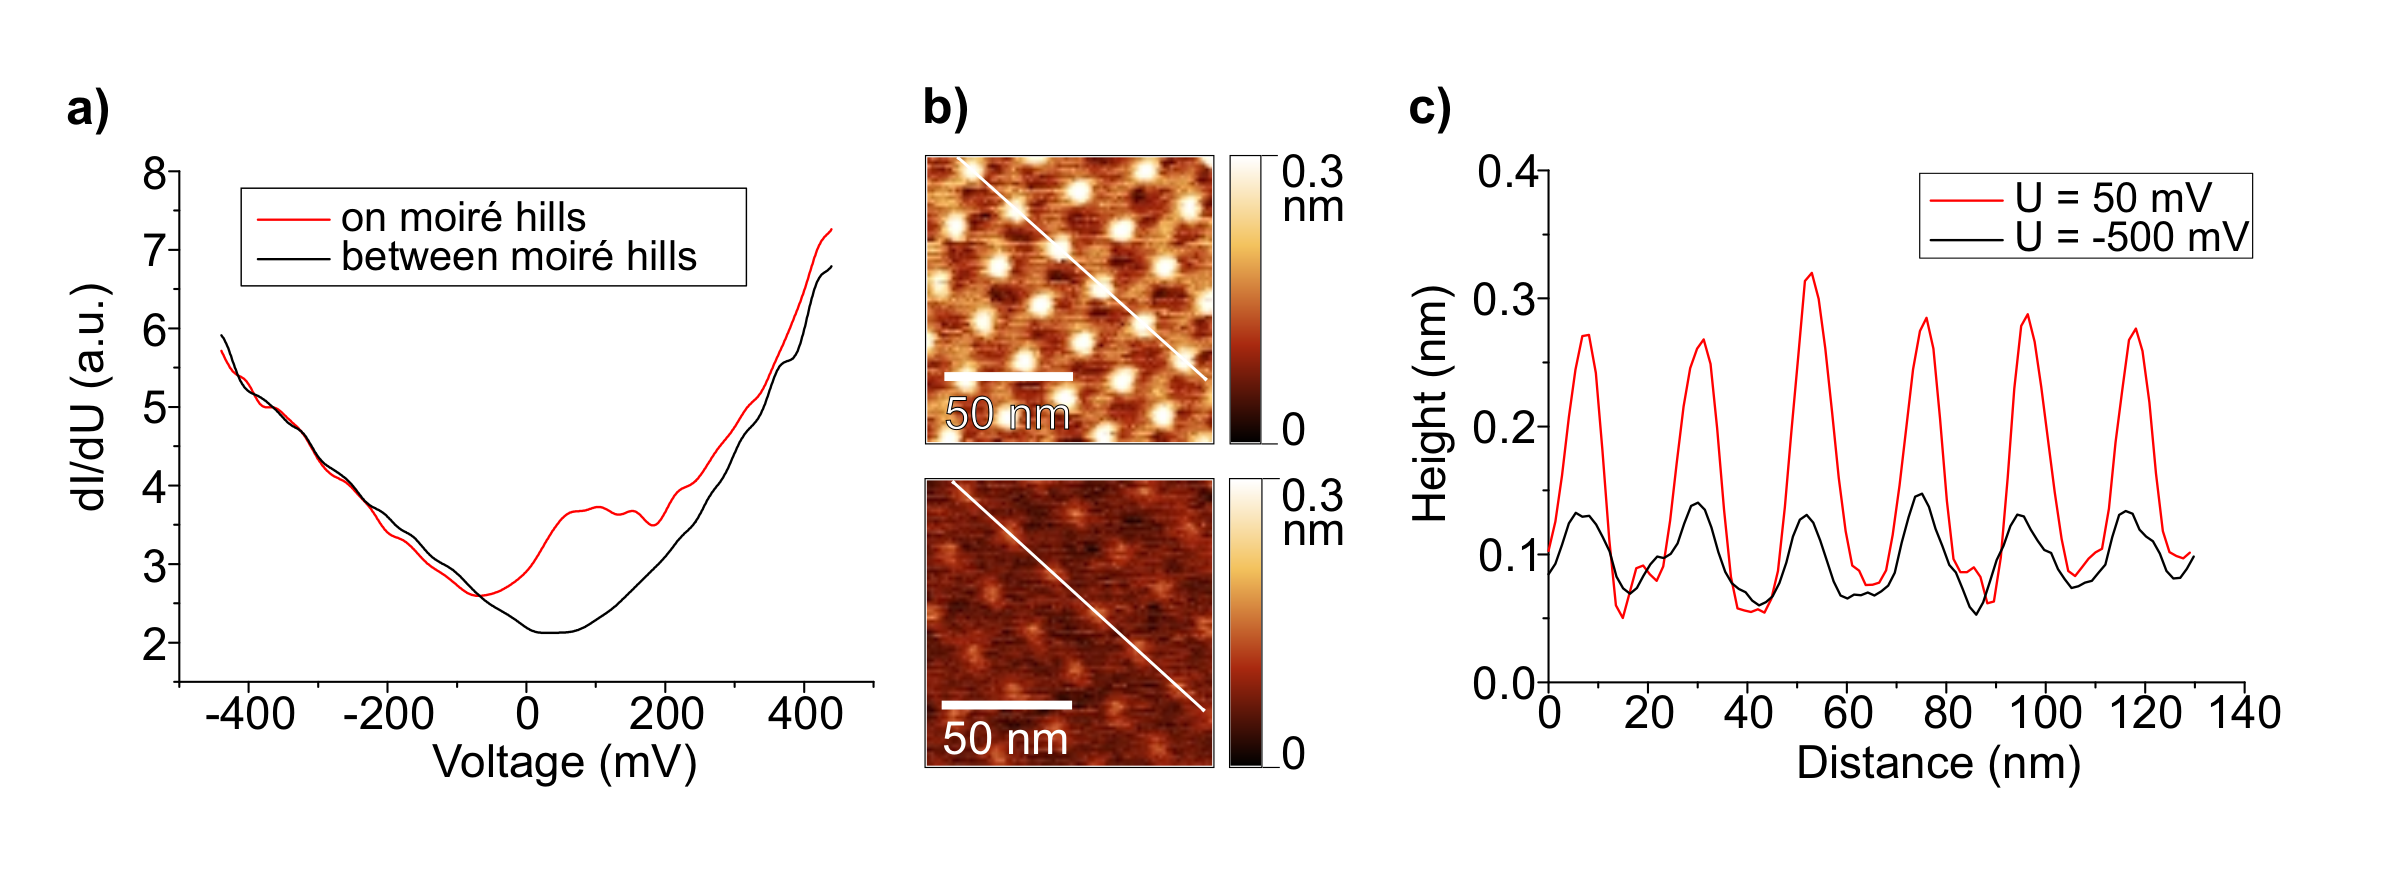
In the following, we will study the local DOS of graphene. STS measurements were performed far from edges, on a graphene part with regular moiré pattern (Fig. 4 a). The dI/dU spectra show a slightly p-doped graphene with the Dirac point at 50 mV, as observed from the spectrum measured in a moiré valley (black line). In contrast with this typical graphene-like spectrum, the dI/dU measured on moiré hills reveal significantly higher local DOS near the Dirac point. Such peak localization can be induced by the moiré potential Trambly de Laissardiere et al. (2010b); dos Santos et al. (2012), and was observed in low temperature STM/STS measurements of twisted graphene layers with small angle Brihuega et al. (2012); Huder et al. (2018). We note that at such low twist angle the moiré induced van Hove singularities are very close to each other Brihuega et al. (2012) and they are not resolved anymore, as the Fermi velocity tends to zero Trambly de Laissardiere et al. (2010b).
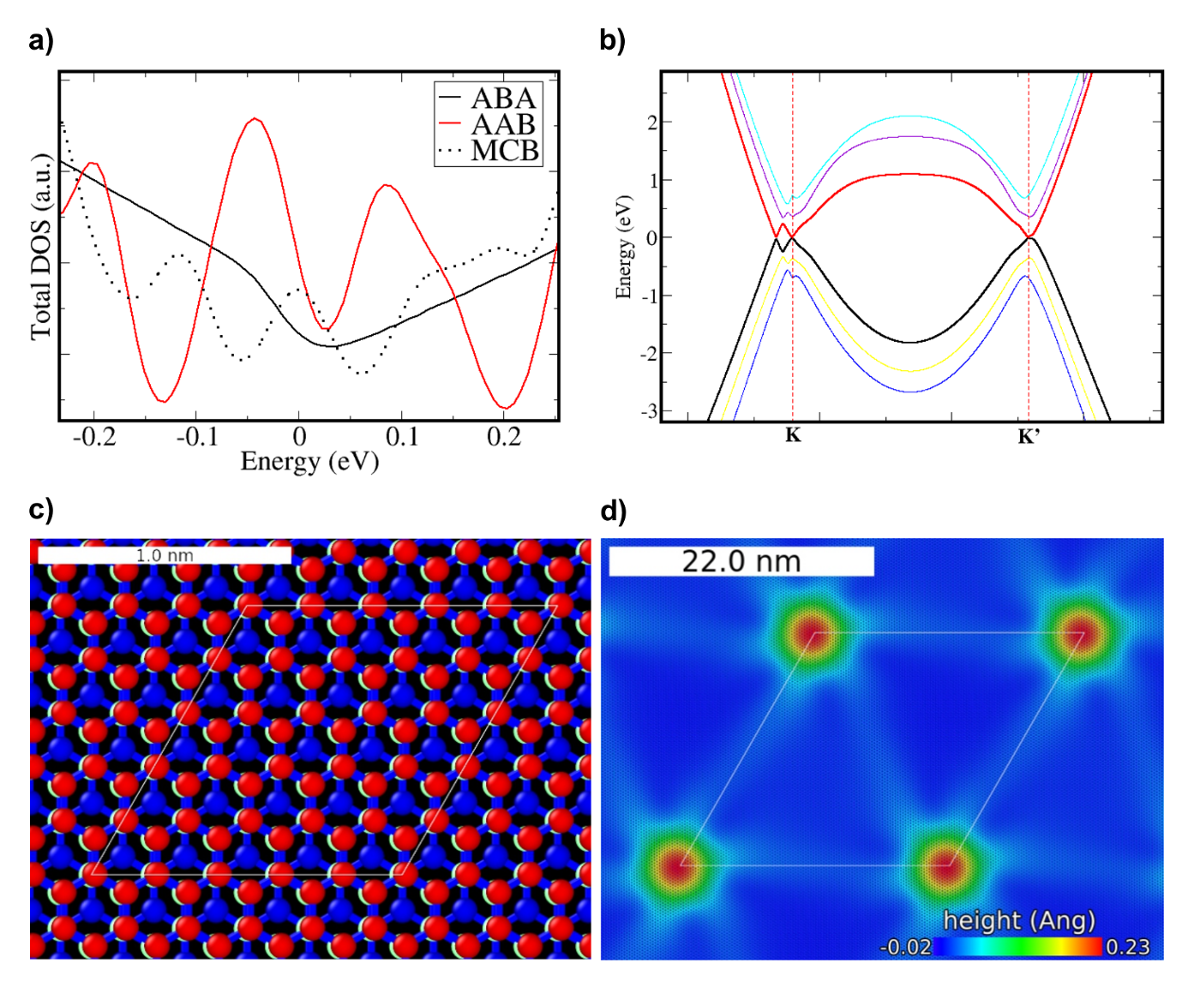
In order to understand in more detail the observed local DOS peak, DFT calculations have been carried out for CMD pre-optimized TLG supercells with AAB and ABA stackings, which take into account also the uppermost two layers of the HOPG substrate. Full self-consistency calculations performed on AAB-TLG supercell resulted in a band structure as shown in Fig. 5b. The corresponding DOS calculations (Fig. 5 a, red) show a double-peak feature near the Dirac point. Such two-peak DOS structure is expected to occur at twist angles below 1∘ from continuum model calculations as well dos Santos et al. (2012). Here, a Gaussian broadening of 0.04 eV was used to account for the room temperature used in the STS experiments, which actually smears the double-peak feature. Note that the DOS of ABA-TLG is featureless near the Fermi energy (Fig. 5 a, black). These results capture very well the peak localization in the AA stacked regions and are in good agreement with the measurements, although the peak splitting is not well resolved by room temperature STS (Fig. 4a).
In addition, we performed also a constrained, Harris-functional-like DFT calculation for the full CMD pre-optimized commensurate MCB supercell, including 33076 atoms at 0.63∘ twist angle (Fig. 5 d). In this case a single diagonalization of the Hamiltonian provides us the eigenvalues for total DOS calculation. This approach goes beyond the level of simple (even DFT fitted) tight-binding methods since the DFT matrix elements are calculated at first-principles level. The obtained DOS (Fig. 5 a, dashed line) is comparable with the more accurate DFT calculations of the AAB-TLG supercell. We find that the MCB supercell gives a sharp single peak at the Fermi level, in agreement with the flat band reported for small-angle twisted graphene bilayers dos Santos et al. (2012); Bistritzer and MacDonald (2011b). No peak splitting occurs for the MCB commensurate supercell at 0.63∘ twist angle, which could be related to the mixed effect of differently stacked regions. The detailed analysis of the MCB DOS spectral features goes, however, beyond the scope of the present article. STM simulation of the MCB supercell is challenging as the non-self-consistent Harris charge density yields poor surface energies Read and Needs (1989), and the available basis set for such calculation is short ranged Soler et al. (2002). Thus, the simulated STM images lack of sufficient contrast to display the moiré pattern and the associated small charge density modulations.
The apparent corrugation of the moiré pattern depends strongly on the bias voltage (U) used in the STM measurements. This effect is clearly observed in Fig. 4 b, where the moiré hills appear significantly much brighter at U=50 mV (top panel) than at U=-500 mV (bottom panel). Note that the vertical scale is the same in the two images. Line profiles taken through the same bumps (marked with white lines) reveal that the moiré hills are 2-3 times higher for U=50 mV (Fig. 4 c). This dependence of the apparent height on the bias voltage is closely related to the localized DOS peak, which contributes significantly to the tunneling current. Hence, at U=50 mV the STM tip has larger upwards (z) movements in order to keep the current constant when scanning the moiré hills. In turn, at U=-500 mV the local DOS of moiré hills and valleys is similar, therefore the electronic contribution to the measured corrugation is less significant, and the z-movement of the STM tip can be attributed mainly to the geometric corrugation.
III.4 CMD simulations of small-twist-angle graphene on HOPG
In order to support these findings, we carried out classical molecular dynamics simulations of a small-twist-angle graphene/HOPG system with regular and isotropic moiré pattern. For this purpose, we used a commensurate supercell, which was selected in a manner to approach the experimental moiré parameters and twist angle. This supercell is a graphene HOPG structure, which was obtained by iterating through highly ordered commensurate cells as described in Refs Merino et al., 2011; Meng et al., 2012. The cell has a twist angle of 0.63∘, a moiré wavelength of 22.37 nm, and a moiré angle of 29.68∘. The CMD simulation was implemented in the LAMMPS code Plimpton (1995).
CMD simulations for bilayer graphene can be found in the literature Van Wijk et al. (2015); Jain et al. (2016); Gargiulo and Yazyev (2017), and also for graphene on graphite Van Wijk et al. (2015). In the latter case only one rigid layer of graphene was used to mimic the substrate. However, at least a third layer should be considered as it is necessary to reproduce the proper stackings (, , ) occurring in the Moiré-pattern of a gr/HOPG system. In STM measurements the effect of the third layer is not negligible Yao et al. (2017) (although it is mainly an electronic effect). Therefore we placed the graphene above a thick HOPG substrate, which consists of 22 carbon layers. The long range bond order potential was utilized Los and Fasolino (2003) for carbon-carbon interactions within a single carbon layer. The weak van der Walls forces between the carbon layers were modeled using the Kolmogorov-Crespi potential Kolmogorov and Crespi (2005). We performed geometry relaxation using the FIRE algorithm.
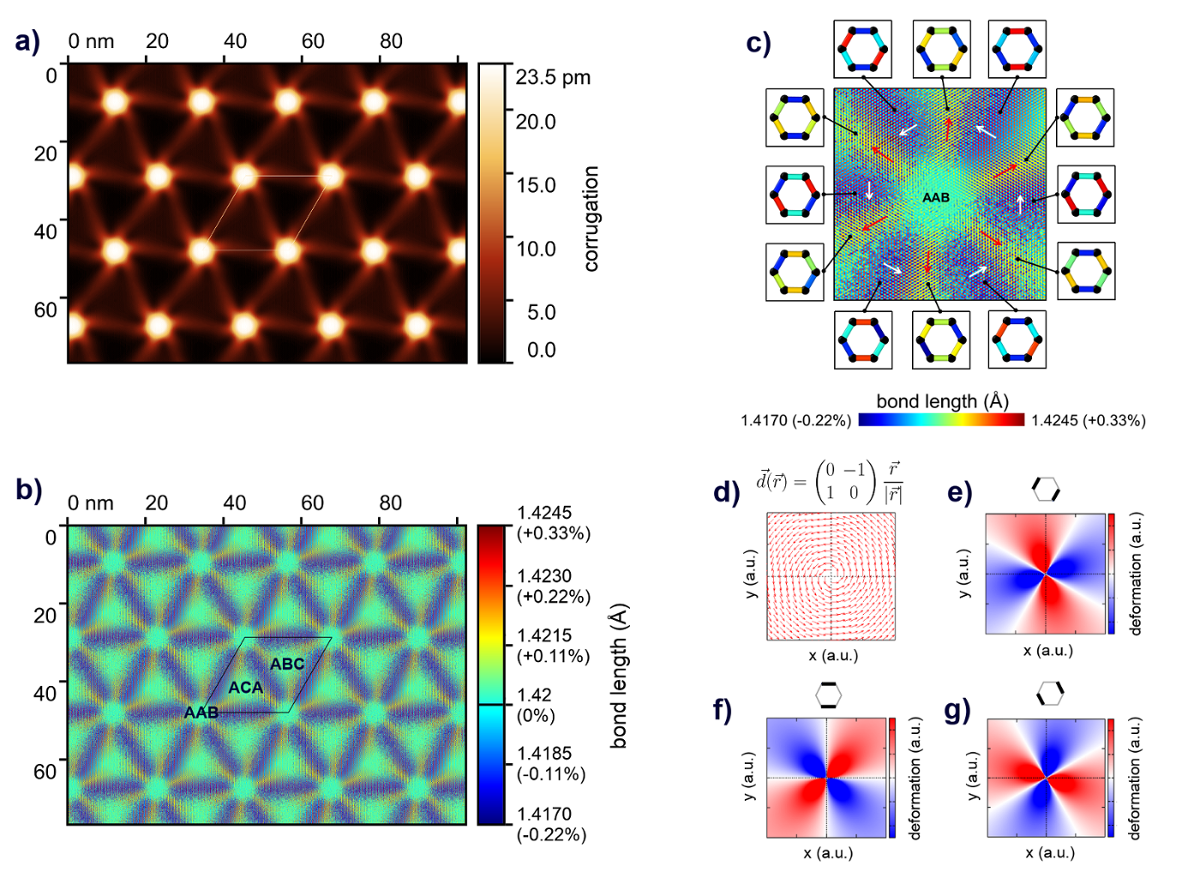
The resulting topography of the graphene sheet is shown in Fig. 6 a. The maximal geometric corrugation induced by the moiré pattern obtained from CMD is 0.23 Å. This is even smaller than the corrugation of the experimentally found moiré pattern measured at U=-500 mV (0.6 – 0.8 Å, Fig. 4 c). The combination of the often-used carbon potentials (lcbop, rebo, airebo) with the Kolmogorov-Crespi potential might underestimate somewhat the corrugation Van Wijk et al. (2015). However, the correction stemming from this underestimation does not compensate for the measured large apparent height. In light of this, the large apparent height of the moiré hills measured at U=50 mV can only be understood by taking into account significant electronic effects, as described above.
The carbon-carbon bond length distribution in the optimized moiré supercell (see Fig. 6 b) shows that the local strain is between -0.22% and +0.33%. The color coded pattern reveals some fine details of the moiré superlattice. The pattern consists of three green spots and two types of interconnections between them: a purple and a yellow one (Fig. 6 b). The green spots are the different stacking regions (, , ) having nearly equilibrium bond length (1.42 Å), inferring a period of in the bond length distribution. Due to the local twisting of the top graphene layer around the stacking regions Van Wijk et al. (2015); Jain et al. (2016); Dai et al. (2016); Gargiulo and Yazyev (2017), there is a spatially changing local shear around them, which manifests in rich bond alternations (Fig. 6 c). The most pronounced bond alternations occur in the purple areas which interconnect the regions. These regions appear purple because they are mixed up with red (dilated) and blue (contracted) bonds (Fig. 6 b-c). It can be easily seen that these regions coincide with the so-called soliton walls visible on the CMD simulated topography (Fig. 6 a), previously reported in twisted bilayer graphene Alden et al. (2013). The yellow areas connect different stackings: the with .
In Fig. 6 c) we analyzed the fine details of the bond alternations around the stacking. The nine colored hexagons show how the graphene lattice is deformed in average in that particular region. In each interconnection a major zig-zag direction can always be identified, where the bond alternation effect is the strongest. We indicated these major directions with white and red arrows in Fig. 6 c. In the case of purple interconnections it turned out that the main direction for the bond alternation is the zig-zag direction perpendicular to the soliton wall (white arrows). In contrast, for the yellow interconnections the major direction is parallel with the interconnection itself (red arrows). The twisting displacement field around the stacking has the property that it deforms the least those bonds that are either parallel (light green bonds in yellow interconnections) or perpendicular (light blue bonds in purple interconnections) to the local displacement field. We depicted this in Fig. 6 d-g), where we showed how the bonds in specific directions would deform in a very simple analytic homogeneous twisting diplacement field (see Fig. 6 d)). Although this is an oversimplification as the real field has a radial dependence and the displacements are not necessarily perpendicular to the position vectors of the carbon atoms Gargiulo and Yazyev (2017), it gives a very good insight what actually happens with the bonds. The two-fold symmetry observed in Fig. 6 e-g) is modulated on a larger scale by the six-fold symmetry of the Moiré-pattern (Fig. 6 b-c). The bond pattern in Fig. 6 c) has a point reflection symmetry around the AAB stacking. Such a specific lattice arrangement could influence the electronic properties through pesudo-magnetic fields as the hoppings are having a very unique directional feature. If this twisting deformation could be enhanced with external techniques up to the critical shear strain ( 17%) for gap opening, it could lead to direction dependent gaps, meaning that in a well set configuration the graphene would conduct electrons only between certain stackings, that could lead to localization effects and flat-band physics independently of the magic-angle.
IV Conclusion
Small-twist-angle graphene on HOPG has been studied both experimentally and theoretically. The moiré superlattices observed by STM reflected a locally strained graphene with anisotropic variations of the lattice parameter. We developed a combined graphical-numerical method in order to evaluate the deformations that resulted in these distorted moiré patterns. As a result of our new approach the spatial dependence of the anisotropic deformations was revealed in unprecedented detail: not only the anisotropic moiré pattern could be reproduced, but also the local values of () could be accurately calculated. The sensitivity of the moiré pattern on the variation of graphene parameters was also demonstrated. Additionally, a local DOS peak at the Dirac point was observed, localized at the protruding sites of the moiré pattern, which resulted in a significant increase of the apparent moiré corrugation. These findings were supported by classical molecular dynamics simulations, which also revealed rich bond alternation patterns around the stackings, induced by shear strain, which could have interesting applications in the future of strain engineering. DFT calculations confirmed that the measured local DOS peak can be attributed to stacked trilayer regions in small-twist-angle gr/HOPG systems. The results may have implications in the nanoscale strain engineering of the atomic and electronic properties of graphene based van der Waals heterostructures.
ACKNOWLEDGMENTS
We acknowledge financial support from the National Research, Development and Innovation Office (NKFIH) through the OTKA Grants K-119532 and KH-129587, as well as from the Korea-Hungary Joint Laboratory for Nanosciences.
References
- Novoselov et al. (2016) KS Novoselov, A Mishchenko, A Carvalho, and AH Castro Neto, “2D materials and van der Waals heterostructures,” Science 353, aac9439 (2016).
- Ponomarenko et al. (2011) LA Ponomarenko, AK Geim, AA Zhukov, R Jalil, SV Morozov, KS Novoselov, IV Grigorieva, EH Hill, VV Cheianov, VI Fal’Ko, et al., “Tunable metal–insulator transition in double-layer graphene heterostructures,” Nature Physics 7, 958 (2011).
- Haigh et al. (2012) SJ Haigh, A Gholinia, R Jalil, S Romani, L Britnell, DC Elias, KS Novoselov, LA Ponomarenko, AK Geim, and R Gorbachev, “Cross-sectional imaging of individual layers and buried interfaces of graphene-based heterostructures and superlattices,” Nature Materials 11, 764 (2012).
- Britnell et al. (2012) L Britnell, RV Gorbachev, R Jalil, BD Belle, F Schedin, A Mishchenko, T Georgiou, MI Katsnelson, L Eaves, SV Morozov, et al., “Field-effect tunneling transistor based on vertical graphene heterostructures,” Science 335, 947–950 (2012).
- Dean et al. (2012) C Dean, AF Young, L Wang, I Meric, G-H Lee, K Watanabe, T Taniguchi, K Shepard, P Kim, and J Hone, “Graphene based heterostructures,” Solid State Communications 152, 1275–1282 (2012).
- Georgiou et al. (2013) Thanasis Georgiou, Rashid Jalil, Branson D Belle, Liam Britnell, Roman V Gorbachev, Sergey V Morozov, Yong-Jin Kim, Ali Gholinia, Sarah J Haigh, Oleg Makarovsky, et al., “Vertical field-effect transistor based on graphene–WS 2 heterostructures for flexible and transparent electronics,” Nature Nanotechnology 8, 100 (2013).
- Geim and Grigorieva (2013) Andre K Geim and Irina V Grigorieva, “Van der Waals heterostructures,” Nature 499, 419 (2013).
- Withers et al. (2015) F Withers, O Del Pozo-Zamudio, A Mishchenko, AP Rooney, A Gholinia, K Watanabe, T Taniguchi, SJ Haigh, AK Geim, AI Tartakovskii, et al., “Light-emitting diodes by band-structure engineering in van der Waals heterostructures,” Nature Materials 14, 301 (2015).
- He et al. (2014) Jiaqi He, Nardeep Kumar, Matthew Z Bellus, Hsin-Ying Chiu, Dawei He, Yongsheng Wang, and Hui Zhao, “Electron transfer and coupling in graphene–tungsten disulfide van der Waals heterostructures,” Nature Communications 5, 5622 (2014).
- Fogler et al. (2014) MM Fogler, LV Butov, and KS Novoselov, “High-temperature superfluidity with indirect excitons in van der Waals heterostructures,” Nature Communications 5, 4555 (2014).
- Lin et al. (2015) Yu-Chuan Lin, Ram Krishna Ghosh, Rafik Addou, Ning Lu, Sarah M Eichfeld, Hui Zhu, Ming-Yang Li, Xin Peng, Moon J Kim, Lain-Jong Li, et al., “Atomically thin resonant tunnel diodes built from synthetic van der Waals heterostructures,” Nature Communications 6, 7311 (2015).
- Li et al. (2010) Guohong Li, A Luican, JMB Lopes Dos Santos, AH Castro Neto, A Reina, J Kong, and EY Andrei, “Observation of Van Hove singularities in twisted graphene layers,” Nature Physics 6, 109 (2010).
- Luican et al. (2011) A Luican, Guohong Li, A Reina, J Kong, RR Nair, Konstantin S Novoselov, Andre K Geim, and EY Andrei, “Single-layer behavior and its breakdown in twisted graphene layers,” Physical Review Letters 106, 126802 (2011).
- Yan et al. (2012) Wei Yan, Mengxi Liu, Rui-Fen Dou, Lan Meng, Lei Feng, Zhao-Dong Chu, Yanfeng Zhang, Zhongfan Liu, Jia-Cai Nie, and Lin He, “Angle-dependent van Hove singularities in a slightly twisted graphene bilayer,” Physical Review Letters 109, 126801 (2012).
- Ohta et al. (2012) Taisuke Ohta, Jeremy T Robinson, Peter J Feibelman, Aaron Bostwick, Eli Rotenberg, and Thomas E Beechem, “Evidence for interlayer coupling and moiré periodic potentials in twisted bilayer graphene,” Physical Review Letters 109, 186807 (2012).
- Zeller and Günther (2014) Patrick Zeller and Sebastian Günther, “What are the possible moiré patterns of graphene on hexagonally packed surfaces? universal solution for hexagonal coincidence lattices, derived by a geometric construction,” New Journal of Physics 16, 083028 (2014).
- Wallbank et al. (2013) JR Wallbank, AA Patel, M Mucha-Kruczyński, AK Geim, and VI Fal’ko, “Generic miniband structure of graphene on a hexagonal substrate,” Physical Review B 87, 245408 (2013).
- Yan et al. (2013) Hui Yan, Zhao-Dong Chu, Wei Yan, Mengxi Liu, Lan Meng, Mudan Yang, Yide Fan, Jiang Wang, Rui-Fen Dou, Yanfeng Zhang, et al., “Superlattice Dirac points and space-dependent Fermi velocity in a corrugated graphene monolayer,” Physical Review B 87, 075405 (2013).
- Yankowitz et al. (2012) Matthew Yankowitz, Jiamin Xue, Daniel Cormode, Javier D Sanchez-Yamagishi, K Watanabe, T Taniguchi, Pablo Jarillo-Herrero, Philippe Jacquod, and Brian J LeRoy, “Emergence of superlattice Dirac points in graphene on hexagonal boron nitride,” Nature Physics 8, 382 (2012).
- Trambly de Laissardiere et al. (2010a) G Trambly de Laissardiere, Didier Mayou, and Laurence Magaud, “Localization of Dirac electrons in rotated graphene bilayers,” Nano Letters 10, 804–808 (2010a).
- Morell et al. (2010) E Suárez Morell, JD Correa, P Vargas, M Pacheco, and Z Barticevic, “Flat bands in slightly twisted bilayer graphene: Tight-binding calculations,” Physical Review B 82, 121407 (2010).
- Bistritzer and MacDonald (2011a) Rafi Bistritzer and Allan H MacDonald, “Moiré bands in twisted double-layer graphene,” Proceedings of the National Academy of Sciences 108, 12233–12237 (2011a).
- Kim et al. (2017) Kyounghwan Kim, Ashley DaSilva, Shengqiang Huang, Babak Fallahazad, Stefano Larentis, Takashi Taniguchi, Kenji Watanabe, Brian J LeRoy, Allan H MacDonald, and Emanuel Tutuc, “Tunable moiré bands and strong correlations in small-twist-angle bilayer graphene,” Proceedings of the National Academy of Sciences , 201620140 (2017).
- Cao et al. (2018a) Yuan Cao, Valla Fatemi, Shiang Fang, Kenji Watanabe, Takashi Taniguchi, Efthimios Kaxiras, and Pablo Jarillo-Herrero, “Unconventional superconductivity in magic-angle graphene superlattices,” Nature 556, 43 (2018a).
- Cao et al. (2018b) Yuan Cao, Valla Fatemi, Ahmet Demir, Shiang Fang, Spencer L Tomarken, Jason Y Luo, Javier D Sanchez-Yamagishi, Kenji Watanabe, Takashi Taniguchi, Efthimios Kaxiras, et al., “Correlated insulator behaviour at half-filling in magic-angle graphene superlattices,” Nature 556, 80 (2018b).
- Qiao et al. (2018) Jia-Bin Qiao, Long-Jing Yin, and Lin He, “Twisted graphene bilayer around the first magic angle engineered by heterostrain,” Physical Review B 98, 235402 (2018).
- Huder et al. (2018) Loïc Huder, Alexandre Artaud, Toai Le Quang, Guy Trambly de Laissardiere, Aloysius GM Jansen, Gérard Lapertot, Claude Chapelier, and Vincent T Renard, “Electronic spectrum of twisted graphene layers under heterostrain,” Physical Review Letters 120, 156405 (2018).
- Pálinkás et al. (2016) András Pálinkás, Péter Süle, Márton Szendrő, György Molnár, Chanyong Hwang, László P Biró, and Zoltán Osváth, “Moiré superlattices in strained graphene-gold hybrid nanostructures,” Carbon 107, 792–799 (2016).
- Soler et al. (2002) José M Soler, Emilio Artacho, Julian D Gale, Alberto García, Javier Junquera, Pablo Ordejón, and Daniel Sánchez-Portal, “The SIESTA method for ab initio order-N materials simulation,” Journal of Physics: Condensed Matter 14, 2745 (2002).
- Plimpton (1995) Steve Plimpton, “Fast parallel algorithms for short-range molecular dynamics,” Journal of Computational Physics 117, 1–19 (1995).
- Los and Fasolino (2003) JH Los and A Fasolino, “Intrinsic long-range bond-order potential for carbon: Performance in Monte Carlo simulations of graphitization,” Physical Review B 68, 024107 (2003).
- Kolmogorov and Crespi (2005) Aleksey N Kolmogorov and Vincent H Crespi, “Registry-dependent interlayer potential for graphitic systems,” Physical Review B 71, 235415 (2005).
- Beyer et al. (1999) H Beyer, M Müller, and Th Schimmel, “Monolayers of graphite rotated by a defined angle: hexagonal superstructures by STM,” Applied Physics A: Materials Science & Processing 68, 163–166 (1999).
- Hermann (2012) Klaus Hermann, “Periodic overlayers and moiré patterns: theoretical studies of geometric properties,” Journal of Physics: Condensed Matter 24, 314210 (2012).
- (35) “See supplemental material at http://link.aps.org/ for more information on the stm tip used and the origin of strain.” .
- Powell (1964) Michael JD Powell, “An efficient method for finding the minimum of a function of several variables without calculating derivatives,” The Computer Journal 7, 155–162 (1964).
- Trambly de Laissardiere et al. (2010b) G Trambly de Laissardiere, Didier Mayou, and Laurence Magaud, “Localization of Dirac electrons in rotated graphene bilayers,” Nano Letters 10, 804–808 (2010b).
- dos Santos et al. (2012) JMB Lopes dos Santos, NMR Peres, and AH Castro Neto, “Continuum model of the twisted graphene bilayer,” Physical Review B 86, 155449 (2012).
- Brihuega et al. (2012) I Brihuega, Pierre Mallet, H González-Herrero, G Trambly de Laissardière, MM Ugeda, Laurence Magaud, JM Gómez-Rodríguez, F Ynduráin, and J-Y Veuillen, “Unraveling the intrinsic and robust nature of van Hove singularities in twisted bilayer graphene by scanning tunneling microscopy and theoretical analysis,” Physical Review Letters 109, 196802 (2012).
- Bistritzer and MacDonald (2011b) Rafi Bistritzer and Allan H MacDonald, “Moiré bands in twisted double-layer graphene,” Proceedings of the National Academy of Sciences 108, 12233–12237 (2011b).
- Read and Needs (1989) AJ Read and RJ Needs, “Tests of the Harris energy functional,” Journal of Physics: Condensed Matter 1, 7565 (1989).
- Merino et al. (2011) Pablo Merino, Martin Svec, Anna L Pinardi, Gonzalo Otero, and Jose A Martin-Gago, “Strain-driven moiré superstructures of epitaxial graphene on transition metal surfaces,” ACS Nano 5, 5627–5634 (2011).
- Meng et al. (2012) Lei Meng, Rongting Wu, Lizhi Zhang, Linfei Li, Shixuan Du, Yeliang Wang, and HJ Gao, “Multi-oriented moiré superstructures of graphene on Ir (111): experimental observations and theoretical models,” Journal of Physics: Condensed Matter 24, 314214 (2012).
- Van Wijk et al. (2015) MM Van Wijk, A Schuring, MI Katsnelson, and A Fasolino, “Relaxation of moiré patterns for slightly misaligned identical lattices: graphene on graphite,” 2D Materials 2, 034010 (2015).
- Jain et al. (2016) Sandeep K Jain, Vladimir Juričić, and Gerard T Barkema, “Structure of twisted and buckled bilayer graphene,” 2D Materials 4, 015018 (2016).
- Gargiulo and Yazyev (2017) Fernando Gargiulo and Oleg V Yazyev, “Structural and electronic transformation in low-angle twisted bilayer graphene,” 2D Materials 5, 015019 (2017).
- Yao et al. (2017) Qirong Yao, Rik Van Bremen, Guus J Slotman, Lijie Zhang, Sebastiaan Haartsen, Kai Sotthewes, Pantelis Bampoulis, Paul L De Boeij, Arie Van Houselt, Shengjun Yuan, et al., “Spatially resolved electronic structure of twisted graphene,” Physical Review B 95, 245116 (2017).
- Dai et al. (2016) Shuyang Dai, Yang Xiang, and David J Srolovitz, “Twisted bilayer graphene: Moiré with a twist,” Nano Letters 16, 5923–5927 (2016).
- Alden et al. (2013) Jonathan S Alden, Adam W Tsen, Pinshane Y Huang, Robert Hovden, Lola Brown, Jiwoong Park, David A Muller, and Paul L McEuen, “Strain solitons and topological defects in bilayer graphene,” Proceedings of the National Academy of Sciences 110, 11256–11260 (2013).