Multi-wavelength observations of protoplanetary discs as a proxy for the gas disc mass
Abstract
Recent observations of protoplanetary discs reveal disc substructures potentially caused by embedded planets. We investigate how the gas surface density in discs changes the observed morphology in scattered light and dust continuum emission. Assuming that disc substructures are due to embedded protoplanets, we combine hydrodynamical modelling with radiative transfer simulations of dusty protoplanetary discs hosting planets. The response of different dust species to the gravitational perturbation induced by a planet depends on the drag stopping time — a function of the generally unknown local gas density. Small dust grains, being stuck to the gas, show spirals. Larger grains decouple, showing progressively more axisymmetric (ring-like) substructure as decoupling increases with grain size or with the inverse of the gas disc mass. We show that simultaneous modelling of scattered light and dust continuum emission is able to constrain the Stokes number, . Hence, if the dust properties are known, this constrains the local gas surface density, , at the location of the structure, and hence the total gas mass. In particular, we found that observing ring-like structures in mm-emitting grains requires and therefore . We apply this idea to observed protoplanetary discs showing substructures both in scattered light and in the dust continuum.
keywords:
protoplanetary discs — planets and satellites : formation — hydrodynamics — methods: numerical — dust, extinction1 Introduction
The exceptional imaging capabilities of new instruments such as the Spectro-Polarimetric High-contrast Exoplanet REsearch (SPHERE) imager at the Very Large Telescope and observatories like the Atacama Large Millimeter Array (ALMA) offer exciting new possibilities to explore the dynamics of the two main components of protoplanetary discs: gas and dust. High-resolution observations at a wide range of wavelengths have revealed disc substructures. These substructures are common, as a result of ubiquitous processes in disc evolution (Garufi et al., 2018). Importantly, the morphology of these substructures may differ in scattered light (m) observations compared to dust thermal emission at mm wavelengths (e.g. Follette et al., 2013; Casassus, 2016; van Boekel et al., 2016; Hendler et al., 2017; Pinilla et al., 2018; Dong et al., 2018). While scattered light observations at near-infrared (NIR) wavelengths trace dust particles with sizes of up to a few microns in the disc surface layers (i.e. the scattering surface), continuum emission at (sub)-millimetre wavelengths provides one of the most direct constraints on the spatial distribution of millimeter-sized dust grains in the discs midplane. Therefore, the different morphology of disc substructures at different wavelengths may be due to the different dynamics of small and large dust grains, making the combination of scattered light (with, e.g., SPHERE) and continuum thermal observations (with, e.g. ALMA) a powerful tool to explore the gas and dust dynamics in protoplanetary discs.
For example, the structures of the disc around HD135344B are different in scattered light observations (Maire et al., 2017) with respect to the dust continuum (Cazzoletti et al., 2018). While in the first case we detect a two armed spiral structure, in the second one we observe an inner ring and an asymmetric structure. It is also interesting to note that by looking at the dust continuum at different wavelengths this asymmetry can be described as part of a ring (in Band 3 and Band 4, see Cazzoletti et al. 2018) or as an horseshoe (in Band 9 and Band 7). Assuming that these structures are generated by a planet (though it has been argued that they could have been originated by other mechanisms, like vortices, e.g. van der Marel et al. 2016), we know that gas and dust respond differently to the presence of a massive, Jupiter-like planet, with a distinctive spiral structure in the gas (and the small dust tightly coupled to it) (e.g. Dong et al., 2015a), but a more axisymmetric ring-like structure in large dust grains (e.g. Ayliffe et al., 2012; Dong et al., 2015b; Dipierro et al., 2015b; Price et al., 2018b).
The morphology of structures observed at different wavelengths depends on the interaction between the dust and gas. The motion of dust particles is affected by the interaction with the gas with an efficiency that depends on the degree of aerodynamical coupling. This is quantified by the Stokes number, St, the ratio of the drag stopping time and the dynamical time in the disc, i.e. (e.g. Weidenschilling, 1977)
| (1) |
where is the Keplerian angular velocity, is the internal dust density, is the vertical coordinate, is the size of dust grains, is the gas surface density, is the disc scale height assuming vertical hydrostatic equilibrium, i.e. where is the sound speed. The above equation is valid for small dust-to-gas mass ratio, isothermal equation of state and in the Epstein drag regime (Epstein, 1924), which is the relevant regime of dust-gas coupling up to millimeter-centimetre dust grains for typical disc parameters (Garaud et al., 2004). Strongly coupled and weakly coupled dust is defined by having and , respectively. Moreover, as we can see from Eq. 1, the coupling between dust and gas decreases with increasing vertical distance from the midplane. For this reason, 3D simulations of dust and gas are necessary in order to study the dynamics of the disc and to understand if this different degree of coupling can be detected by SPHERE (tracing grains at scale heights) and by ALMA (tracing grains at ). The Stokes number depends on an elusive yet fundamental disc property — the gas surface density , and thus the total gas disc mass.
The total gas disc mass, , determines how much mass is available for the formation of giant planets and for the accretion of gas atmosphere around rocky planets. At the same time, it also determines the likelihood of gravitational instability, which may induce disc fragmentation and enhanced angular momentum transport (Kratter & Lodato, 2016). Correlations of the disc mass with either the stellar mass (Natta et al., 2000; Andrews et al., 2013, 2018) or the mass accretion rate (Mulders et al., 2017; Lodato et al., 2017) can provide important constraints on disc evolution.
The dust mass is relatively easy to measure, starting from optically thin observations at millimetre wavelengths, provided that we have adequate information on the dust opacity and thus on the level of dust growth (Bergin & Williams, 2018). However, also in this case there is a lot of uncertainty, due to the optical depth estimate of the dust at (sub-)mm wavelengths. Woitke et al. (2016) discuss this in terms of the uncertainties we have in the dust grain size and composition (see their Fig.3, respectively roughly half and one order of magnitude). For decades, the total disc mass has been obtained from the dust mass simply by assuming a gas-to-dust ratio of 100, typical of the interstellar medium (Mathis et al., 1977). Whether this is applicable to the dense environments of protoplanetary discs is not yet understood (e.g. Bate & Lorén-Aguilar, 2017). Moreover, recent observations of protoplanetary discs have found a discrepancy between dust and gas disc sizes (e.g. Ansdell et al., 2016, 2018), that can be explained by the dynamical effect of the dust radial drift (Birnstiel & Andrews, 2014). The different dynamics between the two phases inevitably create regions of enhanced or reduced dust-to-gas ratio with respect to its ISM value.
Direct gas tracers are more difficult. The main component in the gas is the H2 molecule, which lacks a permanent electric dipole and so does not emit significantly. A proxy for the gas mass is provided by observations of CO in its various isotopologues (such as 13CO and C18O), although it is not clear whether these measurements are a reliable estimate of the gas disc mass (Williams & Best, 2014; Bergin & Williams, 2018). This is due to the fact that the conversion of the observed CO mass into total gas mass is not well understood. For example, the above mentioned correlations between disc mass and either stellar mass or accretion rates are much stronger when one uses dust rather than CO as a proxy for the disc mass (Manara et al., 2016). Typically, CO observations result in very low disc masses compared to dust estimates (Pascucci et al., 2016; Ansdell et al., 2016; Miotello et al., 2017; Long et al., 2017), which might indicate substantial carbon depletion in the disc, photodissociation in the upper layers, freeze-out at the disc midplane or in general other isotope-selective processes (Miotello et al., 2016). Measurements of the HD line in the far infrared (Bergin et al., 2013) have proved even more controversial, suggesting very high gas masses (but see Trapman et al., 2017). Importantly, Manara et al. (2018) found that not only for the gas mass estimate, but also for the dust mass the picture is not trivial. Indeed, they found that measurements of dust mass of protoplanetary discs in Myr old regions are lower than the core masses in exo-planets and planetary systems.
In this paper, we propose a method to infer the gas surface density co-located with the continuum and scattered light emissions of protoplanetary discs showing evidence of planet-induced substructures. We base our analysis on the difference in morphology of disc substructures imaged in NIR scattered light and (sub-)mm continuum observations. By combining 3D numerical simulations of a suite of dusty protoplanetary disc models hosting embedded protoplanets with 3D Monte Carlo radiative transfer simulations, we analyse the different observational predictions of disc substructures imaged by SPHERE and ALMA. The main aim is to find an empirical method to link the different morphology of disc substructures at different wavelengths with the gas surface density. This paper is organised as follows: in Section 2 we describe our numerical method and simulation setup. In Section 3 we describe the results of the numerical simulations and show a set of synthetic SPHERE and ALMA images of disc model. Finally, in Section 4 we discuss the implications of our results for the estimate of the gas surface density in protoplanetary discs and draw our conclusions in Section 5.
2 Methods
2.1 Dust and gas numerical simulations
We perform a suite of 3D Smoothed Particle Hydrodynamics (SPH) simulations of dusty protoplanetary discs, using the phantom code developed by Price et al. (2018a). Depending on the level of aerodynamical coupling between the gas and dust, we adopt the one fluid (for St, Price & Laibe 2015; Ballabio et al. 2018) or the two fluid (St, Laibe & Price 2012a, b) methods to simulate the dynamics of dust grains. The one-fluid algorithm is based on the terminal velocity approximation (e.g. Youdin & Goodman 2005). In all our simulations, we include the dust back-reaction, but do not include self-gravity.

.
2.2 Disc models
We pick as a test object HD135344B (also known as SAO 206462), a young stellar object hosting a dusty protoplanetary disc showing a prominent two-armed spiral structure in the near-IR scattered light emission (Stolker et al., 2016; Maire et al., 2017) and an inner ring plus a large horseshoe feature at (sub-)mm wavelengths (van der Marel et al., 2016; Cazzoletti et al., 2018). HD135344B is also known to be part of a visual binary, but due to the wide separation between the two objects (, i.e. au, Mason et al. 2001) it is unlikely that the disc structure we see is originated from the interaction with the companion. This motivates the choice of the parameters for the initial disc conditions in our SPH simulations (outlined in Table 1), although we note that the aim of our study is more generally valid to different configurations of planet-disc interaction.
In order to pursue this aim, in our hydrodynamical simulations, rather than changing directly the gas density, we change the Stokes number to obtain a corresponding variation of the gas mass: for example, since St is inversely proportional to the gas density (Eq. 1), an increase in St by a factor of 10 is equivalent to a decrease in by the same factor. This is needed because we want to compare disc morphologies independently of other evolutionary effects that might be affected by the gas mass, such as planetary migration and accretion (e.g. Kley & Nelson, 2012; D’Angelo & Lubow, 2008). Once the Stokes number and the dust properties (i.e. fluffiness, porosity, composition) are known, it is always possible to go back to the gas mass that has generated that given gas and dust coupling and the resulting system dynamics.
| Parameters | Value |
|---|---|
| (approx) | |
2.2.1 Gas and dust
The system consists of a central star of mass surrounded by a gas disc extending from = 25 au to = 200 au and modelled as a set of SPH particles. The initial gas surface density profiles are assumed to be power laws (Fung & Dong, 2015), i.e.
| (2) |
where is a normalization constant at the inner radius and . We adopt a locally isothermal equation of state , with
| (3) |
where is the sound speed at the inner disc radius and is the gas volume density. We assume (Andrews et al., 2011; Carmona et al., 2014) as the power-law index of the sound speed radial profile. The disc is vertically extended by assuming a Gaussian profile for the volume density and ensuring vertical hydrostatic equilibrium
| (4) |
where is the Keplerian velocity and is the aspect ratio at the reference radius . In our study, we vary the aspect ratio in the range (Stolker et al., 2016). We model viscous gas discs with an effective Shakura & Sunyaev (1973) viscosity , implemented through the artificial viscosity formalism in SPH (Lodato & Price, 2010).
Given the different cavity radius in gas and dust observed in HD135344B disc (Garufi et al., 2013; van der Marel et al., 2015), we consider a dust disc extending from au to au. We use the same functional form of the initial surface density as for the gas (Eq. 2), assuming a dust mass of . The dust-to-gas is initially assumed constant for the whole disc extent, so that the dust has the same vertical structure of the gas. After a few orbits of the outer planet, the dust has settled down forming a layer with thickness (Fromang & Nelson, 2009).
2.2.2 Treating different degrees of coupling
As already outlined, the aerodynamical coupling between the dust and gas phase is related to the grain size and the disc gas mass (see Eq. 1), i.e.
| (5) |
where is the gas disc mass. We have run simulations with initial values of the midplane Stokes number () in the range at the inner dust radius au, assuming an intrinsic grain density . In the left panel of Fig. 1 gas surface densities relative to the four choices of Stokes number are displayed, as a function of the disc radius. We note that the Stokes number range used in our models was chosen in order to span a wide range of dust-gas coupling. It is clear that the lower Stokes number of this model is unphysical because it corresponds to a very high disc mass that will lead to the development of gravitational instabilities. However, the same study is still relevant for smaller grains and lower intrinsic grain density, which would provide smaller and more physical gas masses for the same degree of coupling. In the right panel of Fig. 1 we show the initial value of the midplane () Stokes number as a function of radius. Each line represents a different gas mass. The solid, dashed and dotted lines () refer to simulations performed with the one-fluid method, while the dot-dashed line () refers to a two-fluid simulation.
Note that, once the dust is decoupled from the gas (St), the dust dynamics depends very little on St, so our results for the largest value of St are in general applicable also for moderate St.
2.2.3 Properties of the embedded planets
In each disc model we embed two planets at radial distances from the central star of au and au, respectively. We model the planets and the central star as sink particles. The sinks are free to migrate and are able to accrete gas and dust (Bate et al., 1995). Depending on the planetary mass and local disc structure, a planet can excite multiple spiral arms (Miranda & Rafikov, 2018). Generally, planets with masses larger than a threshold, i.e.
| (6) |
are expected to excite two spiral arms interior to their orbit, while the tidal interaction with planets with give rise to a spiral structure with only one arm. In both cases, the pitch angle of the spiral arms are expected to be proportional to the local aspect ratio (Rafikov, 2002; Zhu et al., 2015; Miranda & Rafikov, 2018). The mass is defined as the planet mass at which the Hill radius of the planet (Eq. 7 below) is equal to the thickness of the disc at the planet position . The planet masses in our disc models are chosen to be equal to and , where indicates the Jupiter mass. With this parameter choice, we get an inner cavity and a two armed spiral feature. These masses correspond to and respectively, for . The accretion radius of each planet is chosen to be half the minimum between the Hill radius,
| (7) |
and the disc height at the planet position ,
| (8) |
In this way, we are able to accurately reproduce the spiral arms excited by the planets embedded in the disc, with reasonable computational efforts. Also, since different values of correspond to different values of gas density at the disc midplane, this will result in a slightly different planetary migration and accretion (e.g. D’Angelo & Lubow, 2008; Baruteau et al., 2014).
2.3 Radiative transfer and synthetic observations
We compute synthetic observations of our disc models by performing 3D radiative transfer simulations, by means of the RADMC-3D code (Dullemond et al., 2012), starting from the results of the hydrodynamical simulations. Our goal is to compute the synthetic ALMA Band 6 (1.3 mm) and SPHERE Band H (1.65 m) observations.
The main inputs for the radiative transfer modelling are the dust density structure of large and small grains, a model for the dust opacities and the source of luminosity. We compute the dust opacities using the diana OpacityTool code111https://dianaproject.wp.st-andrews.ac.uk developed by Woitke et al. (2016), adopting the dust model from Min et al. (2016). We choose two ranges of grain sizes in order to sample both the small () and the large () dust population and to study scattered light and continuum images. While the large dust ( mm) is directly available from the simulation, we assume that the small (m) dust density is simply proportional to the gas density (since it is expected to be tightly coupled to the gas for any gas mass), . This factor is chosen so as to have a total small dust mass of , which corresponds to a ISM-like grain size distribution (), if the large dust mass is .
The expected emission maps at 1.65 m and 1.3 mm are computed via ray-tracing using photon packages, assuming that the disc is face-on. The source of radiation is assumed to be the central star, located at the centre of the coordinate system, with , K and . We assume the disc to be located in Ophiuchus star-forming region (156 pc). In order to simulate the effect of a coronograph in scattered light observations, we mask a circular region of diameter ” around the central star. This corresponds to the coronograph diameter used in the most common service NIR configuration for the IRDIS instrument222Table 45 in https://www.eso.org/sci/facilities/paranal/instruments/sphere/doc/VLT-MAN-SPH-14690-0430_v96.pdf.
The full-resolution images at 1.3 mm directly produced by RADMC-3D are used as input sky models to simulate realistic ALMA observations using the Common Astronomy Software Application (CASA) ALMA simulator (version 4.5.3, McMullin et al. 2007). We take into account the thermal noise from the receivers and the atmosphere (Pardo et al., 2002) and assume a perfect calibration of the visibility measurements. We assumed Cycle 6 ALMA capabilities adopting an antenna configuration alma.cycle6.6 that provides a beam of 0.1 0.08 arcsec ( au at 156 pc), adopting a transit duration of 300 minutes. However, in order to remove possible external asymmetries and to be able to study only non axi-symmetric structures due to the dynamic of the system, we manually changed the beam to a circular one with a dimension of 0.09 0.09 arcsec. The SPHERE images are computed by convolving the full-resolution scattered light image in H-band produced by RADMC-3D with a circular Gaussian point spread function with a full width half maximum (FWHM) of 0.037”, taken as a good approximation to the angular resolution achieved by SPHERE.
3 Results

3.1 Disc morphologies as a function of the Stokes number
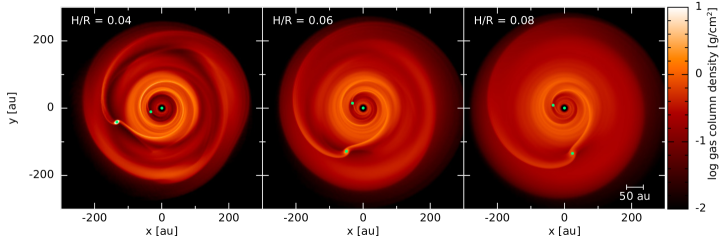
Figure 2 shows the gas surface density maps of our disc models with the three aspect ratio (from left to right) after orbits of the outer planet (at the initial planet location au) and 80 orbits of the inner planet (initial location au). Due to the different locations and masses of the embedded planets, the resulting spiral structures induced by planet-disc interactions is dominated by the outer planet, while the inner one is responsible for carving the cavity. As already mentioned in Sect. 2.2.3, the spiral features interior to the orbit of the outer planet are characterized by two spiral arms with a pitch angles that increases with increasing . At the same time, the arms become less sharp, since the intensity of the spiral structures depends on the planet mass and on the disc aspect ratio (eq. 16 in Miranda & Rafikov 2018). The density colour scale is in arbitrary units and the gas densities for the various choices of disc mass can be obtained by a suitable rescaling.
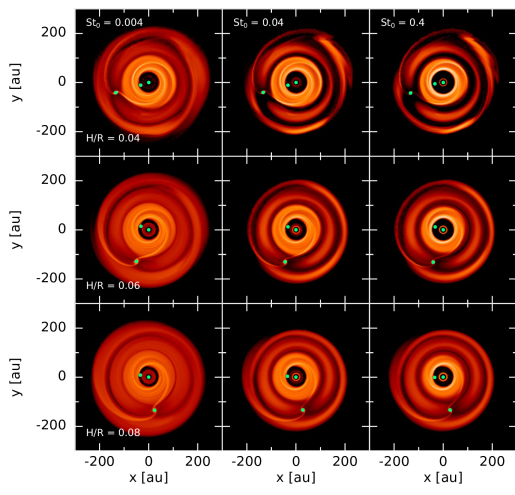
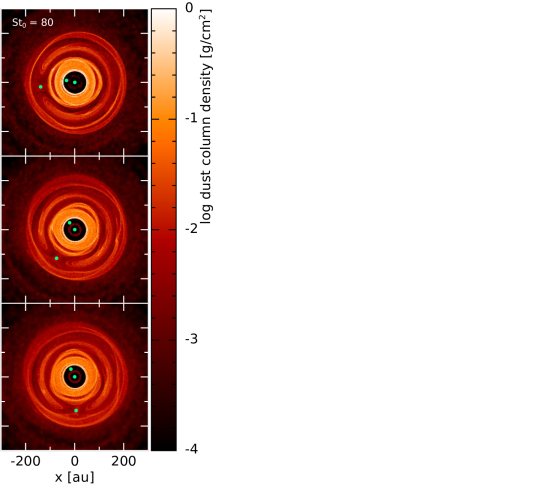
Fig. 3 shows the dust surface density maps of our models. Here the different rows represent different disc aspect ratio , while each column represents a specific Stokes number at the disc midplane ( at the reference radius for the initial conditions). All the snapshot of Fig. 3 are taken at the same time, so the different position of the planets are due to a slightly different migration rate for the various disc aspect ratios. If we look at the last column of Fig. 3, , some elliptical asymmetries are visible. These are caused by the fact that if the dust is decoupled from the gas, eccentricity pumping at the mean motion resonances (i.e. 1:2, 2:1, 2:3 and 3:2, which are respectively 0.6, 1.6, 0.76 and 1.3 times the planet radius ) can arise (Zhu et al., 2014). The inner resonances (1:2 and 2:3) in our case are at au and au, that correspond with the elliptical shape visible in the dust with .
3.2 Simulated images
When the dust and the gas are coupled (i.e. for high gas mass) we expect to detect spiral structures, both in the dust continuum and in the scattered light emission, while when they are decoupled (i.e. lower gas mass) the disc will be characterized by a more axi-symmetric structure at mm-wavelengths (e.g. rings or horseshoes). Fig. 4 shows the synthetic images obtained as described in Section 2.3 for the SPHERE and ALMA observations. In the first column there are the scattered light SPHERE images (micron-sized grains). The dust continuum ALMA images (tracers of millimetric grains distribution) are presented for different Stokes parameters ( at the midplane in the initial condition) from the second to the fifth columns. Different disc aspect ratio are shown from the top to the bottom row.
As expected all SPHERE images show a spiral feature, since we obtained them by rescaling the gas by a factor that takes into account the amount of micron-sized dust in the disc. By doing in this way, the dynamics of the micron-sized grains are assumed to follow the gas, producing the characteristic spirals we see. The ALMA images with (for all the disc aspect ratio), also display two spiral arms as visible also in the SPHERE image. Indeed, in this case the dust is strongly coupled to the gas. However, increasing the Stokes number (i.e. decreasing the gas disc mass) the dust and gas become progressively less coupled: the non axi-symmetric sub-structures become gradually more symmetric and circular. As an example, if we consider the ALMA image with and we compare it with the image, a ring-like structure instead of the two-armed spiral is observed. From St to St the disc also becomes more compact since radial dust drift becomes more effective (Weidenschilling, 1977). This effect has been also discussed by Powell et al. (2019). At St the disc retains its original radius due to the strong decoupling between dust and gas.
If we look at different disc aspect ratios, while the spiral structures are well defined in a disc with , they become less evident in a disc with also for low Stokes number. In fact, when the disc is thinner, since the interaction between the planet and the disc is stronger, the gap carved by the planet is deeper and the resulting spiral is brighter with respect to the background (see Fig. 1 in Fung & Dong 2015). We highlight that increasing the aspect ratio the spiral arms become less wound up. This is visible especially for the case with initial .
4 Discussion
4.1 Spiral or ring? An analysis of substructure (a)symmetries
In Fig. 4 we have shown the ALMA synthetic images for different gas masses, corresponding to different Stokes number. However, since the dynamic range of the image is large, in order to enhance the fainter non axi-symmetric features, we compute the residuals of each image. First, we divide the disc in 22 annuli from 0.02 to 1.0 arcsec. The chosen radial width corresponds to the beam radius, and has been chosen as a fair compromise between the resolution of our images and the need of thin annuli. Then, in each annulus , we subtract from the pixel intensity the flux mean value , as
| (9) |
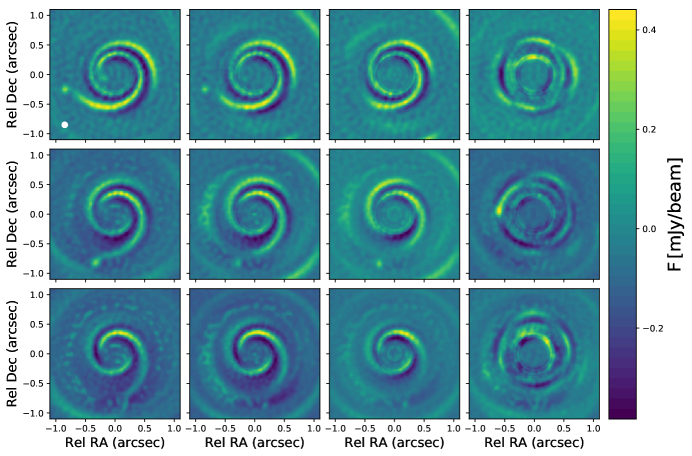
The result is shown in Fig. 5, where the Stokes number increases from left to right and the disc aspect ratio increases from the top to the bottom. In this figure the more axi-symmetric component has been removed, and the spirals, if present, are clearly visible. As already evinced from Fig. 4, the disc with low Stokes number and smaller aspect ratio are characterized by spirals. Increasing the Stokes number the spirals become more tightly wound and also smaller, until they disappear in the disc with the higher Stokes number. However, for St0=80 the residual images appear to be less symmetric than expected. This could be due to the fact that in the starting image were already present some asymmetries (eccentricity pumping, e.g. Zhu et al. 2014), and by computing the residuals we are enhancing them.
We now apply a more quantitative method in order to relate the morphologies (i.e. asymmetries or symmetries) of the residuals images (Fig. 5) to the gas disc mass. We compute for each image of Fig. 4 the standard deviation of the intensity for each annulus. The flux in each pixels, , has been normalized to the maximum value for each images, . Then, we compute the weighted average of the standard deviation for the whole disc, where the weight is the square mean intensity of each annulus,
| (10) |
In this equation, is the standard deviation and is the mean flux, in each annulus. In Figure 6 we show the weighted average standard deviation as a function of the Stokes number, where the points represent the value computed from the residuals of the simulated images (red for , blue for and green for ), while the dashed lines are the first order polynomial fit of the data points. Combining this result with Fig. 4, it is interesting to note that the general trend of structures becoming more symmetric with increasing Stokes number is visible also through the standard deviation of the intensity. In addition, by increasing the disc aspect ratio, the standard deviation of the flux intensity increases slightly.

| Source name | Ref. (Age, ) | Morphologies | ||
|---|---|---|---|---|
| (a) | (b) | (c) | (d) | (e) |
| HD135344B | 8 | [Grady et al. (2009) - Cazzoletti et al. (2018)] | Ahorseshoes+ring; Sspirals | |
| TWHya | 10 | [Weinberger et al. (2013) - Calvet et al. (2002); Thi et al. (2010)] | A,S rings | |
| MWC758 | [Meeus et al. (2012) - Boehler et al. (2018)] | Aring+spiral/clumps; Sspirals | ||
| HD97048 | 3 | [Lagage et al. (2006) - van der Plas et al. (2017)] | A,S rings | |
| AB Aurigae | 4. | [DeWarf et al. (2003) - Lin et al. (2006)] | Arings,spirals;Sspirals | |
| PDS70 | 5.4 | [Müller et al. (2018) - Keppler et al. (2018)] | Arings;Srings | |
| IMLup | 0.5 | [Alcalá et al. (2017) - Avenhaus et al. (2018)] | Aspirals;Srings | |
| HD169142 | [Grady et al. (2007) - Fedele et al. (2017)] | Arings;Srings | ||
| HD 143006 | [Garufi et al. (2018) - Natta et al. (2004)] | Arings;Srings, clump |
(a) Source name; (b) Disc age; (c) dust disc mass; (d) references for the disc age and for the dust disc mass; (e) disc morphologies observed in the continuum, with ALMA (A) and in scattered light, with SPHERE-VLT/Subaru-HiCIAO (S).
Continuum/scattered light discs morphologies references: 1 Cazzoletti
et al. (2018); Maire
et al. (2017), 2 van Boekel
et al. (2017); Andrews
et al. (2016), 3 Boehler
et al. (2018); Benisty
et al. (2015), 4 van der Plas
et al. (2017); Ginski
et al. (2016), 5 Hashimoto
et al. (2011), 6 Long
et al. (2018a); Keppler
et al. (2018), 7 Huang
et al. (2018); Avenhaus
et al. (2018),8 Fedele
et al. (2017); Pohl et al. (2017),9 Pérez
et al. (2018); Benisty
et al. (2018)
4.2 An application to observed morphologies in protoplanetary discs
The main result of our work is that disc substructures due to planet-disc interaction should be characterized by rings or ring-like structures, rather than spirals, if the Stokes number of millimetre-emitting grains (, e.g. Kataoka et al. 2015) is larger than . Provided that the properties of the dust (fluffiness, porosity, intrinsic grain density and size) are known, we can infer the gas surface density, which corresponds to (using Eq. 5 and assuming ), and hence to a disc mass of the order of for structures located at au or to for structures located at 200 au (indeed note, for example, that Dipierro et al. 2015a have used a mass of within 120 au to reproduce the system of rings in HL Tau). What implications does this have, when one takes into account the observed disc structures? First of all, we note that the majority of substructures observed with ALMA at high resolution are in the form of rings (Huang et al., 2018; Long et al., 2018b), which would then point to a prevalence of low mass discs. Note, however, that dust rings may be produced by mechanisms other than planet-disc interaction, so that the mere detection of rings in the mm continuum does not in itself imply the presence of a planet. A stronger indication for planet-disc interaction is present in those cases where, in addition to structure in the mm continuum, one also observe a substructure, such as a spiral, in scattered light images. We thus list in Table 2 all the known discs that have shown substructures both in scattered light and in mm continuum images, indicating for each of them what kind of structure is observed. From this small sample of discs, it is clear that in order to build a wider picture of disc evolution and to unravel the gas disc mass problem, the observation of a wider zoo of protoplanetary discs at different wavelengths is crucial (Haworth et al., 2016). However, we can extract interesting clues from the discussion of some of these systems.
In some cases, such as HD135344B and MWC758, we indeed observe a spiral structure in scattered light and rings or circular structures in the mm continuum, indicating that the disc mass in these system should be relatively low. In particular, for the case of HD135344B, which was the initial motivation of our study, we confirm that the observed spiral structure in scattered light can be ascribed to the presence of two massive planets, with a mass of a few Jupiter masses. ALMA images of HD135344B show a circular structure, but rather than full rings, a horseshoe is observed (Cazzoletti et al., 2018), which might indicate the presence of a vortex (van der Marel et al., 2016), that we cannot reproduce in our images because the viscosity that we assume is too large for vortex production. In MWC758 we do see hints of spiral structures: a southern arm in the continuum emission (optically thin, traces disc midplane) and two of them in the 13CO J=3-2 peak emission lines (optically thick, traces variation of the disc temperature), almost in the same location of the ones observed in the scattered light (see Boehler et al. 2018; Dong et al. 2018). The small offset in the radial location of the southern spiral observed in the continuum is probably due to the vertical propagation of the spiral (i.e. they bend over toward the star), or to a nonzero inclination so that the “NIR/surface spiral" and “ALMA/midplane spiral" are projected to different locations on the plane of the sky. The origin of the spiral observed in the continuum could be found in the trapping of millimeter-sized dust particles. Two clumps in correspondence of the two NIR spirals are also observed, and they are explained as possible Rossby wave instability (Boehler et al., 2018). Also Dong et al. (2018) hypothesized that their radial widths is related to emitting particles having Stokes numbers smaller than unity. This could be due to a locally high gas surface density.
TW Hya, HD143006 and HD169142 are three old ( Myr, Weinberger et al. 2013; Grady et al. 2007; Garufi et al. 2018) protoplanetary discs with symmetric structures imaged both in the ALMA and in the SPHERE data (van Boekel et al., 2017; Andrews et al., 2016; Fedele et al., 2017; Pohl et al., 2017). They all are evolved systems, where the gas has almost all been dissipated leaving a disc with a low gas-to-dust ratio (Williams & Cieza, 2011). This low surface gas density implies a high Stokes number not only for the millimetre grains, but also for the micron-sized dust, producing the observed structures in the SPHERE images. For this to happen, the gas disc mass should be smaller than . The case of TW Hya is particularly controversial. While its age would be in line with a very small gas mass, HD line observations by Bergin et al. (2013) would instead point to a much higher gas mass (i.e. ). Note that recently Powell et al. (2019) have performed an analysis similar in spirit to our own, in that they try and weigh the gas mass by estimating the different degrees of dust-gas coupling comparing multi-wavelength images. However, rather than using the effect of dust coupling on sub-structures, as we do, they observe its effect on the dust disc size, whereby dust with a larger St is expected to drift at a faster rate and produce a smaller disc (an effect that we also see in our simulations). By using this method, they generally conclude that the proto-planetary discs that they have analysed are relatively massive (close to gravitational instability). In particular, for TW Hya, they estimate a mass of 0.11 , in line with the HD measurements. However, this beg the question of how, with such a high disc mass, a regular system of rings is observed in the ALMA continuum. Mentiplay et al. (2019) have recently modeled TW Hya using phantom and a gas mass and indeed find that the scattered light images of their best model do show a spiral structure. To produce rings also in scattered light would require a very low disc mass , well below the minimum of inferred from CS measurements by Teague et al. 2018.
Another interesting case is IM Lup, for which a tightly wound spiral structure is observed with ALMA (Huang et al., 2018), while in scattered light the structure could be described both as multiple rings (Avenhaus et al. 2018) or as another tightly wound spiral. Despite a very low amount of dust (Avenhaus et al. 2018), this is thought to be one of the largest disc with a radial extent of au, measured from CO data, and a gas mass of (Pinte et al., 2018)333Ansdell et al. (2018) found a gas mass of , which is lower than the one given by Pinte et al. (2018). This discrepancy highlights the fact that we still have a large uncertainty on the gas mass measurements.. This would be consistent with a spiral induced by planet disc interaction in a massive disc with small (in order for the spiral to be tight). However, note that in this parameter range, the disc would be also prone to gravitational instability, which may be responsible for the observed spiral.
4.3 Caveats
Our calculations consider only 10 orbits of the outer planets, due to computational resources. However, it is worth highlighting that the relation we found between the observed substructures and the disc Stokes number is time-dependent: in more evolved systems the gas has already been partially dissipated, involving lower Stokes number and more symmetric structures. Also, the gap carving process is determined by the viscous timescale and for lower Stokes number it requires a large number of orbits. This means that while the transition between spirals and more axisymmetric structures in the continuum is general, the threshold between the two regimes may be different with longer timescale simulations (i.e. ).
From an observational point of view, to be able to distinguish between spiral and ring in scattered light one needs large pitch angle spiral, such the one in HD135344B or MWC758, unlike the one observed in TW Hya.
Moreover, it is important to note that in a single protoplanetary disc we can have regions with high and low Stokes number, resulting in a locally different coupling and so in different substructures. This can be due to both a lower/higher surface density regions (along the radial/vertical direction) and to different grain size populations in the same disc. In the first scenario, this is the result of the disc-planet interaction, with the formation of gaps and/or cavity (Dipierro et al., 2016; Ragusa et al., 2017), and of photo-evaporative process (Alexander et al., 2014), while in the second one this is the result of the process of grain growth and settling (Testi et al., 2014). For this reason, in order to obtain a more accurate study of the system, one should consider a single model with a wide range of dust grains sizes (Hutchison et al., 2018; Dipierro et al., 2018). This is now possible with the new multigrain utility that has been developed in the phantom code.
5 Conclusions
One of the most crucial, unsolved, questions in the field of planet formation is “how massive are protoplanetary discs?" (Bergin & Williams, 2018). Indeed, the gas mass affects how planets form and what is the origin of the substructures we observe in protoplanetary discs. In this paper we explore if there is a relationship between the observed morphologies (spirals, gaps, rings) and the gas mass. We have performed 3D dust and gas Smoothed Particle Hydrodynamics and radiative transfer simulations of protoplanetary discs with embedded planets, exploring different aerodynamical coupling between millimetre dust grains and gas and different aspect ratios.
The basic result of our work is that, as a result of planet-disc interaction, spiral structure observed in scattered light images would be observed as a circular, ring-like configuration in ALMA continuum emission for Stokes number close to unity or larger, corresponding to gas surface density . The observed prevalence of ring-like structures in ALMA images would thus imply that discs are generally less massive than . Powell et al. (2019) use a method similar to ours to estimate the gas disc mass but use the dust radial extent rather than the dust morphology to estimate the Stokes number. By using their method, they obtain an opposite result, in that most of the disc that they have considered would instead result in very massive discs, often close to gravitational stability. Further work is needed to resolve this discrepancy.
Acknowledgements
We wish to thank the referee for an insightful report of the manuscript. We thank Nienke van der Marel for fruitful discussions that gave new perspective to this work. We also want to thank Anna Miotello for enlightening discussion about gas measurements from observations. GL and BV have received funding from the European Union’s Horizon 2020 research and innovation programme under the Marie Skłodowska-Curie grant agreement No 823823 (RISE DUSTBUSTERS project). GD and ER acknowledge financial support from the European Research Council (ERC) under the European Union’s Horizon 2020 research and innovation programme (grant agreement No 681601). CH is a Winton Fellow, and this research has been supported by Winton Philanthropies/The David and Claudia Harding Foundation. DP acknowledges funding from the Australian Research Council via FT130100034 and DP180104235.
For our work we adopted different codes and software. We used phantom (Price et al., 2018a) for the hydrodynamic simulations and radmc-3d (Dullemond et al., 2012) for the radiative trasnfer calculations. We utilized diana OpacityTool (Woitke et al., 2016) for the dust opacities coefficients and casa (McMullin et al., 2007) for the simulations of ALMA observations. We used SPLASH (Price, 2007) for rendered images of our simulated hydrodynamic systems, while the remaining figures have been generated using the python-based MATPLOTLIB package (Hunter, 2007).
References
- Alcalá et al. (2017) Alcalá J. M., et al., 2017, A&A, 600, A20
- Alexander et al. (2014) Alexander R., et al., 2014, in Beuther H., Klessen R. S., Dullemond C. P., Henning T., eds, Protostars and Planets VI. p. 475 (arXiv:1311.1819), doi:10.2458/azu_uapress_9780816531240-ch021
- Andrews et al. (2011) Andrews S. M., Wilner D. J., Espaillat C., Hughes A. M., Dullemond C. P., McClure M. K., Qi C., Brown J. M., 2011, ApJ, 732, 42
- Andrews et al. (2013) Andrews S. M., Rosenfeld K. A., Kraus A. L., Wilner D. J., 2013, ApJ, 771, 129
- Andrews et al. (2016) Andrews S. M., et al., 2016, ApJ, 820, L40
- Andrews et al. (2018) Andrews S. M., Terrell M., Tripathi A., Ansdell M., Williams J. P., Wilner D. J., 2018, preprint, (arXiv:1808.10510)
- Ansdell et al. (2016) Ansdell M., et al., 2016, ApJ, 828, 46
- Ansdell et al. (2018) Ansdell M., et al., 2018, preprint, (arXiv:1803.05923)
- Avenhaus et al. (2018) Avenhaus H., et al., 2018, ApJ, 863, 44
- Ayliffe et al. (2012) Ayliffe B. A., Laibe G., Price D. J., Bate M. R., 2012, MNRAS, 423, 1450
- Ballabio et al. (2018) Ballabio G., Dipierro G., Veronesi B., Lodato G., Hutchison M., Laibe G., Price D. J., 2018, MNRAS, 477, 2766
- Baruteau et al. (2014) Baruteau C., et al., 2014, Protostars and Planets VI, pp 667–689
- Bate & Lorén-Aguilar (2017) Bate M. R., Lorén-Aguilar P., 2017, MNRAS, 465, 1089
- Bate et al. (1995) Bate M. R., Bonnell I. A., Price N. M., 1995, MNRAS, 277, 362
- Benisty et al. (2015) Benisty M., et al., 2015, A&A, 578, L6
- Benisty et al. (2018) Benisty M., et al., 2018, A&A, 619, A171
- Bergin & Williams (2018) Bergin E. A., Williams J. P., 2018, arXiv e-prints,
- Bergin et al. (2013) Bergin E. A., et al., 2013, Nature, 493, 644
- Birnstiel & Andrews (2014) Birnstiel T., Andrews S. M., 2014, ApJ, 780, 153
- Boehler et al. (2018) Boehler Y., et al., 2018, ApJ, 853, 162
- Calvet et al. (2002) Calvet N., D’Alessio P., Hartmann L., Wilner D., Walsh A., Sitko M., 2002, ApJ, 568, 1008
- Carmona et al. (2014) Carmona A., et al., 2014, A&A, 567, A51
- Casassus (2016) Casassus S., 2016, preprint, (arXiv:1602.06523)
- Cazzoletti et al. (2018) Cazzoletti P., et al., 2018, preprint, (arXiv:1809.04160)
- D’Angelo & Lubow (2008) D’Angelo G., Lubow S. H., 2008, ApJ, 685, 560
- DeWarf et al. (2003) DeWarf L. E., Sepinsky J. F., Guinan E. F., Ribas I., Nadalin I., 2003, ApJ, 590, 357
- Dipierro et al. (2015a) Dipierro G., Pinilla P., Lodato G., Testi L., 2015a, MNRAS, 451, 974
- Dipierro et al. (2015b) Dipierro G., Price D., Laibe G., Hirsh K., Cerioli A., Lodato G., 2015b, MNRAS, 453, L73
- Dipierro et al. (2016) Dipierro G., Laibe G., Price D. J., Lodato G., 2016, MNRAS, 459, L1
- Dipierro et al. (2018) Dipierro G., Laibe G., Alexander R., Hutchison M., 2018, MNRAS, 479, 4187
- Dong et al. (2015a) Dong R., Zhu Z., Whitney B., 2015a, ApJ, 809, 93
- Dong et al. (2015b) Dong R., Zhu Z., Rafikov R. R., Stone J. M., 2015b, ApJ, 809, L5
- Dong et al. (2018) Dong R., et al., 2018, ApJ, 860, 124
- Dullemond et al. (2012) Dullemond C. P., et al., 2012, RADMC-3D: A multi-purpose radiative transfer tool, Astrophysics Source Code Library (ascl:1202.015)
- Epstein (1924) Epstein P. S., 1924, Physical Review, 23, 710
- Fedele et al. (2017) Fedele D., et al., 2017, A&A, 600, A72
- Follette et al. (2013) Follette K. B., et al., 2013, ApJ, 767, 10
- Fromang & Nelson (2009) Fromang S., Nelson R. P., 2009, A&A, 496, 597
- Fung & Dong (2015) Fung J., Dong R., 2015, ApJ, 815, L21
- Garaud et al. (2004) Garaud P., Barrière-Fouchet L., Lin D. N. C., 2004, ApJ, 603, 292
- Garufi et al. (2013) Garufi A., et al., 2013, A&A, 560, A105
- Garufi et al. (2018) Garufi A., et al., 2018, preprint, (arXiv:1810.04564)
- Ginski et al. (2016) Ginski C., et al., 2016, A&A, 595, A112
- Grady et al. (2007) Grady C. A., et al., 2007, ApJ, 665, 1391
- Grady et al. (2009) Grady C. A., et al., 2009, ApJ, 699, 1822
- Hashimoto et al. (2011) Hashimoto J., et al., 2011, ApJ, 729, L17
- Haworth et al. (2016) Haworth T. J., et al., 2016, preprint, (arXiv:1608.01315)
- Hendler et al. (2017) Hendler N. P., et al., 2017, arXiv e-prints, p. arXiv:1711.09933
- Huang et al. (2018) Huang J., et al., 2018, ApJ, 869, L43
- Hunter (2007) Hunter J. D., 2007, Computing in Science and Engineering, 9, 90
- Hutchison et al. (2018) Hutchison M., Price D. J., Laibe G., 2018, MNRAS, 476, 2186
- Kataoka et al. (2015) Kataoka A., et al., 2015, ApJ, 809, 78
- Keppler et al. (2018) Keppler M., et al., 2018, A&A, 617, A44
- Kley & Nelson (2012) Kley W., Nelson R. P., 2012, ARA&A, 50, 211
- Kratter & Lodato (2016) Kratter K., Lodato G., 2016, ARA&A, 54, 271
- Lagage et al. (2006) Lagage P.-O., et al., 2006, Science, 314, 621
- Laibe & Price (2012a) Laibe G., Price D. J., 2012a, MNRAS, 420, 2345
- Laibe & Price (2012b) Laibe G., Price D. J., 2012b, MNRAS, 420, 2365
- Lin et al. (2006) Lin S.-Y., Ohashi N., Lim J., Ho P. T. P., Fukagawa M., Tamura M., 2006, ApJ, 645, 1297
- Lodato & Price (2010) Lodato G., Price D. J., 2010, MNRAS, 405, 1212
- Lodato et al. (2017) Lodato G., Scardoni C. E., Manara C. F., Testi L., 2017, MNRAS, 472, 4700
- Long et al. (2017) Long F., et al., 2017, ApJ, 844, 99
- Long et al. (2018a) Long Z. C., et al., 2018a, ApJ, 858, 112
- Long et al. (2018b) Long F., et al., 2018b, ApJ, 869, 17
- Maire et al. (2017) Maire A.-L., et al., 2017, A&A, 601, A134
- Manara et al. (2016) Manara C. F., et al., 2016, A&A, 591, L3
- Manara et al. (2018) Manara C. F., Morbidelli A., Guillot T., 2018, A&A, 618, L3
- Mason et al. (2001) Mason B. D., Wycoff G. L., Hartkopf W. I., Douglass G. G., Worley C. E., 2001, AJ, 122, 3466
- Mathis et al. (1977) Mathis J. S., Rumpl W., Nordsieck K. H., 1977, ApJ, 217, 425
- McMullin et al. (2007) McMullin J. P., Waters B., Schiebel D., Young W., Golap K., 2007, in Shaw R. A., Hill F., Bell D. J., eds, Astronomical Society of the Pacific Conference Series Vol. 376, Astronomical Data Analysis Software and Systems XVI. p. 127
- Meeus et al. (2012) Meeus G., et al., 2012, A&A, 544, A78
- Mentiplay et al. (2019) Mentiplay D., Price D. J., Pinte C., 2019, MNRAS, 484, L130
- Min et al. (2016) Min M., Rab C., Woitke P., Dominik C., Ménard F., 2016, A&A, 585, A13
- Miotello et al. (2016) Miotello A., van Dishoeck E. F., Kama M., Bruderer S., 2016, preprint, (arXiv:1605.07780)
- Miotello et al. (2017) Miotello A., et al., 2017, A&A, 599, A113
- Miranda & Rafikov (2018) Miranda R., Rafikov R. R., 2018, arXiv e-prints,
- Mulders et al. (2017) Mulders G. D., Pascucci I., Manara C. F., Testi L., Herczeg G. J., Henning T., Mohanty S., Lodato G., 2017, ApJ, 847, 31
- Müller et al. (2018) Müller A., et al., 2018, A&A, 617, L2
- Natta et al. (2000) Natta A., Grinin V. P., Mannings V., 2000, in Mannings V., Boss A., Russell S., eds, Protostars and Planets IV. Arizona University Press, Tucson
- Natta et al. (2004) Natta A., Testi L., Neri R., Shepherd D. S., Wilner D. J., 2004, A&A, 416, 179
- Pardo et al. (2002) Pardo J., Cernicharo J., Serabyn E., 2002, in Vernin J., Benkhaldoun Z., Muñoz-Tuñón C., eds, Astronomical Society of the Pacific Conference Series Vol. 266, Astronomical Site Evaluation in the Visible and Radio Range. p. 188
- Pascucci et al. (2016) Pascucci I., et al., 2016, ApJ, 831, 125
- Pérez et al. (2018) Pérez L. M., et al., 2018, ApJ, 869, L50
- Pinilla et al. (2018) Pinilla P., et al., 2018, ApJ, 868, 85
- Pinte et al. (2018) Pinte C., et al., 2018, A&A, 609, A47
- Pohl et al. (2017) Pohl A., et al., 2017, ApJ, 850, 52
- Powell et al. (2019) Powell D., Murray-Clay R., Pérez L. M., Schlichting H. E., Rosenthal M., 2019, arXiv e-prints,
- Price (2007) Price D. J., 2007, Publications of the Astronomical Society of Australia, 24, 159
- Price & Laibe (2015) Price D. J., Laibe G., 2015, MNRAS, 451, 813
- Price et al. (2018a) Price D. J., et al., 2018a, Publ. Astron. Soc. Australia, 35, e031
- Price et al. (2018b) Price D. J., et al., 2018b, MNRAS, 477, 1270
- Rafikov (2002) Rafikov R. R., 2002, ApJ, 569, 997
- Ragusa et al. (2017) Ragusa E., Dipierro G., Lodato G., Laibe G., Price D. J., 2017, MNRAS, 464, 1449
- Shakura & Sunyaev (1973) Shakura N. I., Sunyaev R. A., 1973, A&A, 24, 337
- Stolker et al. (2016) Stolker T., et al., 2016, A&A, 595, A113
- Teague et al. (2018) Teague R., Bae J., Bergin E. A., Birnstiel T., Foreman-Mackey D., 2018, ApJ, 860, L12
- Testi et al. (2014) Testi L., et al., 2014, Protostars and Planets VI, pp 339–361
- Thi et al. (2010) Thi W.-F., et al., 2010, A&A, 518, L125
- Trapman et al. (2017) Trapman L., Miotello A., Kama M., van Dishoeck E. F., Bruderer S., 2017, A&A, 605, A69
- Weidenschilling (1977) Weidenschilling S., 1977, MNRAS, 180, 57
- Weinberger et al. (2013) Weinberger A. J., Anglada-Escudé G., Boss A. P., 2013, ApJ, 762, 118
- Williams & Best (2014) Williams J. P., Best W. M. J., 2014, ApJ, 788, 59
- Williams & Cieza (2011) Williams J. P., Cieza L. A., 2011, ARA&A, 49, 67
- Woitke et al. (2016) Woitke P., et al., 2016, A&A, 586, A103
- Youdin & Goodman (2005) Youdin A. N., Goodman J., 2005, ApJ, 620, 459
- Zhu et al. (2014) Zhu Z., Stone J. M., Rafikov R. R., Bai X.-n., 2014, ApJ, 785, 122
- Zhu et al. (2015) Zhu Z., Dong R., Stone J. M., Rafikov R. R., 2015, preprint, (arXiv:1507.03599)
- van Boekel et al. (2016) van Boekel R., et al., 2016, preprint, (arXiv:1610.08939)
- van Boekel et al. (2017) van Boekel R., et al., 2017, ApJ, 837, 132
- van der Marel et al. (2015) van der Marel N., van Dishoeck E. F., Bruderer S., Pérez L., Isella A., 2015, A&A, 579, A106
- van der Marel et al. (2016) van der Marel N., Cazzoletti P., Pinilla P., Garufi A., 2016, ApJ, 832, 178
- van der Plas et al. (2017) van der Plas G., et al., 2017, A&A, 597, A32