pnasresearcharticle \leadauthorShang \significancestatementAt large strains, glassy systems deform through a series of elastic loading phases followed by energy and stress drops without a characteristic scale, similar to earthquakes. Less is known on the small deformation case, which is related to the structure of the energy landscape close to an energy minimum. We investigate numerically this regime, and show that even at very small strains the deformation proceeds through avalanches that are power-law distributed, with a universal exponent that corresponds to the predictions of mean field theory for a hierarchical phase space structure. These avalanches reveal marginal stability in the amorphous solid, which is intrinsically inelastic. By investigating the preparation and size dependence, we infer that the effect persists in the thermodynamic limit. \authorcontributionsB.S.S,P.F.G and J.L.B designed the study, B.S.S performed the research, B.S.S,P.F.G and J.L.B analyzed the results, B.S.S and J.L.B wrote the paper. \authordeclaration The authors declare no conflict of interest. \correspondingauthor1To whom correspondence should be addressed. E-mail: pguan@csrc.ac.cn & jean-louis.barrat@univ-grenoble-alpes.fr
Elastic avalanches reveal marginal behaviour in amorphous solids
Abstract
Mechanical deformation of amorphous solids can be described as consisting of an elastic part in which the stress increases linearly with strain, up to a yield point at which the solid either fractures or starts deforming plastically. It is well established, however, that the apparent linearity of stress with strain is actually a proxy for a much more complex behavior, with a microscopic plasticity that is reflected in diverging nonlinear elastic coefficients. Very generally, the complex structure of the energy landscape is expected to induce a singular response to small perturbations. In the athermal quasistatic regime, this response manifests itself in the form of a scale free plastic activity. The distribution of the corresponding avalanches should reflect, according to theoretical mean field calculations (Franz and Spigler, Phys. Rev. E., 2017, 95, 022139), the geometry of phase space in the vicinity of a typical local minimum. In this work, we characterize this distribution for simple models of glass forming systems, and we find that its scaling is compatible with the mean field predictions for systems above the jamming transition. These systems exhibit marginal stability, and scaling relations that hold in the stationary state are examined and confirmed in the elastic regime. By studying the respective influence of system size and age, we suggest that marginal stability is systematic in the thermodynamic limit.
keywords:
amorphous solid elastic avalanche marginal stabilityThis manuscript was compiled on
The response of amorphous solids and yield stress fluids to a mechanical deformation has attracted a considerable attention from the statistical physics as well as materials science community in the recent years. A large number of numerical and theoretical studies have been devoted to the regime of stationary plastic flow, and particularly in the limit of zero strain rate and negligible thermal effects, the so-called athermal quasi static (AQS) regime. In this regime, it is now well accepted that the flow proceeds by local instabilities called shear transformations, that interact elastically and can organise in larger scale events called avalanches. Each event results, at constant strain, into a stress or energy drop. The statistics of these drops are typically a power law with a cutoff that depends on system size. This behavior can be described in terms of simple elasto-plastic models, in which subvolumes of the glass are described as linear elastic elements that yield above some critical stress, possibly triggering the yield of other elements as the stress is transmitted through the system by an elastic propagator. This simplified picture, while very successful in describing the collective behavior at large deformation, completely ignores the fine structure of the energy landscape. This structure is effectively responsible for the dynamics of the local yield process, which in these models is described in terms of some effective damping parameter.
Another set of studies has focused on the yield process itself, i.e. the transition from an essentially reversible deformation towards irreversible plastic flow or failure. This transition has been shown to depend critically on the thermal history of the system, with poorly annealed systems undergoing a rather smooth transition to a flowing state, while very well annealed systems fracture abruptly (1). This difference however is not directly related to the structure of phase space in the vicinity of a given minimum, as it only occurs at large deformations.
Finally, considerable attention has been devoted recently to the possible existence of so-called “marginally stable” glassy states, in which the local phase space has a hierarchical organisation that can be associated, in the language of spin glasses, with a full breaking of the replica symmetry. Ordinary glasses, on the other hand, have a simpler energy landscape, with many minima separated by rather large barriers. The transition towards marginally stable glasses was first explored in hard sphere systems (2, 3, 6), and some signatures of this structure have been observed in recent simulations of soft spheres (4, 5), however with a limitation to finite range interactions.
In this context, it was shown by Spigler and Franz (7) that the hierarchical structure of phase space should result in a peculiar response to mechanical deformation, somewhat similar to the one observed in flowing systems. Shear transformations associated with stress or energy drops have long been observed in the elastic regime at low temperature both in experiment and simulation (8, 9, 10, 11). However, the events observed at small deformation are generally localized, partly reversible and thermal-history dependent, in contrast with the steady state case (12, 13, 14, 15). Organisation in avalanches displaying a power law distribution is observed only at large strains close to the yield point, the exponent of the corresponding power law being still controversial (11, 16, 17, 18). In contrast, the prediction made in ref. (7) is that even at very small strains (vanishingly small in the mean field calculation), the events are scale free avalanches with a distribution that reflects the structure of phase space described by the Parisi function. A very specific prediction is made concerning the exponent of the distribution of avalanche sizes in the mean field limit, and preliminary numerical (7) and experimental (19) results were shown to be close to this prediction. In this work, we investigate avalanche statistics far below yielding, both in two and three dimensions, for a system of particles interacting through a Lennard-Jones potential. Different system sizes and different thermal histories of the initial configuration are considered. The simulations are carried out using the athermal quasistatic protocol (AQS) in simple shear, volume conserving deformations. We find that even at very small strains, the mean value of avalanche size is sub-extensive with system size, with a finite size scaling exponent that depends on thermal-history. By making a simple scaling ansatz, all the data for the avalanche size distribution can be collapsed onto a single master curve, with a universal avalanche exponent in the transient state clearly distinct from the one observed previously in the steady plastic flow regime, and close to the value predicted in ref. (7). The mean field calculation, being done in the limit of infinite dimensions, does not convey any information concerning the spatial structure and physical nature of the corresponding events in real space. We therefore investigate the possibility that the marginally stable state is amenable to an elasto-plastic description (20) involving interacting zones characterized by a “pseudo-gap” . Within this framework, a universal scaling relation observed in the steady state is also valid in the transient state, and directly connects the avalanche energy with the dissipation in the transient state at zero temperature and with the exponents characterizing the pseudo gap associated with marginal stability. The latter is also found to behave as predicted by the elasto-plastic models studied in (20) . By analysing the dependence of the results on thermal history and size, we infer that, in the thermodynamic limit, the amorphous solid shows intrinsic inelastic behavior.
Results
Avalanche number density
To investigate the statistics of avalanches, we use the avalanche number density (21), which is defined as the number of avalanches per unit of avalanche size (here measured by the corresponding energy drop) and per unit strain. and refer to the system size (number of atoms) and the initial temperature from which the system has been quenched to zero temperature. For reference, the mode coupling temperature is in 2D and in 3D system. The corresponding normalized avalanche distribution and total avalanche number per unit strain are
| (1) |
and the total energy per unit strain dissipated in avalanches is
| (2) |
The systems and procedure are described in the Methods section. Here we only recall that the range of strains used to collect the statistics is , much below the yield strain ( and in 2D,3D systems, respectively). In this regime, we have checked that is insensitive to the strain interval used to collect the statistics, as illustrated in Fig. S5 in Supplamentary Information(SI).
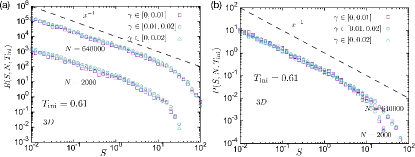
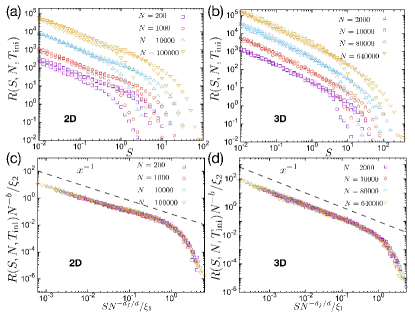
The number density of avalanches is shown as a function of their size in Figure 1. It displays a typical power-law distribution with a cutoff that depends on system size and on thermal history. In contrast with the case of stationary plastic flow (13), avalanches in the transient state are influenced by thermal history, which also determines the brittleness of the amorphous material (22, 1). From figure 1 and Fig. S4, it is seen that, for a given system size, the cutoff value and the extent of the power law behavior in the become smaller as decreases and the stability of the initial configuration increases.
Scaling analysis
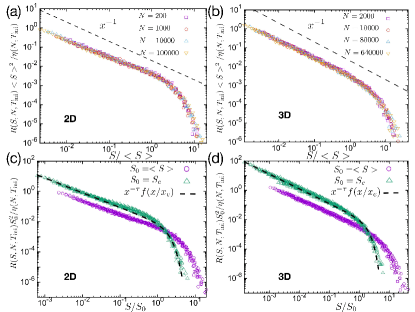
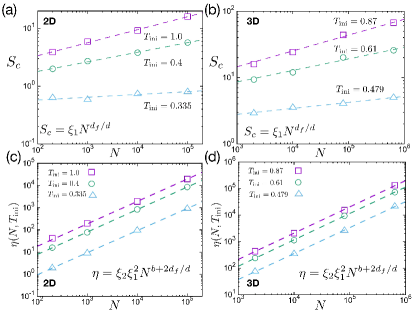
Generally, one expects that the avalanche number density can be described as a power law distribution with cutoff caused by finite size effects, i.e. , where is the cutoff value influenced by system size and thermal history, is the avalanche exponent, and is a cutoff function. Introducing the reduced size , we can make the following scaling hypothesis:
| (3) |
| (4) |
Here , are prefactors which are determined by thermal history, the exponents and , which a priori could also depend on thermal history, describe the cutoff due to the finite size of the system. Here is the fractal dimension of avalanches and is the dimension of system. The total avalanche energy per unit strain can then be written as follows:
| (5) |
For values of the avalanche exponent , the cutoff value can be obtained from:
| (6) |
One can then collapse the data onto a master curve, removing the dependence on thermal history and system size. The parameters associated with system size ( and ) and with thermal history ( and ), can be fitted by the formula: and , both for 2D and 3D systems, as shown in Figure 2. The values of the fit parameters are given in tables S1 and S2 in SI Appendix.In figure 1(c),(d), after data collapse, the avalanche number density shows a universal behavior and the avalanche exponent is close to unity for 2D () and 3D () systems. The fitting curve is shown in Fig. S6.
Energy balance and relation between exponents
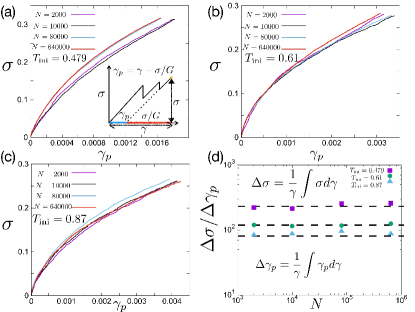
In order to check the consistency of the scaling analysis, it is worthwhile to consider it in relation with energy balance arguments. The total energy per unit strain of the avalanches is (equation 5), which depends on system size and on thermal history. As the system is deformed at zero temperature without thermostat, the avalanches constitute the only mechanism that dissipates energy, therefore energy balance implies that adding up this dissipated energy to the work done on the system during loading should give the difference in energy between an initial state at zero strain and the final strain after straining by an amount . In other words, if is the total energy dissipated in the process (which we expect to be extensive) one has the identity:
| (7) |
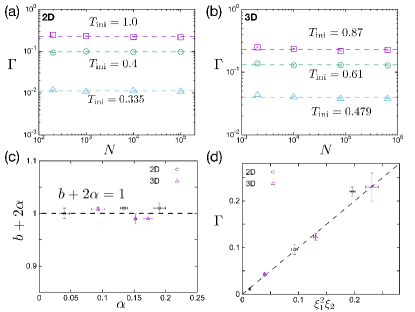
is the density of dissipated energy. It can be calculated from the stress strain curve using equation 7. The data displayed in figure 3(a) and 3(b), show that this quantity is indeed independent of system size, as expected. If we now identify with the total energy of the avalanches, we obtain the universal scaling relation:
| (8) |
and the relation between exponents: . Figure 3(c) shows that this relationship, which was first obtained in the plastic flow regime by Salerno et al (21, 23), also holds for the transient avalanches in the elastic regime. Note that the expected relation for the prefactors, is also confirmed in figure 3(d).
Conclusion concerning the avalanche exponent
The avalanche exponent in our system is consistent with the theoretical work of Franz and Spigler (7), who confirmed their prediction by preliminary simulations of soft elastic spheres above jamming. Our system of Lennard-Jones particles with attractions is significantly different, so that the result suggests a universal exponent for avalanches in the elastic regime, independent of interactions and of dimensionality. A similar avalanche exponent is also observed in an independent work (24), in which the avalanche size is characterized using stress drops. This exponent is clearly distinct from the one obtained at large plastic deformation in the stationary state using AQS or overdamped dynamics at zero temperature. In the latter case, the avalanche exponent is larger than unity (close to 1.3 in simulations, to 1.5 according to depinning mean field predictions) as confirmed both by simulation and theoretical work (23, 25, 26). This distinction is qualitatively consistent with experiments performed in metallic glasses (16) or simulations of athermal cycling shear (17), which shows a sharp transition from a transient regime to a steady state, and a different avalanche exponent in these two states. The large avalanches in the steady state are system spanning and history-independent, they can be described as metabasin to metabasin transition on the potential energy landscape (PEL). In contrast, the small strains applied here perturb the system within a metabasin state of the PEL, and the avalanche is caused by basin to basin transition. Statistically, these two kinds of transition belong to two different universality classes.
As mentioned in the introduction, the Spigler Franz result is related to the hierarchical structure of the free energy landscape in a high dimension system. While the analysis is consistent with the Franz-Spigler result that the local minima within this landscape is marginally stable, it does not give any insight on the spatial structure and system size dependence of the associated events. In the following, we pursue the analysis of our simulation data in order to get some insight into this aspect, in an attempt to relate it to the view of marginal stability proposed by Lin and Wyart in the context of elasto-plastic models (20).
Avalanche mean size and distribution cutoff
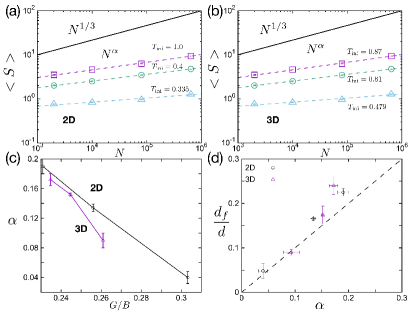
In addition to the avalanche exponent (), the scaling parameters obtained by fitting the data plotted in figure 2 also provide relevant information on avalanche statistics. The fractal dimension characterizes the geometry of the avalanche event. We find that it decreases when the initial stability of the system, characterized by , increases. Figure 4 shows that the mean value of avalanche size is also sensitive to system size and thermal history, with a scaling exponent larger than zero and sub-extensive, as in the steady state (13), This result contrasts the view that plastic activity in the elastic regime of amorphous solids is localized and independent of system size (14, 27). Again, a check of the consistency of the results can be obtained by relating the values of the different exponents. As first discussed by Lin et al (28, 29), for , a scaling relation holds. In our case, , the scaling relation reduces to , so that . Figure 4(d) confirms the relation , and indeed the data can be collapsed equally well using or , as shown in Fig. S6.
Figure 4(c) shows that the scaling exponent is monotonically decreasing with the ratio of shear to bulk modulus , which usually characterizes the ductility in amorphous materials (30, 31, 15). This suggests a relation between ductility and avalanche behavior in the elastic regime. We also note that, when the stability of the initial state increases ( decreases), becomes smaller and could eventually vanish. That situation suggests a transition from sub-extensive to localized avalanches, which could be connected with ductile to brittle transition dominated by initial stability(1).
First avalanche event and pseudo-gap exponent
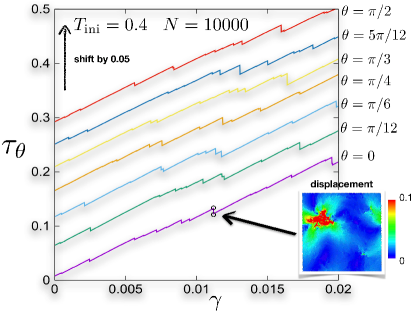
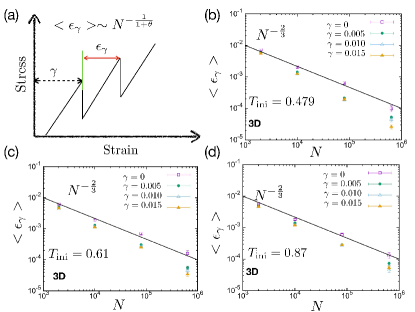
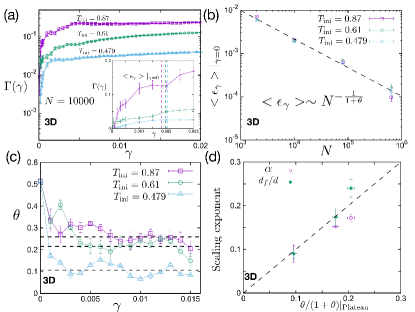
We now discuss the interpretation of our data within the context of elasto-plastic model, concentrating on the statistics of the first avalanche event observed upon applying strain to the system. To this end, we consider the evolution of the dissipated energy with the (figure 5). For a given thermal history, as a function of strain varies slowly except in the vicinity of the very first plastic event, (14, 32). Here is defined as the incremental strain needed to reach the next plastic event after the system has been strained over an interval (see Fig. S7(a)). The behaviour shown in Figure 5(a) interpolates between perfect elastic behavior without dissipation for and the regime in which dissipation is extensive and . The strain scale for this crossover, , is a crucial quantity in the analysis of systems presenting marginal stability, as would be consistent with our observations for . Indeed, in a system presenting a pseudogap for low lying excitations of the form (here is the strain associated with the excitation), extreme value statistics implies that the value of scales with system size as (33). Here, a scaling is obtained as shown in figure 5(b), implying . The latter value is consistent with the theoretical prediction of a model of elastically interacting events (20) and other simulation results (14, 34, 32, 35, 36).
Within the framework of elasto-plastic models, (29) the exponent can be related to the exponent that governs the dependence of the mean avalanche amplitude on system size. In the transient regime, the argument implies comparing the number of avalanches over a stress interval, , and the corresponding change in plastic strain, . As does not depend on system size (see Fig. S8 in SI Appendix), one obtains the relation between exponents .
One is then faced with the paradoxical result, that the data indicates a significant dependence of on the system preparation, while appears to have the universal value . This discrepancy can be resolved by considering the fact that the avalanches that contribute to the definition of are actually collected over a finite strain range, . On the other hand, the value discussed previously involves only the very first event at , . If we now extend the analysis to finite values of and define a dependent value of (characterizing the statistics of ), a very different value of is obtained, as illustrated in figure 5(c). In fact, drops immediately from its initial value close to to a much lower value that depends on thermal history, and remains roughly constant over the whole strain interval. This behaviour corresponds to the one predicted by the model of ref. (20), and the corresponding value of is perfectly correlated to the one obtained for , as illustrated in figure 5(d).
Discussion and Conclusions
We have presented a detailed study of the avalanches that take place in the elastic portion of the stress-strain curve of an amorphous solid, or “elastic avalanches”. We find several evidences that these avalanches have the characteristics expected for marginal states of dense amorphous packings, in particular, the avalanche exponent takes the value predicted by mean field theory for such packings (7). We propose to take this observation as a possible indication of a locally hierarchical energy landscape, and explore the possibility that the corresponding events can be described within the framework of an elasto-plastic description in which marginal stability is associated with a pseudo gap in the distribution of excitations. Within this framework, the exponent characterizing the pseudo-gap has a nontrivial evolution with strain, starting from a universal value 1/2 at zero strain and evolving rapidly towards a plateau that depends on thermal history. This behaviour also corresponds to the expectations of the model described in ref. (20).
In addition, we find that the parameters characterizing avalanche distribution, energy dissipation and pseudo-gap are related by three universal scaling relations , , and an identity , regardless of dimension. While these results are established using quasi static simulations, the corresponding analysis based on scaling arguments and energy conservation should still hold at finite strain rate and inertia.
In recent years, many efforts have been devoted to the identification of marginal stability in amorphous packings, and the present consensus (4, 5) seems to be that this feature is observable only in systems with finite range, contact interactions, at relatively low packing fractions in the vicinity of the jamming point. It is therefore surprising that features of marginal stability are observed in systems with long range interactions and at packing fractions that are characteristic of high density glassy systems such as metallic glasses. We now tentatively explain this observation based on two observations. Firstly, the existence of a true, dissipation free elastic regime without avalanches depends on the manner in which the thermodynamic limit and the limit of zero strain are taken. The dissipation vanishes at small strain over a scale that scales inversely to the system size, so that one has the two equalities:
| (9) |
The amorphous solid in the thermodynamic limit is therefore intrinsically dissipative, as noted in previous theoretical (37) and simulation (38) works. On the other hand, any finite system will have a finite range of ideal elastic behavior. Our study, however, indicates that this range will be crucially dependent on the thermal history and sample preparation. Indeed the behaviour observed for the pseudogap exponent and schematically summarized in Fig. S9, as well as the behaviour of the exponent (figure 3), indicates that as the system is better annealed the range of elastic behavior will rapidly increase and the avalanches will become more fractal, with approaching zero. As a result, it can be expected that in very well annealed systems such as those studied in refs (4, 5, 36) the size needed for observing large scale avalanches at small strains could be prohibitively large, so that observed excitations are limited to localised defects. The need to use larger sizes to properly describe the scaling behavior in the response of highly annealed systems was also pointed out in ref. (36). Whether or not there is an actual transition where and vanish as a function of initial annealing conditions is an issue that cannot be addressed here, although this may be consistent with the idea of a sharp change from ductile to brittle behavior described in ref. (1).
Methods
Sample preparation
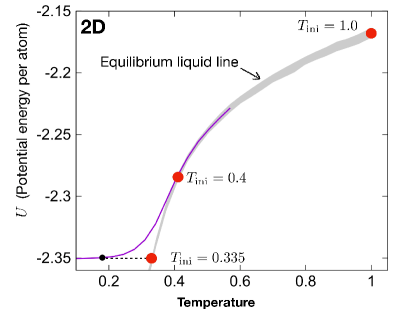
we use two well-studied glass-forming models to investigate the avalanche behavior within elastic regime: one is 2D Lenard-Jones binary model(35), and the other is 3D Lenard-Jones binary model(39) with force shift(40). All the units are reduced by the mass , length scale , and energy . The number density is fixed at and for 2D and 3D systems, respectively. The number ratio between large () and small () atoms is in 2D and in 3D. We first annealed the sample to equilibrium state at in 2D (see Fig. S1 in SI Appendix), in 3D using the NVT ensemble, respectively. The temperature was controlled by a Nosé-Hoover thermostat (41) with periodic boundary conditions. The energy was then minimized to obtain the inherent structure at zero temperature, and we use to represent the thermal history of each system. In our two different LJ system, we can take as a reference the mode-coupling temperature , where in 2D (35) and in 3D (42). All the simulations were conducted with the molecular dynamics simulation software: LAMMPS(43).
Avalanche statistics in the elastic regime
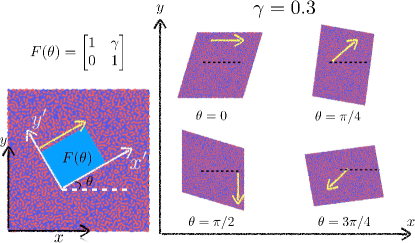
To investigate finite size effects and the statistics of avalanche distribution, we prepared series of samples with different sizes for each : in 2D , we used 2000 independent samples for , 500 samples for , 100 samples for , 50 samples for and in 3D: 50 samples for ,20 samples for , 10 samples for , 1 sample for . Due to the complexity of potential energy landscape, the avalanche events are highly depended on the deformation direction(44), see Fig. S3 in SI Appendix, we used the directional simple shear protocol to improve the statistics, in which a simple shear deformation gradient was used in different direction. As illustrated in Fig. S2, in the 2D system, 12 directions from to in xy plane are used for each sample, in the 3D system, simple shear deformation were applied in the xy ,xz, yz planes, respectively, and with again 12 directions from to in each plane.
Although strain and stress are tensors, for the simple shear deformation, the shear strain and shear stress dominate the mechanical deformation, then we describe the deformation using the scalars and . As shown in Fig. S3, we used an athermal quasistatic shear protocol to deform the sample. First the sample is affinely sheared by a small step strain, then the sample was minimized at deformed strain, repeated the process until the total strain reaches the desired value. The step strain both in 2D and 3D is for all systems except the largest sample in 3D, where we used . During the avalanche event, there is a stress drop and energy drop and we define the avalanche size as
| (10) |
where is the potential energy drop per atom during avalanche, is the strain step, is the stress just before the avalanche, is the number density. We use as a threshold to recognize avalanche events. We have tested different thresholds from 0.01 to 0.1, with qualitatively similar results. Following ref. (23), we define the avalanche number at a given avalanche size and system size per unit strain as . Note that both the avalanche number and avalanche size in the elastic regime not only depend on the system size , but also depend on the thermal history (see Fig. S4 in SI Appendix) \showmatmethods
Data deposition
All data relevant to this paper are available at https://doi.org/10.17605/OSF.IO/U6PYF. \acknow We thank Silvio Franz, Stefano Spigler, Matthieu Wyart and Ludovic Berthier for useful discussions. This work is supported by (B.S.S and P.G.F) the NSF of China (Grant Nos.51601009,Nos.51571011,Nos.U1930402),the MOST 973 Program (No.2015CB856800). B.S.S and P.F.G acknowledges the computational support from the Beijing Computational Science Research Center (CSRC). J.L.B is supported by Institut Universitaire de France. \showacknow
References
- Ozawa et al. (2018) Misaki Ozawa, Ludovic Berthier, Giulio Biroli, Alberto Rosso, and Gilles Tarjus. Random critical point separates brittle and ductile yielding transitions in amorphous materials. Proc. Natl. Acad. Sci. U.S.A., 115(26):6656–6661, 2018. ISSN 0027-8424.
- Berthier et al. (2016) Ludovic Berthier, Patrick Charbonneau, Yuliang Jin, Giorgio Parisi, Beatriz Seoane, and Francesco Zamponi. Growing timescales and lengthscales characterizing vibrations of amorphous solids. Proceedings of the National Academy of Sciences, 113(30):8397–8401, 2016.
- Charbonneau et al. (2017) Patrick Charbonneau, Jorge Kurchan, Giorgio Parisi, Pierfrancesco Urbani, and Francesco Zamponi. Glass and jamming transitions: From exact results to finite-dimensional descriptions. Annu. Rev. Condens. Matter Phys., 8:265–288, 2017.
- Scalliet et al. (2019) Camille Scalliet, Ludovic Berthier, and Francesco Zamponi. Marginally stable phases in mean-field structural glasses. Phys. Rev. E, 99:012107, Jan 2019. 10.1103/PhysRevE.99.012107. URL https://link.aps.org/doi/10.1103/PhysRevE.99.012107.
- Scalliet and Berthier (2019) Camille Scalliet and Ludovic Berthier. Rejuvenation and memory effects in a structural glass. Phys. Rev. Lett., 122:255502, 2019.
- Liao and Berthier (2019) Qinyi Liao and Ludovic Berthier. Hierarchical landscape of hard disk glasses. Phys. Rev. X, 9:011049, Mar 2019. 10.1103/PhysRevX.9.011049. URL https://link.aps.org/doi/10.1103/PhysRevX.9.011049.
- Franz and Spigler (2017) S. Franz and S. Spigler. Mean-field avalanches in jammed spheres. Phys. Rev. E, 95:022139, 2017.
- Papakonstantopoulos et al. (2008) George J. Papakonstantopoulos, Robert A. Riggleman, Jean-Louis Barrat, and Juan J. de Pablo. Molecular plasticity of polymeric glasses in the elastic regime. Phys. Rev. E, 77:041502, Apr 2008. 10.1103/PhysRevE.77.041502. URL https://link.aps.org/doi/10.1103/PhysRevE.77.041502.
- Antonaglia et al. (2014) James Antonaglia, Wendelin J. Wright, Xiaojun Gu, Rachel R. Byer, Todd C. Hufnagel, Michael LeBlanc, Jonathan T. Uhl, and Karin A. Dahmen. Bulk metallic glasses deform via slip avalanches. Phys. Rev. Lett., 112:155501, 2014.
- Denisov et al. (2017) Dmitry V Denisov, Kinga A Lőrincz, Wendelin J Wright, Todd C Hufnagel, Aya Nawano, Xiaojun Gu, Jonathan T Uhl, Karin A Dahmen, and Peter Schall. Universal slip dynamics in metallic glasses and granular matter–linking frictional weakening with inertial effects. Sci. Rep., 7:43376, 2017.
- Lagogianni et al. (2018) Alexandra E Lagogianni, Chen Liu, Kirsten Martens, and Konrad Samwer. Plastic avalanches in the so-called elastic regime of metallic glasses. Eur. Phys. J. B, 91(6):104, 2018.
- Jin et al. (2018) Yuliang Jin, Pierfrancesco Urbani, Francesco Zamponi, and Hajime Yoshino. A stability-reversibility map unifies elasticity, plasticity, yielding, and jamming in hard sphere glasses. Sci. Adv., 4(12), 2018.
- Maloney and Lemaître (2004) Craig Maloney and Anaël Lemaître. Subextensive scaling in the athermal, quasistatic limit of amorphous matter in plastic shear flow. Phys. Rev. Lett., 93:016001, 2004.
- Karmakar et al. (2010) Smarajit Karmakar, Edan Lerner, and Itamar Procaccia. Statistical physics of the yielding transition in amorphous solids. Phys. Rev. E, 82:055103, 2010.
- Fan et al. (2017) Meng Fan, Minglei Wang, Kai Zhang, Yanhui Liu, Jan Schroers, Mark D. Shattuck, and Corey S. O’Hern. Effects of cooling rate on particle rearrangement statistics: Rapidly cooled glasses are more ductile and less reversible. Phys. Rev. E, 95:022611, 2017.
- Krisponeit et al. (2014) Jon-Olaf Krisponeit, Sebastian Pitikaris, Karina E Avila, Stefan Küchemann, Antje Krüger, and Konrad Samwer. Crossover from random three-dimensional avalanches to correlated nano shear bands in metallic glasses. Nat. Commun., 5:3616, 2014.
- Leishangthem et al. (2017) Premkumar Leishangthem, Anshul D. S. Parmar, and Srikanth Sastry. The yielding transition in amorphous solids under oscillatory shear deformation. Nat. Commun., 8:14653, 2017.
- Regev et al. (2015) Ido Regev, John Weber, Charles Reichhardt, Karin A Dahmen, and Turab Lookman. Reversibility and criticality in amorphous solids. Nat. Commun., 6:8805, 2015.
- Peng et al. (2019) Si-Xu Peng, Cheng Zhang, Chong Yang, Ran Li, Tao Zhang, Lin Liu, Hai-Bin Yu, and Konrad Samwer. Anomalous nonlinear damping in metallic glasses: Signature of elasticity breakdown. J. Chem. Phys., 150(11):111104, 2019.
- Lin and Wyart (2016) Jie Lin and Matthieu Wyart. Mean-field description of plastic flow in amorphous solids. Phys. Rev. X, 6:011005, 2016.
- Salerno et al. (2012) K. Salerno, Craig Maloney, and Mark Robbins. Avalanches in strained amorphous solids: Does inertia destroy critical behavior? Phys. Rev. Lett., 109:105703, 2012.
- Shi and Falk (2005) Yunfeng Shi and Michael L. Falk. Strain localization and percolation of stable structure in amorphous solids. Phys. Rev. Lett., 95:095502, 2005.
- Salerno and Robbins (2013) K. Michael Salerno and Mark O. Robbins. Effect of inertia on sheared disordered solids: Critical scaling of avalanches in two and three dimensions. Phys. Rev. E, 88:062206, 2013.
- Ruscher and Rottler (2019) Céline Ruscher and Jörg Rottler. Residual stress distributions in athermally deformed amorphous solids from atomistic simulations. arXiv preprint arXiv:1908.01081, 2019.
- Talamali et al. (2011) Mehdi Talamali, Viljo Petäjä, Damien Vandembroucq, and Stéphane Roux. Avalanches, precursors, and finite-size fluctuations in a mesoscopic model of amorphous plasticity. Phys. Rev. E, 84:016115, 2011.
- Dahmen et al. (2011) Karin A Dahmen, Yehuda Ben-Zion, and Jonathan T Uhl. A simple analytic theory for the statistics of avalanches in sheared granular materials. Nat. Phys., 7(7):554–557, 2011.
- Lin and Zheng (2017) Jie Lin and Wen Zheng. Universal scaling of the stress-strain curve in amorphous solids. Phys. Rev. E, 96:033002, 2017.
- Lin et al. (2014a) Jie Lin, Edan Lerner, Alberto Rosso, and Matthieu Wyart. Scaling description of the yielding transition in soft amorphous solids at zero temperature. Proc. Natl. Acad. Sci. U.S.A., 111(40):14382–14387, 2014a.
- Lin et al. (2015) Jie Lin, Thomas Gueudré, Alberto Rosso, and Matthieu Wyart. Criticality in the approach to failure in amorphous solids. Phys. Rev. Lett., 115:168001, 2015.
- Lewandowski et al. (2005) JJ Lewandowski, WH Wang, and AL Greer. Intrinsic plasticity or brittleness of metallic glasses. Philos. Mag. Lett., 85(2):77–87, 2005.
- Kumar et al. (2013) Golden Kumar, Pascal Neibecker, Yan Hui Liu, and Jan Schroers. Critical fictive temperature for plasticity in metallic glasses. Nat. Commun., 4:1536, 2013.
- Lin et al. (2014b) Jie Lin, Alaa Saade, Edan Lerner, Alberto Rosso, and Matthieu Wyart. On the density of shear transformations in amorphous solids. EPL, 105(2):26003, 2014b.
- Müller and Wyart (2015) Markus Müller and Matthieu Wyart. Marginal stability in structural, spin, and electron glasses. Annu. Rev. Condens. Matter Phys., 6(1):177–200, 2015.
- Hentschel et al. (2015) H. G. E. Hentschel, Prabhat K. Jaiswal, Itamar Procaccia, and Srikanth Sastry. Stochastic approach to plasticity and yield in amorphous solids. Phys. Rev. E, 92:062302, 2015.
- Barbot et al. (2018) Armand Barbot, Matthias Lerbinger, Anier Hernandez-Garcia, Reinaldo García-García, Michael L Falk, Damien Vandembroucq, and Sylvain Patinet. Local yield stress statistics in model amorphous solids. Phys. Rev. E, 97(3):033001, 2018.
- Lerner et al. (2018) Edan Lerner, Itamar Procaccia, Corrado Rainone, and Murari Singh. Protocol dependence of plasticity in ultrastable amorphous solids. Phys. Rev. E, 98:063001, 2018.
- Biroli and Urbani (2016) Giulio Biroli and Pierfrancesco Urbani. Breakdown of elasticity in amorphous solids. Nat. Phys., 12(12):1130, 2016.
- Hentschel et al. (2011) H. G. E. Hentschel, Smarajit Karmakar, Edan Lerner, and Itamar Procaccia. Do athermal amorphous solids exist? Phys. Rev. E, 83:061101, 2011.
- Kob and Andersen (1994) Walter Kob and Hans C. Andersen. Scaling behavior in the -relaxation regime of a supercooled lennard-jones mixture. Phys. Rev. Lett., 73:1376–1379, 1994.
- Toxvaerd and Dyre (2011) Søren Toxvaerd and Jeppe C Dyre. Communication: Shifted forces in molecular dynamics. J. Chem. Phys., 134:081102, 2011.
- Nosé (1984) Shuichi Nosé. A unified formulation of the constant temperature molecular dynamics methods. J. Chem. Phys., 81:511, 1984.
- Kob and Andersen (1995) Walter Kob and Hans C. Andersen. Testing mode-coupling theory for a supercooled binary lennard-jones mixture. ii. intermediate scattering function and dynamic susceptibility. Phys. Rev. E, 52:4134–4153, 1995.
- Plimpton (1995) Steve Plimpton. Fast parallel algorithms for short-range molecular dynamics. J. Comput. Phys, 117(1):1–19, 1995.
- Gendelman et al. (2015) Oleg Gendelman, Prabhat K Jaiswal, Itamar Procaccia, Bhaskar Sen Gupta, and Jacques Zylberg. Shear transformation zones: State determined or protocol dependent? EPL, 109(1):16002, 2015.
Supplamentary Information
Fitting parameters
We have summarized all the fitting parameters of scaling collapse in the main text as follows:
| 1.0 | 0.225(8) | 0.19(1) | 1.2(1) | 0.196(5) |
| 0.4 | 0.166(5) | 0.134(5) | 0.84(4) | 0.093(5) |
| 0.335 | 0.050(2) | 0.040(8) | 0.46(7) | 0.013(1) |
| 0.87 | 0.24(2) | 0.172(8) | 2.8(6) | 0.23(1) |
| 0.61 | 0.17(2) | 0.152(2) | 2.6(7) | 0.131(4) |
| 0.479 | 0.090(6) | 0.09(1) | 1.5(1) | 0.040(2) |