Discovery of an Outbursting 12.8 Minute Ultracompact X-Ray Binary111Based on observations obtained with the 1.3-m Warsaw telescope at the Las Campanas Observatory of the Carnegie Institution for Science and archival data from NASA/ESA Hubble Space Telescope under program GO 14074 and Chandra X-ray Observatory under program GO 17844.
Abstract
We report the discovery of OGLE-UCXB-01, a 12.8 minute variable object located in the central field of Galactic bulge globular cluster Djorg 2. The presence of frequent, short-duration brightenings at such an ultrashort period in long-term OGLE photometry together with the blue color of the object in Hubble Space Telescope images and the detection of moderately hard X-rays by Chandra observatory point to an ultracompact X-ray binary system. The observed fast period decrease makes the system a particularly interesting target for gravitational-wave detectors such as the planned Laser Interferometer Space Antenna.
1 Variable Stars and the OGLE Survey
Stellar astrophysics owes a lot to observations of variable stars since they provide valuable information on stellar interiors and evolution of single and binary systems. Regular photometric observations of millions of stars help to improve statistics on known variables and to discover rare objects. The OGLE project is a long-term variability survey of the Magellanic System and Milky Way stripe visible from Las Campanas Observatory, Chile. The original science goal of the project in 1992 was a monitoring of the Galactic bulge in searches for microlensing events. That area remains the most frequently observed part of the sky by OGLE with a cadence as short as 20 minutes in the most crowded fields. Since 2010 March the project is in its fourth phase (OGLE-IV; Udalski et al., 2015). OGLE operates the 1.3 m Warsaw telescope equipped with a 32-detector mosaic camera of a total field of view of 1.4 deg2 and a pixel size of . The previous phase, OGLE-III, was conducted in the years 2001–2009 (Udalski et al., 2008). A significant fraction of OGLE exposures is collected in the Cousins band, while the remaining exposures are taken in the Johnson band. Reductions are performed using the difference image analysis (DIA) technique (Alard & Lupton, 1998; Woźniak et al., 2000), developed especially for dense stellar fields.
OGLE has discovered and classified over one million variable stars of various types, including transient, irregular, and periodic objects (e.g., Soszyński et al., 2014, 2015; Mróz et al., 2015). Although the sampling of OGLE observations is not adapted for the detection of millimagnitude variations on time scales of minutes, short-period variable sources with amplitudes of tenths of a magnitude have been found. For example, Pietrukowicz et al. (2017) announced the discovery of blue large-amplitude pulsators (BLAPs), hot pulsating stars with periods in the range 20–40 minutes and optical amplitudes of 0.2–0.4 mag.
2 Detection of the Unique Variable
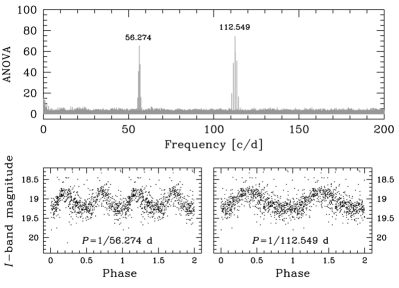
In this Letter, we report the discovery of an unusual periodic variable object with the shortest period ever detected in the OGLE data, that is about 12.79 minutes. A search for short-period objects was carried out for the Galactic bulge data covering OGLE-IV seasons 2010–2013. Around 400 million -band light curves were analyzed in the frequency space from 30 to 100 days-1 using the FNPEAKS222http://helas.astro.uni.wroc.pl/deliverables.php?lang=en&active=fnpeaks code. It calculates Fourier amplitude spectra of unequally spaced time-series data composed of a large number of points ( or more). The code substantially reduces (by a factor of five) the computation time for a discrete Fourier transform by coadding correctly phased, low-resolution Fourier transforms of pieces of the large data set interpolated to high resolution. OGLE light curves with the resulting highest signal-to-noise ratio were subjected to visual inspection. Among the identified variable stars were BLAPs (Pietrukowicz et al., 2017). Here, a particular attention is paid to the detection BLG511.06.25872 (in the OGLE database, detection #25872 in chip 06 of the Galactic bulge field BLG511). Accurate period determination together with the estimation of its uncertainty was performed with the TATRY code (Schwarzenberg-Czerny, 1996). It employs periodic orthogonal polynomials to fit the data and the analysis of variance (ANOVA) statistic to evaluate the quality of the fit. Due to the very short period of the variable object, all moments were converted from Heliocentric Julian Date (HJD) to Barycentric Julian Date (BJDTDB). The true period turned out to be even shorter than the minimum searched period of 14.4 minutes, and the detected signal was an alias (see the power spectrum and phased OGLE light curves in Fig. 1). We notice that the reported period is the only one seen in this star. Any longer period would be detected in the OGLE data.
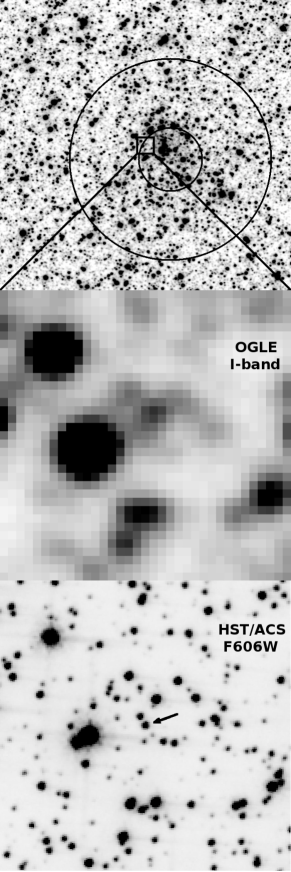
The variable is located in the field of Galactic bulge globular cluster Djorg 2 (ESO 456-SC38) at an angular distance of from its center or at , where the cluster core radius (from the 2010 version of the catalog by Harris, 1996). However, it was not possible to point the true source in ground-based frames due to severe blending. Fortunately, the field of Djorg 2 was imaged with the Hubble Space Telescope (HST) under program GO 14074. The cluster was observed with the Wide Field Camera of the Advanced Camera for Surveys (ACS/WFC) in the optical filter F606W (corresponding to broad ) on 2016 August 19. A week later, on 2016 August 26, it was observed in near-infrared filters with the Wide Field Camera 3 (WFC3/IR), F110W (covering bands), and F160W ( band). The HST data allowed us to indicate the true variable star (see Fig. 2) at position in the ACS/WFC drizzled image jcx324010 or at the equatorial coordinates 18:01:50.30, 27:49:24.1).
3 Investigation of the Nature of the New Object
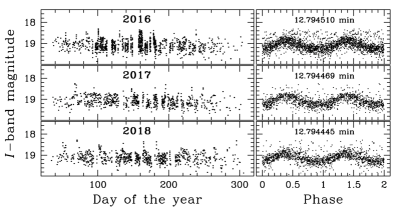
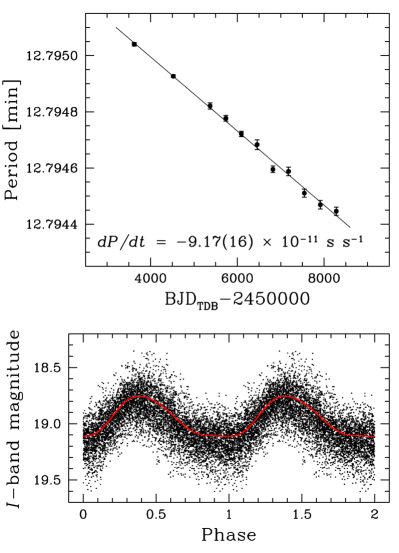
The object is a periodic variable with an ultrashort period of about 12.79 minutes. Long-term OGLE observations provide some more interesting information (see Fig. 3). In the time domain, we can notice short brightenings. They last up to several hours and reach about 1 mag in the band. Due to severe blending, the true amplitude of the brightenings is likely much higher, 2 mag or even more. Another finding is that the period of the variable decreases constantly with a rate of s s-1. We phased light curves from each OGLE-IV season (2010–2018) separately, cleaned them from outlying points (with clipping) and combined all of them together to one plot (Fig. 4). Finally, we fit a third-order Fourier series to the data. The combined -band light curve shows a 0.37 mag bump covering more than half of the period. The bump is slightly more steep on the raising branch and the minimum is almost flat. We note that the observed scatter in the ground-based light curve stems from various reasons: blending, nonnegligible exposure time in comparison to the variability period (100 s vs. 767.4 s), and the period decrease. In Table 1, we compile period values of the variable star determined from the OGLE photometry over the years 2004–2018.
| Years | OGLE | BJDmiddle | [minutes] | |
|---|---|---|---|---|
| Phase | ||||
| 2004–06 | III | 3624.0977 | 12.795040(6) | 427 |
| 2007–09 | III | 4524.2197 | 12.794926(4) | 583 |
| 2010 | IV | 5372.5320 | 12.794820(11) | 653 |
| 2011 | IV | 5735.7050 | 12.794776(10) | 818 |
| 2012 | IV | 6092.0027 | 12.794721(10) | 918 |
| 2013 | IV | 6455.5293 | 12.794683(17) | 881 |
| 2014 | IV | 6820.4535 | 12.794594(11) | 845 |
| 2015 | IV | 7180.4325 | 12.794587(15) | 804 |
| 2016 | IV | 7544.2946 | 12.794510(14) | 1132 |
| 2017 | IV | 7913.4080 | 12.794469(15) | 692 |
| 2018 | IV | 8281.0703 | 12.794445(15) | 726 |
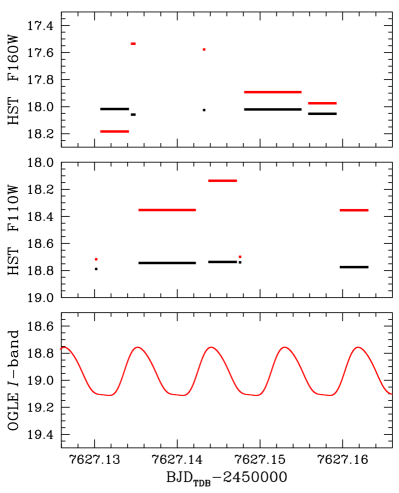
Due to significant blending, the true -band amplitude of the periodic modulation is expected to be much higher. The HST WFC3/IR data show that the amplitude is indeed extreme, although we cannot determine its exact value. The observations cover over four variability cycles (Fig. 5). Five single images with various exposure times ranging from about 24 to 599 s were obtained in each of the two near-infrared filters, F110W and F160W. We determined magnitudes of the variable star by fitting the point spread function using the DOLPHOT package (Dolphin, 2000). The WFC3 magnitudes roughly reflect variations expected from the long-term OGLE observations. However, one has to remember that the used HST filters are centered on longer wavelengths ( nm, nm) in comparison to the OGLE -band filter ( nm). The largest difference in brightness reaches 0.58 mag in F110W and 0.65 mag in F160W, but the true amplitudes are likely slightly higher.
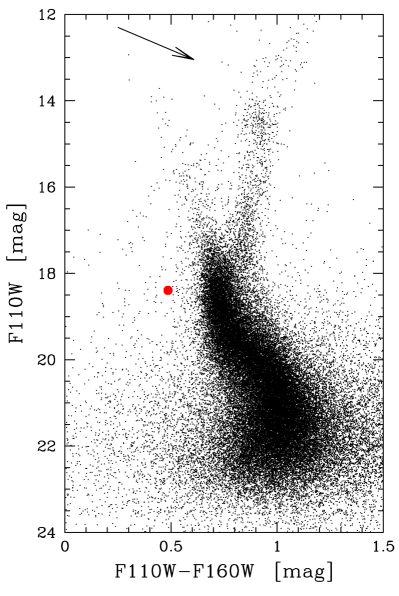
To obtain more information on the nature of the variable object we constructed a color-magnitude diagram based on the HST WFC3/IR data (Fig. 6). As mean magnitudes of the variable, we adopted values determined from the longest F110W and F160W exposures (599 s), since these cover a major fraction of the period (%). In the diagram, the object is located at (F110WF160W, F110W) = (0.459, 18.352), which is about 0.25 mag blueward of the main-sequence turnoff point. This position shows that our object is hot. For comparison, the neighboring constant star located 03 northeast of the variable can be found well within the main sequence at (F110WF160W, F110W) = (0.724, 18.745).
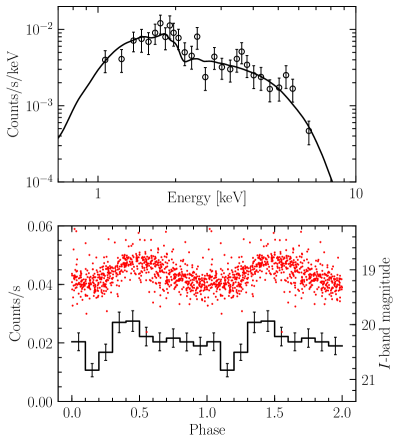
We notice that the investigated system emits X-rays. The area of globular cluster Djorg 2 was exposed by the Chandra satellite observatory for 22.67 ks (about 6.3 hr) on 2017 May 13. There is only one faint ( cts s-1) point X-ray source detected within the cluster area and located from the position of the variable star. We used CIAO 4.11 software (Fruscione et al., 2006) and CALDB version 4.8.3 to extract the X-ray spectrum of the source, which is shown in the upper panel of Fig. 7. The spectrum can be well described by an absorbed power law with the photon index . The estimated equivalent hydrogen column density ( cm-2) is consistent with the interstellar extinction toward the cluster. The X-ray modeling was performed using the Sherpa package (Freeman et al., 2001). The total unabsorbed flux in the range 0.5–10 keV is erg s-1 cm-2, which corresponds to the luminosity of erg s-1, assuming the source is associated with the cluster at the distance of 8.75 kpc (Ortolani et al., 2019). In the lower panel of Fig. 7, we compare the phased X-ray light curve with the optical light curve from 2017. We applied a barycentric correction to the data. Correlation between the X-ray and optical signal is strong with a coefficient of 0.72, as obtained after binning both phased light curves into 10 bins.
4 Conclusions
All facts reported above indicate that the discovered OGLE variable object is a UCXB. UCXBs are a subgroup of low-mass X-ray binaries (LMXBs) in which the primary component is either a black hole or a neutron star. Lack of other periodicities in the long-term OGLE photometry means that the 12.79 minute signal represents the orbital period of the binary. Spin period of the primary is likely too short to be detected in the OGLE data. X-ray emission is an evidence for accretion processes in the system. The presence of brightenings lasting several hours and the light curve shape in the optical regime point to a small accretion disk around the primary. Our object cannot be a close cataclysmic system of AM CVn type formed of a white dwarf accretor and a degenerate helium-rich donor. In such systems, outbursts do not occur at orbital periods shorter than about 20 minutes (Solheim, 2010; Ramsay et al., 2018) and the X-ray spectrum is softer, with a peak around or below 1 keV (e.g., Strohmayer, 2004; Ramsay et al., 2006). We name the newly discovered object OGLE-UCXB-01.
About a third of known UCXBs were found in globular clusters (Nelemans et al., 2010). For instance, the prototype of the whole group, 4U 1820-30 or Sgr X-4, resides in Galactic bulge globular cluster NGC 6624 (Stella et al., 1987). OGLE-UCXB-01 is observed within the core radius of cluster Djorg 2. It may belong to this cluster. Assuming the distance to Djorg 2 is 8.75 kpc (Ortolani et al., 2019) and approximate extinction in this direction mag (based on the interstellar calculator provided in Nataf et al., 2013), we find that the star with the observed brightness F606W 21.2 mag (broad band) would have an absolute brightness mag, which is a typical value for UCXBs (Nelemans et al., 2010).
We could consider the possibility that the new object is a binary system containing a slowly rotating spinning-up accreting neutron star. The observed optical modulation would be the spin period of the neutron star with the measured spin-up rate. In this interpretation, however, it is difficult to explain the absence of a longer modulation representing the orbital period of the system. Nevertheless, the newly detected object requires an optical spectrum that may reveal chemical composition of the accreted matter. Long-term X-ray monitoring would allow searching for X-ray bursts and their possible correlation with optical outbursts. Radial velocity and proper motion measurements should provide the answer to the question whether the object belongs to globular cluster Djorg 2. OGLE-UCXB-01 as an ultracompact low-mass binary with a fast period decrease is expected to be a strong gravitational-wave source in the low-frequency regime. Once the cluster membership is confirmed or the distance to the system is well determined, the object may serve as a verification target for planned space mission LISA.
References
- Alard & Lupton (1998) Alard, C., & Lupton, R. H. 1998, ApJ, 503, 325
- Dolphin (2000) Dolphin, A. E. 2000, PASP, 112, 1383
- Freeman et al. (2001) Freeman, P., Doe, S., & Siemiginowska, A. 2001, Proc. SPIE, 4477, 12
- Fruscione et al. (2006) Fruscione, A., McDowell, J. C., Allen, G. E., et al. 2006 Proc. SPIE, 6270, 1V
- Harris (1996) Harris, W. E. 1996, AJ, 112, 1487
- Mróz et al. (2015) Mróz, P., Udalski, A., Poleski, R., et al. 2015, AcA, 65, 313
- Nataf et al. (2013) Nataf, D. M., Gould, A., Fouqué, P., et al. 2013, ApJ, 769, 88
- Nataf et al. (2015) Nataf, D. M. 2015, MNRAS, 449, 1171
- Nelemans et al. (2010) Nelemans, G., & Jonker, P. G. 2010, New Astronomy Reviews, 54, 87
- Ortolani et al. (2019) Ortolani, S., Held, E. V., Nardiello, D., et al. 2019, A&A, 627, A145
- Pietrukowicz et al. (2017) Pietrukowicz, P., Dziembowski, W. A., Latour, M., et al. 2017, NatAs, 1, 166
- Ramsay et al. (2006) Ramsay, G., Groot, P. J., Marsh, T., et al. 2006, A&A, 457, 623
- Ramsay et al. (2018) Ramsay, G., Green, M. J., Marsh, T. R., et al. 2018, A&A, 620, A141
- Schwarzenberg-Czerny (1996) Schwarzenberg-Czerny, A. 1996, ApJ, 460, 107
- Solheim (2010) Solheim, J.-E. 2010, PASP, 122, 1133
- Soszyński et al. (2014) Soszyński, I., Udalski, A., Szymański, M. K., et al. 2014, AcA, 64, 177
- Soszyński et al. (2015) Soszyński, I., Udalski, A., Szymański, M. K., et al. 2015, AcA, 65, 297
- Stella et al. (1987) Stella, L., White, N. E., & Priedhorsky, W. 1987, ApJ, 315, 49
- Strohmayer (2004) Strohmayer, T. E. 2004, ApJ, 614, 358
- Udalski et al. (2008) Udalski, A., Szymański, M. K., Soszyński, I., & Poleski, R. 2008, AcA, 58, 69
- Udalski et al. (2015) Udalski, A., Szymański, M. K., & Szymański, G. 2015, AcA, 65, 1
- Woźniak et al. (2000) Woźniak, P. R. 2000, AcA, 50, 421